
Abstract
Bathymetry critically influences the intrusion of warm Circumpolar Deep Water onto the continental shelf and under ice shelf cavities in Antarctica, thereby forcing ice melting, grounding line retreat, and sea level rise. We present a novel and comprehensive bathymetry of Antarctica that includes all ice shelf cavities and previously unmeasured continental shelf areas. The new bathymetry is based on a 3D inversion of a circumpolar compilation of gravity anomalies constrained by measurements from the International Bathymetric Chart of the Southern Ocean, BedMachine Antarctica, and discrete seafloor measurements from seismic and ocean robotic probes. Previously unknown troughs with thicker ice shelf cavities are revealed in many parts of Antarctica, especially East Antarctica. The greater depths of troughs on the continental shelf and ice shelf cavities imply that many glaciers are more vulnerable to ocean subsurface warming than previously thought, which may increase the projections of sea level rise from Antarctica.
Introduction
In Antarctica, glaciers are buttressed by ice rises and floating extensions of the ice sheet named “ice shelves”, which regulate the discharge of ice from the continent in the Southern Ocean1. As more subsurface, warm and saline ocean water of Circumpolar Deep Water (mCDW) origin is pushed toward Antarctica by prevailing westerly winds, the ice shelves basal melt increased, eroding more quickly ice shelves into the ocean. This loss of ice mass reduces the ability of ice shelves to retain glacier flow, which increases the contribution of Antarctica to sea level rise2,3. To project the evolution of Antarctica, it is essential to understand where and how warm CDW intrudes on the continental shelf, flows down seafloor pathways into ice shelf cavities, and reaches the ice shelf grounding zone to melt basal ice4,5. In places where the bathymetry is shallow (<300 m), CDW may be blocked from accessing the glaciers. In this case, the ice shelf thickness may also play a role in affecting the cavity shape. Conversely, if the seafloor topography is deep (650–750 m, e.g. around Pine island glacier5), CDW will easily access ice shelf cavities. While extensive bathymetry mapping has been conducted in a number of critical sectors, there are many parts of Antarctica where bathymetry is incomplete or non-existent6, which limits our ability to understand ongoing changes and project future changes.
Bathymetry is primarily measured from icebreaking ships equipped with acoustic multibeam or single beam echo sounders (MBES, SBES)6. The presence of extensive sea ice cover and stranded icebergs in front of the ice shelves makes the navigation difficult. Consequently, vast territories are devoid of seafloor soundings in Antarctica. Mapping bathymetry beneath ice shelves presents additional challenges requiring seismic surveying7, autonomous underwater vehicles (AUV)8,9,10,11, or Conductivity, Temperature, Depth (CTD) data collected through bore holes in the ice, which is done at discrete locations. Although many ice shelves have been subject to these techniques at extensive scales, adequate coverage is lacking on all but eight of the 160 largest ice shelves (PIG, Ronne, Ross, Fimbul, Larsen C, Amery, Totten, George VI), due to the challenges of implementing them6,12.
Free-air gravity anomalies (which are technically disturbances, but will be referred as free-air anomalies for conventions13) inform about variations in water thickness and bedrock-sediment density beneath ice shelves. Prior studies have shown that a three-dimensional (3D) inversion of gravity data, constrained by observations of seafloor depth, is an effective, physics-based method for modelling bathymetry7,12,14,15,16,17. In-situ constraints include MBES and SBES data, seismic recordings, and depth recordings from CTD. The nominal precision of a gravity inversion is ±60 m with gravity data collected with a precision at the milligal level15,18. Gravity data is also wavelength limited based on depth to source and filtering applied in post processing14,16,19,20,21. A key feature of recent inversions is to offer a smooth transition with models of bed topography beneath the grounded ice, e.g. BedMachine Antarctica v3.7 (BMv3.7)22, and with the International Bathymetric Chart of the Southern Ocean (IBCSOv2)6 to avoid discontinuities at domain boundaries.
Here, we employ a novel, comprehensive, compilation of gravity anomalies, named AntGG2021, which superseeds a prior version, named AntGG201623 to infer the bathymetry of the continental shelf and ice shelf cavities. We present the data and methods, observational constraints, inversion results, and performance assessment. We discuss key regions of Antarctica and how the new bathymetry will improve our understanding of ice-ocean interaction and glacier evolution.
Methods
AntGG2021 gravity compilation
Ground-based and airborne gravity measurements have been compiled in the frame of the International Association of Geodesy Sub-Commission 2.4f “Gravity and Geoid in Antarctica” (AntGG)23. A first compilation of combined and gridded gravity anomalies was published by23, hereafter called AntGG2016. This compilation covered about 73% of the Antarctic continent and had a grid resolution of 10 km. Since then, a number of new gravity data sets have been made available, especially over regions where in-situ data were sparse or missing, e.g. at South Pole24, in Dronning Maud Land, East Antarctica25, over the Pensacola Basin26 or in Marie Byrd Land, West Antarctica27. Applying an improved processing workflow and taking all available in-situ gravity data into account led to a new compilation28, AntGG2021.The grid has a resolution refined from 10 to 5 km, and covers all of Antarctica south of \(60^{\circ }\)S, providing different quantities. In this study, we use the AntGG2021 gravity anomaly product created by Scheinert et al.29 and available at PANGEA (https://doi.pangaea.de/10.1594/PANGAEA.971238).
The improved processing scheme incorporates the remove-compute-restore (RCR) technique30. This method in geodesy helps align different gravity data sets with an a-priori Earth gravity model based on satellite and topographic data31. During this procedure, long-wavelengths as well as short-wavelengths signal parts are removed from the original gravity observations. We use a high-resolution gravity model SATOP-131 to compute the reduction (residual gravity anomalies) directly at the respective measurement location. The SATOP-1 model is inferred in the spheroidal-harmonic domain from a weighted combination of a satellite-only model and a high-resolution topographic model EARTH201432,33 (see Supplementary Information).
For the computation step, a partition-enhanced least-squares collocation (LSC) method is applied34 which incorporates the stochastic properties of the residual gravity data and allows to compute the desired gravity anomalies at any given point in space, thus, also on a regular grid with the desired 5 km resolution as well as at different height levels, which implicitly contains the downward continuation to the ice surface elevation. It is an advantage of LSC that all desired quantities are computed as functionals of the disturbing potential, \(T\), and that the method provides an accuracy measure (see Supplementary Information). This provides a unified theoretical framework, and ensures that all computed quantities are consistent with each other. Finally, the contribution of the background model is restored directly at the grid points.
As we move away from ground or airborne data, the gravity grid of AntGG2021 becomes closer to the background gravity model SATOP-131, at a lower resolution, hence resulting in higher uncertainties in gravity (Fig. S1). In regions with no terrestrial data, the larger errors of SATOP-1 are expected to be outweighted due to the regularized least-squares adjustment strategy when combining the satellite with the topographic data (see above). In these areas with no terrestrial observations, standard deviations values are exceeding 15 mGal (Fig. 1E). Regions covered by terrestrial gravimetry data have standard deviations typically ranging between 2 and 8 mGal.

Gravity data and constraints for the inversion. (A) AntGG2021 free-air gravity anomalies color coded from −150 mGal (1 Gal = 1 m/\(\hbox {s}^{2}\)) to +150 mGal with location of MBES/SBES from6. (B) Geographic names and ocean temperature at 310-m depth from the Southern Ocean State Estimate (SOSE) model61 color-coded from cold (\(-2\,^{\circ }\)C, blue) to warm (\(+2\,^{\circ }\)C, red). White areas are less than 310 m depth. Ice shelves are light blue. Bed beneath grounded ice is black if below sea level, grey otherwise. Zoom in on (C) English and (D) George V Coasts with bathymetry from MEOP41 in pink and IBCSOv2 or seismic in black. (E) Standard deviation map of free-air gravity anomalies from AntGG2021. The map is color coded from 1.5 mGal (blue) to +15.5 mGal (yellow). Standard deviations of 15 mGal indicates regions that are not covered by terrestrial gravity measurements.
Model setup
For each ice shelf region (Fig. S2), the model domain includes an ice layer (density 0.9167 g/\(\hbox {cm}^{3}\)), a water layer (density 1.028 g/\(\hbox {cm}^{3}\)), and a bedrock layer (density of 2.67 g/\(\hbox {cm}^{3}\)). For the bedrock elevation beneath grounded ice, we use BMv3.7, which has been fed with IBCSOv26. For ground observation seafloor depths, we use MBES and SBES data in IBCSOv2. The method of16 is used to account for changes in bedrock density (see section “Gravity inversion”).
Seismic data is available for Pine Island, Larsen C, Fimbul, Amery, George VI, Ross, Ronne and Totten ice shelves35,36,37,38,39,40 (see Table S2). We use AUV data for Pine Island8, CTD data from the Hadley Centre (bodc.ac.uk) between 1960 and 2019, and seafloor depths from the Marine mammals Exploring the Ocean Pole to Pole project (MEOP)41. For each available mammal dive, we calculate a maximum dive depth and assemble an Antarctic-wide maximum dive depth map (Fig. 1C,D; Fig. S3). We calculate the maximum dive depth, median, and standard deviation inside a rolling window of 10x10 km. If the 2-\(\sigma\) value is greater than 100-m (i.e., the expected accuracy of the gravity inversion18,19), we use the dive with the maximum depth. Note that max dive depth indicates regions where the bathymetry could potentially be deeper, but not shallower. In other cases, we use the average dive depth within the 10x10 km window, and merged the final layer into BMv3.7 using bilinear interpolation.
Gravity inversion
We used the approach of Parker’s 197342, which applies a series of Fourier transforms to calculate the gravitational anomaly generated by a layer of material with uneven density, inside the Geosoft GM-SYS 3D software. A forward model of the gravity anomalies associated with an initial bedrock elevation (compilation of IBCSOv2, MEOP, seismic and AUV) is then calculated. The forward gravity signal is compared to AntGG2021 and the bedrock is iteratively migrated until the misfit between modeled and observed gravity anomaly is less than a arbitrary set threshold of 0.1 mGal15,18. Experiments with thresholds ranging from 0.1 to 5 mGals revealed no significant changes in bedrock topography, and no overfitting, suggesting that the first iteration provides the largest changes in seafloor elevation. During the inversion procedure, only the bedrock topography is authorized to move downward or upward, meaning that a new water column thickness is calculated at each iteration. The new model geometry is then re-forward calculated. To account for spatial variations in the long-wavelength regional component of the gravity signal due to bedrock geology, we follow the approach in16 (“DC-shift” approach), which uses the misfit between observed and modeled gravity at locations of known seafloor depths and interpolates the signal in between using a minimum curvature algorithm. The interpolated grid is then added to the original gravity data. This method has shown comparable performances with density inversion methods, with the advantage of lower computational time since only one inversion is needed. This is of particular interest when conducting large scale inversion all around the Antarctic coast (see Fig. 1).
We conduct the inversion around the entire continent, including all ice shelf cavities, divided into 20 subregions (R1–R20) to minimize the computational cost (Fig. S1). In the final inversion product, the bathymetry conserves pre-existing seafloor depth measurements, which were also used as constraints during the inversion procedure. As the inversion might be really sensitive to local isolated data, and to high-frequency free-air gravity anomalies16,43, strong changes in the gravity signal or outliers may alter the precision of the inversion. We follow a multi-step filtering procedure. From an initial inversion, we identify poor performance areas based on abrupt transitions or low water column thickness (\(<30\) m). Indeed, a very thin water column indicates a region where the ice could be potentially grounded. If this has never been detected by SAR interferometry mapping44, we posits that our inversion is failing at recovering the seafloor depth. We smooth out high-frequency variations in the misfit gravity grid using a low-pass filter (between 7.5 and 15 km width) and re-run the inversion. If poorly performing regions are still present, we mask the bathymetric misfits and use a minimum curvature interpolation scheme to fill the gap (Fig. S3).
Inversion error assessment
We quantify the error related to the inversion process, by calculating the misfit between observed and modeled gravity, which we translate in meters using a conversion factor of 5.8 mGal per hundred meters14,15.The misfit value provides an estimate of how well our method can fit the observed gravity signal. The performance of the inversion is also quantified by comparing the inversions with seismic measurements when available. To accurately quantify the uncertainty on our method, we perform three inversions test in rectangular regions of 200 km by 125 km, with dense MBES coverage, and where the standard deviation of AntGG varies from a minimum value of 4.9 mGal to a maximum value of 8.1 mGal. The tests are located in front of the Brunt–Stancomb ice shelf (Fig. S4), the Jelbart ice shelf (Fig. S5) (rectangular region of 250 km by 185 km) and the George VI ice shelf (Fig. S6), respectively centered at \(67.242^{\circ }\)W, \(38.097^{\circ }\)N; \(68.773^{\circ }\)W, \(4.586^{\circ }\)S and \(73.473^{\circ }\)W, \(27.590^{\circ }\)S. The three domains have a extensive free-air gravity anomalies coverage, with a mean standard deviation as follows, 5.58 ± 2.02 mGal (Fig. S4-H); 7.08 ± 1.94 mGal (Fig. S5-H) and 7.8 ± 0.96 mGal (Fig. S6-H) respectively. The inversion domain offshore of Jelbart ice shelf is the only one located on the abyssal plain. We only use MBES data along the periphery to constraint the inversion, and remove available MBES in the center. The accuracy is finally quantified by comparing the results with the actual “unseen” MBES data16. The actual accuracy of the inversion beneath ice shelves will be critically influenced by the coverage and resolution of the available airborne gravity data and distribution of observed tie points. However, a part of the quality of the fit between recovered bathymetry and unseen MBES data (e.g. Fig. S4-G), especially at high frequencies, can also be explained by the inclusion of topographic information in the inference of the AntGG2021 model (via the a-priori SATOP-1 model), which can potentially “leak” into the final inversion results.
Results
Our product is an Antarctic-wide gravity inversion for bathymetry (referred to the geoid), including all ice shelves. We obtain an calculated gravity inversion misfit of −0.1 ± 1.6 mGal, which translates into a nominal inversion elevation misfit of −1.5 ± 27.5 m. This quantity represents the remainder of the gravity signal that the inversion is not able to fit. The performance of the inversion is also quantified for each domain, by calculating statistic of the differences between the bathymetry and available seismic measurements (mean ± standard deviation, see below). Inside the test boxes, the comparison between inverted bathymetry and unseen data shows differences of −15 ± 105 m (George VI), 2 ± 123 m (Brunt–Stancomb) and 23 ± 176.3 m (Jelbart) (Fig. S6-G; S4-G; S5-G). For higher precision gravity measurements conducted in Greenland (1.5 mGal at crossovers), differences with MBES of −10 ± 60 m were reported16. These different experiments allows us to provide an estimate of the inversion uncertainty as a function of the gravity standard deviation using a linear fit between the standard deviation from the AntGG2021 (Fig. 1C) and the standard deviation of the difference between inversion results and unseen bathymetry data. The final uncertainty, is about 162 ± 46 m (mean±standard deviation), over all our inversion domains (see Supplementary Table 3 ; Fig. S9). It is important to note that uncertainties may be underestimated, and could reach several hundreds of meters, in regions with no terrestrial gravity measurements. These are the places where lack of airborne gravity data is critical (e.g. Fig. 2G,H).
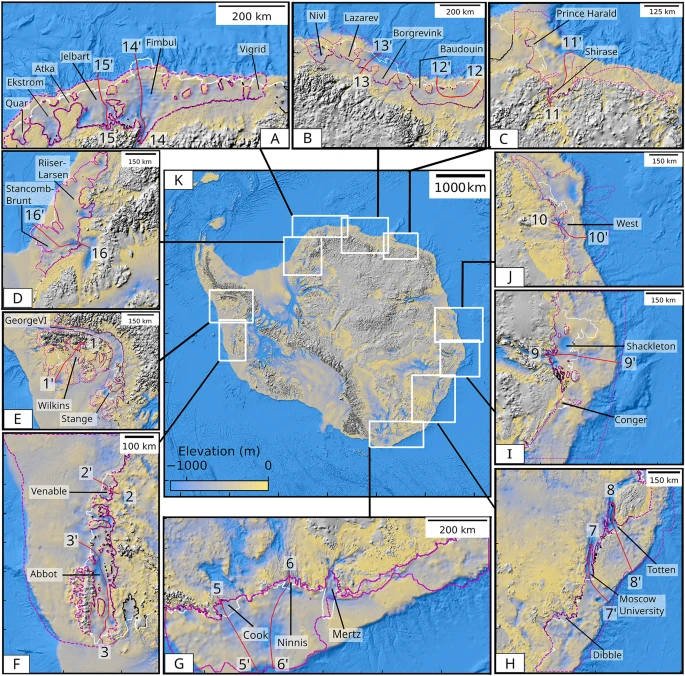
Bathymetry of Antarctica color coded from −1250 m (blue) to 0 m (yellow) with shaded relief for 10 regions: (A) Jebart and Fimbul (R19), (B) Borgrevink and Baudouin (R18), (C) Shirase (R17), (D) Brunt–Stancomb Wills (R20), (E) George VI (R3), (F) Abbot and Venable (R4), (G) Cook, Ninnis, Mertz (R11), (H) Moscow, Totten (R12), (I) Shackleton (R13) and (J) West (R14), with ice shelf boundary in white and inversion domains in purple. Profiles shown in Fig. 3 are red. (K) Overview of the 10 sub-regions.
For regions lacking in-situ data, uncertainties in bed density introduce larger errors that are difficult to quantify16. Uncertainties in free air gravity anomaly (Fig. S1) are the highest between Victoria Land and Queen Mary coast, which are devoid of airborne or ground data and therefore mostly rely on SATOP-1.
Overall, our new product shows deeper bathymetry in the majority of the regions with an overall difference with BedMachine v3 of 56 ± 160 m (mean ± standard deviation). However, we observe that local differences, at the scale of channels, can be largely higher and reach several hundreds of meters, which has the potential to directly impact CDW penetration on the continental shelf and the glacier’s grounding lines. We both found large changes in bathymetry in West Antarctica (e.g. Wilkins, Venable, Abbott, etc.) and East Antarctica (e.g. West, Moscow, Denman, Shirase, Borgrevink and Jelbart, etc.). In the following section we describe these differences in detail and compare them with earlier products.
In the Antarctic Peninsula (R2–R3), the bathymetry of Larsen C (46,465 \(\hbox {km}^{2}\) in size) and D (22,548 \(\hbox {km}^{2}\)) reveals a deeper bed with previously unknown channels on the continental shelf. Subglacial valleys up to 1000 m deep and 200–400 m deeper than IBCSOv2 are found in Whirlwind and Mobil Oil Inlets (Fig. S7b). On Larsen D, the bathymetry is up to 600 m deeper than IBCSOv2 with an east-west trough at 1200 m depth along Wilkins coast. The new bathymetry is 98 ± 176 m deeper on average. We fit seismic data45 within 2 ± 44 m. Beneath Wilkins Ice Shelf in R3, the bathymetry is up to 600 m deeper than IBCSOv2 and 650 m deeper beneath Stange Ice Shelf (Fig. 3). For George VI Ice Shelf (23,434 \(\hbox {km}^{2}\)), the bathymetry is 57 ± 133 m deeper than prior inversions46 (Table S1). We fit seismic data within 4 ± 43 m47 (Fig. S7c).
In West Antarctica (R4–R9), Abbot (29,688 \(\hbox {km}^{2}\)) and Venable (3194 \(\hbox {km}^{2}\)) have bathymetry considerably deeper (>400 m) than IBCSOv2 (Fig. S7d). We find a 100-km wide trough, 1500 m in depth, along the middle of Abbot 400 m deeper in IBCSOv2. The trough extends across the continental shelf. The bathymetry in R4 is 77±173 m deeper on average (Table S1). Our inversion is an improvement to the21 inversion. Indeed, this study uses more radar sounding data, that were measured by Operation Icebridge between 2014 and 2018. We also have larger MBES coverage, which increased south of \(60 ^{o}\) S from 15.4% in IBCSOv1 to 25% in IBCSOv26,48. We also use 3D inversions, unlike the 2D inversions in21, which allows to better account for changes in bedrock geology variations (through density inversion or DCShift method here). Indeed, two dimensions inversions can only account for geological changes along individual flight lines. In contrast, our 3D approach enables us to account for geological variations laterally, across all lines simultaneously and over the inversion domain.
The bathymetry beneath Cosgrove and Pine Island (R5) is revised from14 (Fig. 3). The seafloor is 47 ± 113 m deeper than IBCSOv2 (Table S1). Cosgrove is 150–300 m deeper near the grounding line and 950 m deep at the ice front. Pine Island is 100 m deeper at the grounding line as ambiguities in ice thickness are resolved. We fit the seismic and AUV data within 1 ± 38 m (Fig. S7e). Getz Ice Shelf (34,018 \(\hbox {km}^{2}\)) in R7 is similar to43 (Fig. S7g). The bathymetry is 16 ± 98 m deeper, with no change in sill depth between east and west Getz. In R8, Hull, Land, and Nickerson ice shelves (6500 \(\hbox {km}^{2}\)) have deeper bathymetry, with more pronounced troughs than in IBCSOv2, especially along Balchen Glacier. Along Ruppert Coast and Sulzberger Ice Shelf (12,333 \(\hbox {km}^{2}\)), the bathymetry is similar to IBCSOv2, with a succession of parallel channels up to 1500 m deep extending on the continental shelf (Fig. S7h). The bathymetry is 98 ± 196 m deeper on average (Table S1).
Ross Ice Shelf (500,809 \(\hbox {km}^{2}\)) (R9) benefits from a dense network of seismic data. The seafloor depth is 2300 m at the mouth of Byrd Glacier, rises at 550 m following the ice flow direction and goes down to 1900 m. This step in bathymetry is probably due to an artefact in AntGG2021 that was manually removed, but still has a partial impact on the result. East-west oriented artefacts in the gravity grid are also present below Ross. On average, the new bathymetry is 25 ± 101 m deeper (Table S1). We fit seismic data within 0 ± 101 m (Fig. S7i). Data from the ROSETTA-ice are currently missing from the new AntGG compilation and should be added in a future version.
In East Antarctica (R10–R20), R11 along George V Coast, the ANTGG compilation mostly rely on the background model. Hence uncertainties are difficult to quantify and could reach several hundreds of meters. Our inversion reveals new large scale bathymetric depressions on the continental shelf in front of Cook (3462 \(\hbox {km}^{2}\)), Ninnis (1899 \(\hbox {km}^{2}\)) and Mertz (5522 \(\hbox {km}^{2}\)) at 1200 m, 1600 m and 1300 m depth, respectively (Fig. 2, Fig. S7k) that extend on the continental shelf. The new bathymetry is 500, 300, and 600 m deeper beneath Cook, Mertz, and Ninnis, respectively, and 73 ± 170 m deeper on average (Table S1). This region is one of the most uncertain of all inversion domain, and errors could reach several hundreds of meters.
Holmes (1921 \(\hbox {km}^{2}\)), Moscow University (5798 \(\hbox {km}^{2}\)), Totten (6032 \(\hbox {km}^{2}\)) and Vincennes Bay in R12 are improved compared to prior work49 due to the 3D inversion, new seismic40, and MBES/SBES data50. The bathymetry is 73 ± 230 m deeper in average (Table S1), up to 600 m beneath Moscow. Large scale depression are also visible extending from the ice front further away on the continental shelf (Fig. 2 and 3). We fit seismic data within 37 ± 81 m (Fig. S7l).
For Shackleton (26,080 \(\hbox {km}^{2}\)) (R13), we find a broader trough beneath the ice shelf, extending across the continental shelf, 1000 m deeper than IBCSOv2 (Fig. S7m, Fig. 3). On average, the bathymetry is 78 ± 177 m (mean ± standard deviation), deeper than IBCSOv2 (Table S1). We find a positive anomaly near Conger Ice Shelf that cannot be resolved and had to be masked out and interpolated.
West (15,666 \(\hbox {km}^{2}\)) (R14) has few MBES data (Fig. 1, Fig. S7n). We find a cavity 300–600 m deeper below West N.and West S., respectively (Fig. S7n). On the continental shelf, previously unknown deep troughs at 1400 m depth extend to the edge of the continental shelf. The bathymetry is 106 ± 186 m deeper on average (Table S1).
Amery (R15) is deeper than IBCSOv2 about 200 km from the grounding line but within 2 ± 168 m on average (Table S1). Few observational constraints are available at the grounding line, which has been shown to be too deep51. The 1000-m step at Mellor Glacier is largely an artefact. We fit seismic data within 9 ± 37 m, but uncertainties are unresolved near the grounding line (Fig. S7o).
Wilma–Robert/Edward VI and Rayner-Thyer in R16 are 450–300 m deeper than IBCSOv2 (Fig. S7p) and 195 ± 220 m deeper on average (Table S1). Prince Harald (5392 \(\hbox {km}^{2}\)) and Shirase (821 \(\hbox {km}^{2}\)) (R17) are 100 and 300 m deeper, respectively. Two previously unknown troughs appear on the continental shelf, with a depth of 1250 m at the shelf break (Fig. 2, Fig. S7q). The bathymetry is 41 ± 176 m deeper on average.
Baudouin (32,952 \(\hbox {km}^{2}\)), Borchgrevink (21,580 \(\hbox {km}^{2}\)), Lazarev (8519 \(\hbox {km}^{2}\)) and Nivl (7285 \(\hbox {km}^{2}\)) (R18) in Queen Maud Land are 117 ± 189 m deeper than IBCSOv2 (Table S1). The largest changes are found on the eastern part. We fit seismic data52 within −57 ± 57 m. The inversion in53 is comparable to our product in the eastern part of Baudouin, but shallower elsewhere (Fig. S7r). We lack bathymetric constraints at the edge of the continental shelf, where positive gravity anomalies associated with the geologic transition between the continental shelf front and the deep ocean yield higher uncertainties for the inversion.
Vigrid, Fimbul (40,843 \(\hbox {km}^{2}\)), Jelbart (10,844 \(\hbox {km}^{2}\)), Atka, Ekstrom (6872 \(\hbox {km}^{2}\)) and Quar in R19 are deeper to the north (Fig. S7s)54. We find a deeper channel beneath Fimbul at 1570 m depth 20 km from the grounding line (Fig. 3). Jelbart has multiple troughs and a basin at 1200 m depth that includes ridges and pinning points (Fig. 3). Ekstrom is 200 m deeper than IBCSOv254. We fit seismic data within −3 ± 32 m. The bathymetry is 56 ± 136 m deeper on average (Table S1).
Riiser-Larsen (43,450 \(\hbox {km}^{2}\)) and Brunt–Stancomb Wills (36,894 \(\hbox {km}^{2}\)) (R20) are challenging to invert. A rise in gravity anomaly between the two ice shelves is difficult to correct, resulting in a lower precision for the inversion (Fig. S7t). We find two channels at 1500 m depth beneath Brunt, consistent with17, but 300 m deeper along the main trough and 400 m deeper in the eastern part. We match seismic data within −3 ± 48 m. The bathymetry is 52 ± 144 m deeper on average (Table S1).
For Ronne–Filchner (443,140 \(\hbox {km}^{2}\)) in R1, we fit seismic data within −3 ± 3239. The bathymetry is 19 ± 78 m deeper on average (Table S1), with most differences near the grounding line of Evans (400 m), Hercules (970 m) and Rutford (380 m) (Fig. S7a).
Discussion
The overall change in bathymetry compared to IBCSOv2 is estimated with seafloor depth 69 ± 159 m deeper on average, with much higher local differences. This magnitude change illustrates the level of uncertainty of existing maps, especially for ice shelf cavities. In the absence of observational constraints, mathematical extrapolations have produced smooth, shallow bathymetric solutions with no troughs. Improvements result from the combination of BMv3.7 on land, MBES/SBES, seismic, AUV, MEOP and CTD data. The 3D inversion maximizes the use of AntGG2021, which has no gaps and a higher spatial resolution than AntGG201616. The AntGG2021 compilation is an improved version of ANTGG2016, with additional gravity data and the use of a better optimized RCR method to reconstruct data gaps. The low-pass filtering of the gravity misfit helps constrain the inversion by removing outliers caused by poorly digitized radar sounding data, excessively localized SBES, and rapid bed transition not constrained by in-situ data (Fig. S3). This critical step is region dependent and varies among prior studies16,19,20,54, which makes it difficult to quantify and explain differences between products. Our map of filtered (corrected from aberrant bathymetric measurements) data sources will help future inter-comparison of gravity inversion methods (Fig. S3). In areas with few direct bathymetric measurements, the inversion misfit exceeds 80 m. This situation is exacerbated at the edge of the continental shelf (R12–R14, R19), where bathymetry might be 100–200 m deeper than represented herein because the positive gravity anomalies at the shelf break translate into anomalously shallow areas21. Further in-situ measurements are critical to better constrain the inversions in this zone. In regions that are missing airborne or ground gravity measurements (Fig. S1), bathymetric mapping should be analyzed on a large scale (tens to hundreds of kilometers), rather than at the scale of troughs. In such cases, our results allow for the use of a physical interpolation method between a large compilation of in-situ data available offshore and onshore, thus providing a more reliable estimate than the artifacts produced by mathematical interpolations. However, without high resolution airborne gravimetric data in these regions, the uncertainties will remain high (up to 250 m), which has a direct impact on the modeling of warm water pathways.
In the Peninsula, CDW at \(+1.2\,^{\circ }\)C at 350 m depth in front of Wilkins is below the grounding line depth, which is not exposed to CDW despite a deeper bathymetry than IBCSOv2 (Fig. 3.1). On George VI, the same CDW is deeper than the depth of grounding lines (300–400 m), which is consistent with its slow rate of retreat despite abundant CDW on the continental shelf (Fig. 3.1).
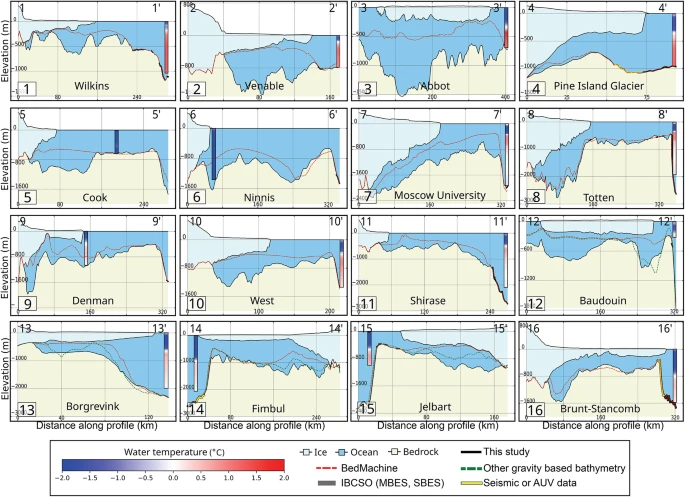
Comparison of AntGG2021 bathymetry with other data sources along specific profiles shown in Fig. 2 for 12 regions, and Pine Island Ice Shelf in Fig. S7e. Ice is light blue, ocean is blue, bedrock is light brown, IBCSOv2 is dotted red, new bathymetry is black, and observations are thick black. CTD observations are color coded from \(-2\,^{\circ }\)C to \(2\,^{\circ }\)C, with geographic locations in Fig. S8.
In West Antarctica, water warmer than \(+1\,^{\circ }\)C at 300 m depth in front of Venable is likely reaching its deep grounding line, whereas older bathymetry (BedMachine, IBCSO) suggested a shallow cavity (Fig. 3-2). For Abbot, warm water in excess of \(+1\,^{\circ }\)C below 400 m depth remains deeper than the grounding line depths, hence it is protected from CDW, but the previously unknown trough in the middle of Abbot will facilitate the flow of modified CDW along the Antarctic Coastal Current (AACC), which affects glaciers farther west in Pine Island Bay55 (Fig. 3). At Pine Island, warm CDW \(>+1\,^{\circ }\)C5 at 600 m depth faces no major obstacle to reach the grounding line.
In East Antarctica, near Cook and Ninnis, CTD data from 1970–198556 reveal cold waters at \(-1.2\,^{\circ }\)C, similar to Mertz (Fig. 3-5, 3-6), i.e. no modified CDW. Our bathymetry is deeper than IBCSOv2, revealing new troughs, not well constrained by MBES data. Cook lost its western ice shelf in the 1970s and Ninnis in the 2010’s, hence exposure to CDW may not be ruled out3.
CTD data in front of Moscow University and Totten reveal warm waters up to \(+1\,^{\circ }\)C at 500 m depth (Fig. 3-7). Our bathymetry includes easier pathways for CDW toward Moscow University, but with a lack of observational constraints at the shelf break, which is too shallow. On Totten, warm CDW flows down a narrow passage57 to yield high ice shelf melt rates40,58 and grounding line retreat59.
Water at \(+0.1{-}0.5\,^{\circ }\)C near Denman between 350 and 1400 m depth should reach its deep grounding line (Fig. 3-9), especially with the new bathymetry, which is consistent with the observed grounding line retreat and ice shelf melt rates58. Water at \(<1\,^{\circ }\)C at 500 m depth near West may expose its grounding line (500–600 m depth) to high melt, but we need new MBES data to constrain the inversion (Fig. 3-10).
For Shirase and Prince Harald, water \(>0.5\,^{\circ }\)C at 580–800 m depth is above the grounding line depth. The new bathymetry reveals a broader, deeper channel on the continental shelf toward both glaciers (Fig. 3-11). On Baudouin, the ice shelf cavities are deeper than IBCSOv2. Water at \(+0.25\,^{\circ }\)C below 250 m may reach the grounding lines at several locations, but additional observations are needed at the shelf break (Fig. 3-12).
Similarly warm water at the shelf break of Borgrevink may reach its deep grounding line (Fig. 3.13). Fimbul and Jelbart grounding lines at 1100 and 900 m depth are protected from warm water at the shelf break, which is shallow. In contrast, Jelbart, with a trough 750 m deeper than IBCSOv2, is likely exposed to warm waters (Fig. S7t). From Princess Astrid to the Brunt Coast, water at \(+0.5\,^{\circ }\)C below 900 m is deeper than the shelf break at 450–500 m, which likely protects the ice shelves (Fig. 3-16). The cavity beneath Brunt–Stancomb is deeper than in IBCSOv2. Warm water at 800 m depth stands below the edge of the continental shelf (400–600 m depth).
Several sectors await new observational constraints to resolve pathways for warm water, especially East Antarctica. The AntGG2021 bathymetry provides guidance on the likely location of troughs, sills, and areas of importance to be surveyed, e.g. Cook, Ninnis, Moscow, Shackleton, and West ice shelves. More in-situ observational constraints are needed to refine the results, especially at the shelf break. Ultimately, denser MBES/seismic or AUV coverage, including ice shelf cavities, is desired to improve vertical precision by one order of magnitude and spatial resolution (meters instead of km). Knowing the depth of troughs, sills, and pathways, at that precision will allow to model seasonal to interannual changes in the depth of the thermocline60. In the meantime, the AntGG2021 bathymetry should allow an improvement in our characterization of ocean circulation on the continental shelf and ice shelf cavities, which are now fully consistent based on a physical model. The results will be of immediate use to improve the projections of ice mass loss from Antarctica in a warming climate.
Conclusions
We present a novel, comprehensive bathymetry of Antarctica with all ice shelf cavities, including a smooth transition toward BMv3.7 on land and IBCSOv2 at sea. The results reveal deeper continental shelf in numerous regions, previously unknown troughs, and a greater exposure of the Antarctic grounding line to warm waters. The new product will allow for improvements in future in the modeling of ice-ocean interactions in Antarctica and in turn the reliability of projections of sea level rise from these glaciers because it provides a more realistic, physics-based description of ice shelf cavities than prior products. In the most critical sectors for sea level rise, we recommend detailed MBES surveys, especially at the shelf break, to improve the products for ice sheet/ocean modeling.
Data availability
The products described herein are available on Dryad at https://doi.org/10.5061/dryad.rbnzs7hkc. The AntGG2021 gravity compilation is available on pangea at https://doi.pangaea.de/10.1594/PANGAEA.971238. CTD data is available at the Hadley center and at https://climatedataguide.ucar.edu/, MEOPs data from the MEOPs archive at https://www.meop.net/database/meop-databases/meop-ctd-database.html. Other in-situ bathymetric data are available at https://ramadda.data.bas.ac.uk/repository/entry/show?entryid=a72a50c6-a829-4e12-9f9a-5a683a1acc4a and at https://ds.iris.edu/mda/20-017/.
References
Fox-Kemper, B., Johnson, L. & Qiao, F. Ocean near-surface layers. In Ocean Mixing, 65–94 (Elsevier, 2022).
Holland, D. M., Nicholls, K. W. & Basinski, A. The southern ocean and its interaction with theantarctic ice sheet. Science 367, 1326–1330 (2020).
Rignot, E. et al. Four decades of Antarctic Ice Sheet mass balance from 1979–2017. Proc. Natl. Acad. Sci. 116, 1095–1103 (2019).
Jacobs, S. et al. Getz Ice Shelf melting response to changes in ocean forcing. J. Geophys. Res. Oceans 118, 1–17 (2013).
Dutrieux, P. et al. Basal terraces on melting ice shelves. Geophys. Res. Lett. 41, 5506–5513 (2014).
Dorschel, B. et al. The International Bathymetric Chart of the Southern Ocean Version 2. Scientific Data 9, 275. https://doi.org/10.1038/s41597-022-01366-7 (2022).
Muto, A., Christianson, K., Horgan, H. J., Anandakrishnan, S. & Alley, R. B. Bathymetry and geological structures beneath the Ross Ice Shelf at the mouth of Whillans Ice Stream, West Antarctica, modeled from ground-based gravity measurements. J. Geophys. Res. Solid Earth 118, 4535–4546 (2013).
Jenkins, A. et al. Observations beneath Pine Island Glacier in West Antarctica and implications for its retreat. Nat. Geosci. 3, 468–472 (2010).
Dutrieux, P. et al. Strong sensitivity of Pine Island ice-shelf melting to climatic variability. Science 343, 174–178 (2014).
Lawrence, J. D. et al. Crevasse refreezing and signatures of retreat observed at Kamb Ice Stream grounding zone. Nat. Geosci. 16, 238–243 (2023).
Schmidt, B. E. et al. Heterogeneous melting near the Thwaites Glacier grounding line. Nature 614, 471–478 (2023).
Fretwell, P. et al. Bedmap2: improved ice bed, surface and thickness datasets for Antarctica. Cryosphere 7, 375–393 (2013).
Oliveira Jr, V. C., Uieda, L. & Hallam, K. A. T. Should geophysicists use the gravity disturbance or the anomaly? Geol. Phys.
Millan, R., Rignot, E., Bernier, V., Morlighem, M. & Dutrieux, P. Bathymetry of the Amundsen Sea Embayment sector of West Antarctica from Operation IceBridge gravity and other data. Geophys. Res. Lett. 44, 1360–1368 (2017).
Millan, R. et al. Constraining an Ocean Model Under Getz Ice Shelf, Antarctica, using a gravity-derived bathymetry. Geophys. Res. Lett. 47 (2020).
An, L., Rignot, E., Millan, R., Tinto, K. & Willis, J. Bathymetry of Northwest Greenland Using “Ocean Melting Greenland’’ (OMG) High-resolution airborne gravity and other data. Remote Sens. 11, 131 (2019).
Hodgson, D. A. et al. Past and future dynamics of the Brunt Ice Shelf from seabed bathymetry and ice shelf geometry. Cryosphere 13(2), 545–556 (2019).
Millan, R. et al. Vulnerability of Southeast Greenland Glaciers to Warm Atlantic Water from Operation IceBridge and Ocean Melting Greenland Data. Geophys. Res. Lett. 45, 288–2696 (2018).
Tinto, K. J. & Bell, R. E. Progressive unpinning of Thwaites Glacier from newly identified offshore ridge: Constraints from aerogravity. Geophys. Res. Lett. 38 (2011).
Tinto, K. J. et al. Ross Ice Shelf response to climate driven by the tectonic imprint on seafloor bathymetry. Nat. Geosci. 12, 441–449 (2019).
Cochran, J. R., Tinto, K. J. & Bell, R. E. Abbot Ice Shelf, the Amundsen Sea Continental Margin and the Southern Boundary of the Bellingshausen Plate Seaward of West Antarctica. Geochem. Geophys. Geosyst. 16, 1421–1438 (2014).
Morlighem, M. et al. Deep glacial troughs and stabilizing ridges unveiled beneath the margins of the Antarctic ice sheet. Nat. Geosci. 13, 132–137 (2020).
Scheinert, M. et al. New Antarctic gravity anomaly grid for enhanced geodetic and geophysical studies in Antarctica. Geophys. Res. Lett. 43, 600–610 (2016).
Forsberg, R. et al. Polargap 2015/16, final report, esa 4000115220/15/nl/gp (2017).
Eagles, G. et al. Erosion at extended continental margins: Insights from new aerogeophysical data in eastern Dronning Maud Land. Gondwana Res. 63, 105–116 (2018).
Paxman, G. J. G. et al. Subglacial Geology and Geomorphology of the Pensacola-Pole Basin, East Antarctica. Geochem. Geophys. Geosyst. 20, 2786–2807 (2019).
Young, D., Blankenship, D. D. & Holt, J. Gravity disturbance data over central Marie Byrd Land, West Antarctica (GIMBLE.GGCMG2) (2017).
Scheinert, M., Zingerle, P., Schaller, T., Pail, R. & Willberg, M. Towards an updated, enhanced regional gravity field solution for Antarctica. EGU General Assembly 2021, EGU21-9873 (2021).
Scheinert, M., Zingerle, P., Schaller, T. & Pail, R. Antarctic gravity anomaly and height anomaly grids (AntGG2021). https://doi.org/10.1594/PANGAEA.971238 (2024).
Sanso, F. & Sideris, M. (eds.) Geoid Determination—Theory and Methods (Springer, 2013).
Zingerle, P., Pail, R., Scheinert, M. & Schaller, T. Evaluation of terrestrial and airborne gravity data over Antarctica - a generic approach. J. Geod. Sci. 9, 29–40 (2019).
Hirt, C. & Rexer, M. Earth 2014: 1 arc-min shape, topography, bedrock and ice-sheet models - Available as gridded data and degree-10,800 spherical harmonics. Int. J. Appl. Earth Obs. Geoinf. 39, 103–112 (2015).
Hirt, C. et al. A new degree-2190 (10 km resolution) gravity field model for Antarctica developed from GRACE, GOCE and Bedmap2 data. J. Geod. 90, 105–127. https://doi.org/10.1007/s00190-015-0857-6 (2016).
Zingerle, P., Pail, R., Willberg, M. & Scheinert, M. A partition-enhanced least-squares collocation approach (PE-LSC). J. Geod. 95, 1–16 (2021).
Muto, A. et al. Subglacial bathymetry and sediment distribution beneath pine island glacier ice shelf modeled using aerogravity and in situ geophysical data: New results. Earth Planet. Sci. Lett. 433, 63–75 (2016).
Brisbourne, A. & Kendall, M. Downhole distributed acoustic seismic profiles at SkyTrain Ice Rise, West Antarctica, January 2020 (2021).
Smith, E. C. et al. Detailed Seismic Bathymetry Beneath Ekström Ice Shelf, Antarctica: Implications for Glacial History and Ice-Ocean Interaction. Geophys. Res. Lett. 47, e2019GL086187 (2020).
Galton-Fenzi, B., Maraldi, C., Coleman, R. & Hunter, J. The cavity under the Amery Ice Shelf, East Antarctica. J. Glaciol. 54, 881–887. https://doi.org/10.3189/002214308787779898 (2008).
Rosier, S. H. R. et al. A new bathymetry for the Southeastern Filchner-Ronne Ice Shelf: Implications for modern oceanographic processes and glacial history. J. Geophys. Res. Oceans 123, 4610–4623 (2018).
Vaňková, I. et al. High spatial melt rate variability near the Totten Glacier grounding zone explained by new bathymetry inversion. Geophys. Res. Lett. 50, e2023GL102960 (2023).
Charrassin, J.-B. et al. Southern Ocean frontal structure and sea-ice formation rates revealed by elephant seals. Proc. Natl. Acad. Sci. 105, 11634–11639 (2008).
Parker, R. L. The rapid calculation of potential anomalies. Geophys. J. Int. 31, 447–455. https://doi.org/10.1111/j.1365-246X.1973.tb06513.x (1973).
Millan, R. et al. Constraining an ocean model Under Getz Ice Shelf, Antarctica, using a gravity-derived bathymetry. Geophys. Res. Lett. 47, e2019GL086522 (2019).
Rignot, E., Mouginot, J. & Scheuchl, B. Antarctic grounding line mapping from differential satellite radar interferometry. Geophys. Res. Lett. 38. https://doi.org/10.1029/2011GL047109 (2011). https://agupubs.onlinelibrary.wiley.com/doi/pdf/10.1029/2011GL047109.
Brisbourne, A. et al. An updated seabed bathymetry beneath Larsen C Ice Shelf, west Antarctic. preprint (2019).
Constantino, R. R., Tinto, K. J., Bell, R. E., Porter, D. F. & Jordan, T. A. Seafloor depth of George VI Sound, Antarctic Peninsula, from inversion of aerogravity data. Geophys. Res. Lett. 47 (2020).
Maslanyj, M. Gravity and aeromagnetic evidence for the crustal structure of george vi sound, antarctic peninsula. British Antarctic Survey Bulletin 1–16 (1988).
Arndt, J. E. et al. The International Bathymetric Chart of the Southern Ocean (IBCSO) Version 1.0—A new bathymetric compilation covering circum-Antarctic waters: IBCSO VERSION 1.0. Geophys. Res. Lett. 40, 3111–3117 (2013).
Greenbaum, J. S. et al. Ocean access to a cavity beneath Totten Glacier in East Antarctica. Nat. Geosci. 8, 294–298 (2015).
Hirano, D., Tamura, T. & Kusahara, K. E. A. On-shelf circulation of warm water toward the Totten Ice Shelf in East Antarctica. Nat. Commun. 14, 4955 (2023).
Chen, H., Rignot, E., Scheuchl, B. & Ehrenfeucht, S. Grounding Zone of Amery Ice Shelf, Antarctica, from differential synthetic-aperture radar interferometry. Geophy. Res. Lett. 50, e2022GL102430 (2023).
Eisermann, H., Eagles, G. & Jokat, W. Coastal bathymetry in central Dronning Maud Land controls ice shelf stability. Sci. Rep. 14, 1367 (2024).
Eisermann, H., Eagles, G., Ruppel, A. S., Läufer, A. & Jokat, W. Bathymetric control on Borchgrevink and Roi Baudouin Ice Shelves in East Antarctica. J. Geophys. Res. Earth Surf. 126 (2021).
Eisermann, H., Eagles, G., Ruppel, A., Smith, E. C. & Jokat, W. Bathymetry beneath ice shelves of western dronning Maud Land, East Antarctica, and implications on ice shelf stability. Geophys. Res. Lett. 47 (2020).
Flexas, M. M., Thompson, A. F., Schodlok, M., Zhang, H. & Speer, K. Antarctic peninsula warming triggers enhanced basal melt rates throughout west antarctica. Sci. Adv. 8, eabj9134 (2022).
Foster, T. D. Abyssal water mass formation off the eastern Wilkes land cost of Antarctica. Deep Sea Res. Part I Oceanogr. Res. Pap. 42, 501–522 (1995).
Rintoul, S. R. et al. Ocean heat drives rapid basal melt of totten ice shelf. Sci. Adv. 2, e1601610 (2016).
Brancato, V. et al. Grounding line retreat of Denman Glacier, East Antarctica, measured with COSMO-SkyMed Radar Interferometry Data. Geophys. Res. Lett. 47 (2020).
Li, T., Dawson, G. J., Chuter, S. J. & Bamber, J. L. Grounding line retreat and tide-modulated ocean channels at Moscow University and Totten Glacier ice shelves, East Antarctica. Cryosphere 17, 1003–1022 (2023).
Wåhlin, A. et al. Pathways and modification of warm water flowing beneath Thwaites Ice Shelf, West Antarctica. . Sci. Adv. 7, eabd7524 (2021).
Mazloff, M. R., Heimbach, P. & Wunsch, C. An Eddy-permitting Southern Ocean state estimate. J. Phys. Oceanogr. 40, 880–899 (2010).
Acknowledgements
This work was performed in the Department of Earth System Science, University of California Irvine, at Caltech’s Jet Propulsion Laboratory, and at the Institut des Géosciences de l’Environnement under a contract with the Modeling, Analysis, and Prediction (MAP) program at the National Aeronautics and Space Administration and the Horizon Europe project OCEAN:ICE.
Author information
Authors and Affiliations
Contributions
R.C and R.M designed the methodology processed the data, analysed the results. E.R designed the methodology and analysed the data. M.S assembled the gravity database. All authors wrote and reviewed the manuscript.
Corresponding author
Ethics declarations
Competing interests
The authors declare no competing interests.
Additional information
Publisher’s note
Springer Nature remains neutral with regard to jurisdictional claims in published maps and institutional affiliations.
Supplementary Information
Rights and permissions
Open Access This article is licensed under a Creative Commons Attribution 4.0 International License, which permits use, sharing, adaptation, distribution and reproduction in any medium or format, as long as you give appropriate credit to the original author(s) and the source, provide a link to the Creative Commons licence, and indicate if changes were made. The images or other third party material in this article are included in the article’s Creative Commons licence, unless indicated otherwise in a credit line to the material. If material is not included in the article’s Creative Commons licence and your intended use is not permitted by statutory regulation or exceeds the permitted use, you will need to obtain permission directly from the copyright holder. To view a copy of this licence, visit http://creativecommons.org/licenses/by/4.0/.
About this article

Cite this article
Charrassin, R., Millan, R., Rignot, E. et al. Bathymetry of the Antarctic continental shelf and ice shelf cavities from circumpolar gravity anomalies and other data. Sci Rep 15, 1214 (2025). https://doi.org/10.1038/s41598-024-81599-1
Received:
Accepted:
Published:
DOI: https://doi.org/10.1038/s41598-024-81599-1
