Emissions Projections for a Trio of Federal Climate Policies
RFF modeling shows that three prominent climate policy proposals, either in isolation or combined, do not reduce emissions enough to meet the Biden administration’s new climate goals.
With the Biden Administration’s recent announcement of the American Jobs Plan and nationally determined contribution (NDC) under the Paris Agreement, and as Congress begins to seriously consider legislation to advance clean energy and cut greenhouse gas emissions, RFF researchers have been investigating environmental outcomes under various policy scenarios. In this issue brief, we provide a snapshot from this work—including estimates of energy-related CO2 emissions and cost-effectiveness.
Policy Scenarios
We compare three prominent proposals being discussed by federal policymakers:
- A simplified version of the recently re-introduced Clean Energy for America Act (CEAA), which provides tax incentives for renewables, energy efficiency, electric vehicles and more
- A Clean Electricity Standard (CES) based on the 2019 Smith-Lujan proposal, which stipulates a schedule for the decarbonization of the electricity sector
- An economy-wide carbon tax starting at $15 per ton and rising at 5 percent real per year (C$15)
We model energy-related US CO2 emissions under each of these policies, various combinations thereof, and business-as-usual (BAU) assumptions. In our “All-in” scenario, we also include federal spending on electric vehicle charging infrastructure and residential building weatherization. Table 1 summarizes the policy scenarios included, with more detail in the appendix. Note: this analysis is calibrated to pre-COVID projections (see appendix), which yields conservative emissions estimates.
Table 1. Policy Scenarios Included in This Analysis
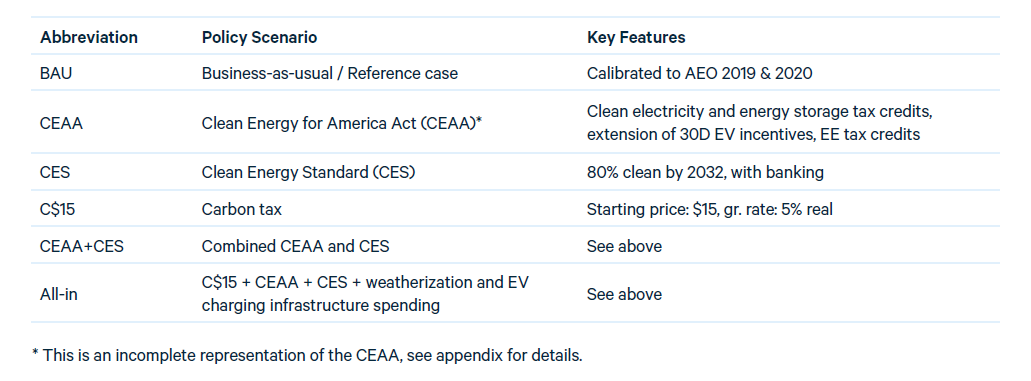
Figure 1. National CO2 Emissions by Policy Scenario

Energy-Related Emissions Estimates Under the Various Policy Scenarios
As shown in Figure 1, all policy scenarios make progress cutting emissions from BAU. Across the policy scenarios studied, estimates of economy-wide energy-related CO2 reductions in 2030 range from roughly 10 to 25 percent from BAU and 30 to 40 percent from 2005 levels.
The CES and $15 carbon tax produce similar emissions trajectories through 2035, with steeper reductions than the CEAA early-on and after 2030. The CEAA and CES combined are an improvement over all individual policies, reducing emissions by approximately 37 percent from 2005 levels in 2030. The All-in scenario, which combines all three policies and federal spending on weatherization and EV charging is estimated to cut 2030 emissions by 41 percent from 2005.
While all scenarios make progress on emissions goals, none hit the NDC target of a 50-52 percent reduction from 2005 levels by 2030, indicating that additional policies and/or greater policy ambition are needed.
Additionally, none of the policy scenarios maintain a reduction path commensurate with what would be needed to reach net-zero by 2050 (as projected linearly from 2020), however a number of scenarios do maintain such a path through 2025 and one (All-in) through 2030. While not shown here, even if a CES were designed to achieve 100% clean by 2035 and combined with all the other policies we study, emissions would still not be on track to hit the midcentury target—policies that substantially cut emissions from sectors other than electricity will be needed as well.
One reason for misalignment with midcentury targets is that almost all policy scenarios hit a plateau around 2030. This is largely because these policies—even when combined—lose effectiveness in the electricity sector over time (discussed below), and the vast majority of emissions reductions come from electricity through 2035.
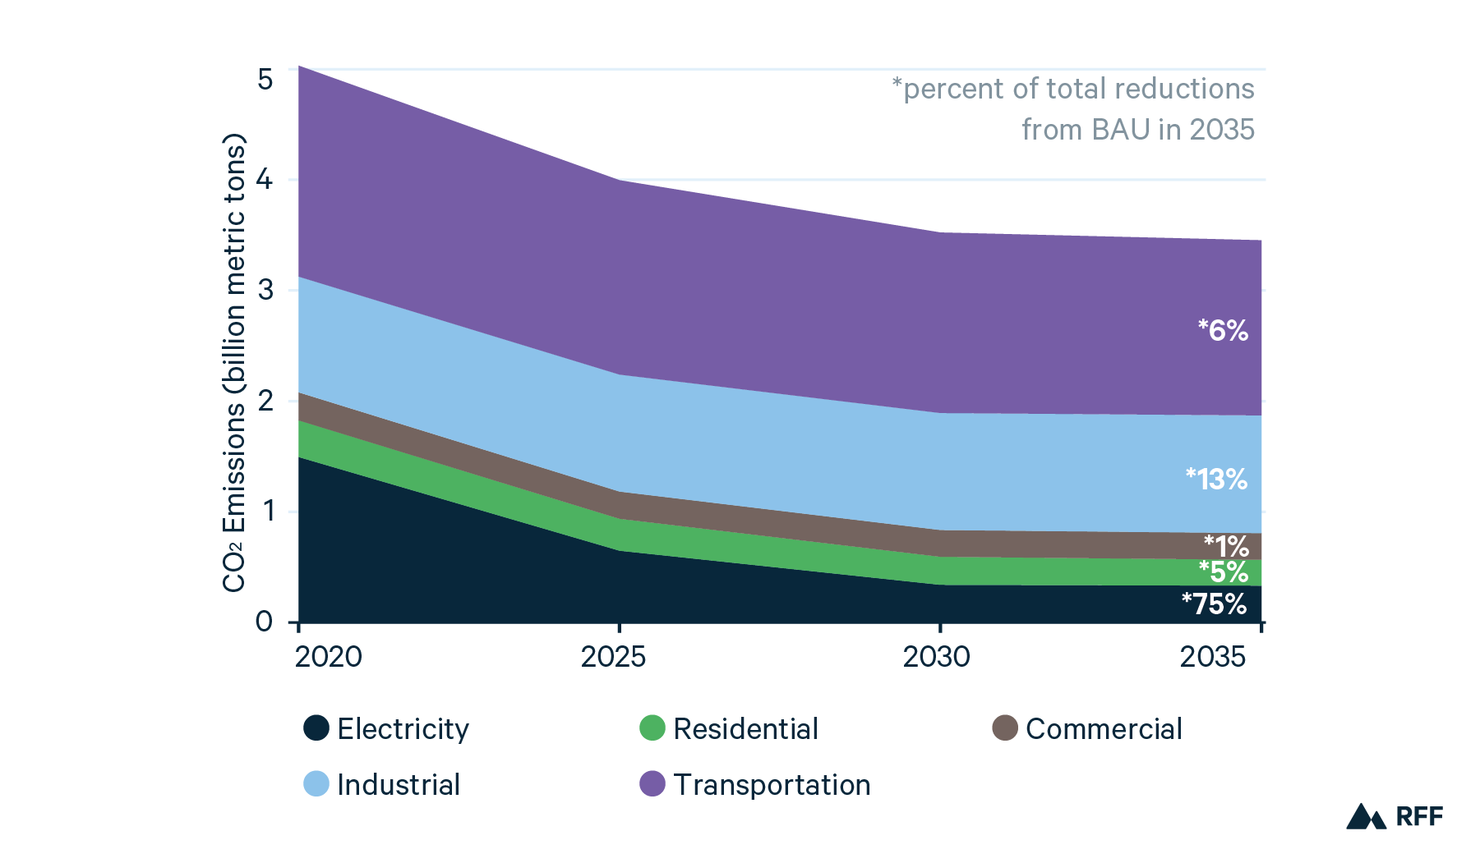
Indeed, as shown in Figure 2, under the All-in scenario, about 75 percent of 2035 reductions from BAU come from electricity. The next greatest portion (13 percent) comes from the industrial sector, driven exclusively by the carbon tax. Reductions in the transportation sector are mostly driven by existing policy, which includes the national fuel economy/GHG standards for passenger vehicles and the Zero Emission Vehicle (ZEV) program, which sets sales targets for electric vehicles in California and 12 other states. New policy, particularly subsidies for electric vehicles, largely shifts costs of meeting the national standards and ZEV requirements from automakers and consumers to taxpayers, without substantially reducing national emissions—the All-in scenario only reduces 2035 emissions 6 percent below BAU (driven entirely by the carbon tax). With electricity emissions declining so much (in this and other scenarios), the major challenge going forward will be to reduce emissions from the transportation and industrial sectors—which, under All-in , represent nearly 80 percent of US energy-related CO2 emissions in 2035.
Figure 2. National CO2 Emissions by Sector (All-in Scenario)
In Figure 3, we take a closer look at the electricity sector. Of the individual policies, the CES reduces emissions most, both in the near- and long-term. And, because the CES and the CEAA together cut electricity emissions so significantly, the addition of the modest $15 carbon tax in the All-in scenario has little to no additional effect on electricity emissions.
None of the policy scenarios studied achieve the Biden goal of net-zero carbon electricity by 2035, but they make solid progress—between a 65 and 85 percent reduction in CO2 emissions by 2035 (from 2005 levels).

As mentioned above, all policies lose effectiveness over time in the electricity sector—indicated by flattening (and in some cases rising) curves after 2025. Why is this? Both the CES and the CEAA promote clean electricity, which primarily replaces coal in the early 2020s, and natural gas in the late 2020s and 2030s. This declining carbon intensity of the replaced electricity partially accounts for the decreasing emissions slopes. Additionally, by the 2030s, most renewables that are cheaper than natural gas (including tax credits) have been built; and the remaining gas in the system is either cheaper than renewables, or necessary for system balancing.
Post-2030, more stringent carbon pricing, richer tax credits, steeper CES requirements, or policies that target natural gas electricity emissions or promote clean firm resources—such as energy storage—would be necessary to achieve the 100% clean goal by 2035.
Cost-Effectiveness of Policy Scenarios in Reducing Electricity Emissions
Considering electricity sector effects only, Figure 4 displays cost-effectiveness of the policy scenarios discussed above, along with two additional scenarios—one which assumes a higher tax credit for clean electricity (6 cents per kWh, or $60 per MWh), and a CES with no credit banking.
We measure cost-effectiveness as the change in total resource cost [1] from BAU (discounted over the 10-year budget window) divided by the cumulative emissions reduction from BAU. A lower number on the vertical axis indicates greater economic efficiency in achieving a given emissions reduction.
Figure 4. Cost-Effectiveness of Policy Scenarios (electricity sector effects only)

Policies that provide incentives to pursue numerous options for emissions reductions tend to be more cost-effective than narrowly targeted approaches. The CES is more cost-effective (and more effective at reducing emissions regardless of cost) than the CEAA because it applies to a broader set of clean generators, including existing nuclear, although it also gives credits to existing renewable resources that may not need further incentives to generate. It also provides some incentive to move from coal to natural gas by providing partial credits to efficient natural gas plants. The carbon tax is more cost-effective than the CEAA because it increases the market price of all emitting generation, whereas the CEAA simply changes the price of renewables constructed in 2022 or later. We also find the CEAA energy efficiency incentives to be inefficient at reducing emissions, but may be necessary to meet electrification and equity goals. When coupled with a carbon tax or CES, the CEAA amplifies emissions reductions and increases the cost per ton of achieving those reductions.
The CES performs comparably to a modest carbon price and, when credits are bankable, cumulative emissions are reduced by an additional 40 percent below BAU while only increasing the average cost by roughly $2 per ton. Enabling banking for any multipolicy scenario involving a CES also leads to greater reductions in emissions and relative costs. To achieve CES (with banking) levels of cost-effectiveness and emissions reductions using tax credits alone would require the CEAA’s PTC to be raised by over 150 percent of its current level to $60/MWh.
Conclusion
The policy scenarios discussed in this brief produce reductions in energy-related CO2 emissions between 10 to 25 percent from BAU—and 30 to 40 percent from 2005—by 2030. None of these scenarios achieve reductions commensurate with the recently announced 2030 NDC, the Biden administration 2035 target for electricity, or midcentury emissions targets identified by IPCC scientists to avoid potentially catastrophic climate change.
One reason for this may be the fact that we calibrate our models to pre-COVID energy and emissions projections (see appendix), which produces conservative estimates in all years of our analysis. Uncertainty remains about the pace and shape of the economic recovery, as well as the extent to which COVID-induced behavior changes (e.g., working from home) will persist even after society restabilizes, and how this may effect emissions in 2030 and 2035.
In any case, greater ambition under this suite of policies is one way to reduce emissions further—for example, by increasing tax credit and/or carbon price levels, or by designing a CES with a more stringent decarbonization path than the one we model here (as current approaches indeed propose).
Another approach would be to broaden the set of policy tools beyond what we study here (which we recognize is a small sample of the climate policy ideas being discussed in Washington). With electricity emissions declining 65-85 percent by 2035 (from 2005 levels) under the scenarios we study, leaders will need to devote attention to other sectors, including the transportation and industrial sectors which together account for 70-80 percent of emissions in 2035 under the scenarios we analyze.
Our research also indicates that policies which incentivize a diversity of decarbonization pathways tend to be more cost-effective than more narrowly targeted approaches.
While the policies we study may not achieve the administration’s emissions goals, they represent a significant down payment on those goals, and they show that—with additional policy and refinements to existing approaches—these goals are within reach.
[1] Resource costs are the sum of electricity sector fuel costs, variable operations and maintenance costs, fixed operations and maintenance costs, and annualized capital costs.


