Yves here. Yours truly is hardly Uber-adjacent or even out and about much, yet I’ve overheard complaints about how Uber has jacked up prices to the degree that the customers feel burned. Impossible to judge how many will go back to cabs or old radio-car services, but the pricing uncertainty, higher average prices, and exposure to sticker shock is registering.
By Hubert Horan, who has 40 years of experience in the management and regulation of transportation companies (primarily airlines). Horan has no financial links with any urban car service industry competitors, investors or regulators, or any firms that work on behalf of industry participants
Uber and Lyft published their fourth quarter and full year 2021 financial results this week.
Uber overstated the 2021 profitability of its ongoing business operations by $3.2 billion and has now lost over $31 billion operating car and delivery services.
Uber announced a 2021 GAAP loss of $496 million but this was inflated by $3.2 billion in unrealized gains on largely non-tradeable securities it obtained in return for abandoning failed operations. This included $6.2 billion in unrealized gains from securities issued by Aurora (which acquired Uber’s failed autonomous vehicle development group), Yandex (Uber’s failed Russian ridesharing operations) Grab (its failed Southeast Asian rideshare operations) and Zomato (failed Uber Eats India), offset by $3.0 billion in unrealized Didi losses (failed Uber China). Uber claimed that its Grab securities appreciated $1.6 billion in the fourth quarter even though Grab’s stock declined 50% during that period. [1] If these unrealized gains unrelated to ongoing operations are excluded, Uber’ 2021 GAAP loss was $3.7 billion (not $0.5 billion), and its profit margin was negative 38% (not negative 3%).
This series has been pointing out Uber’s willful efforts to mislead investors about the financial performance of its ongoing business activities for years, including its claim that profits had risen $5 billion immediately prior to its IPO. [2] The table below compares Uber’s published GAAP profit numbers with the legitimate results from ongoing operations. Cumulative losses from Uber’s ongoing operation since 2014 now exceed $31 billion, while Uber’s published numbers were inflated by $8.7 billion in unrealized gains in the securities of unrelated businesses. [3]
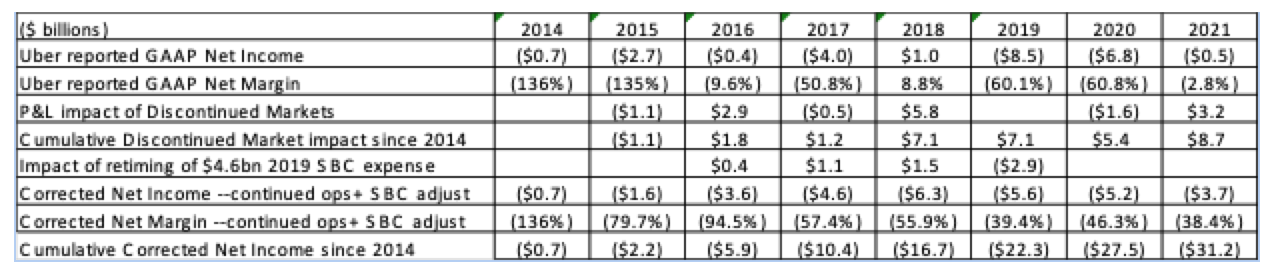
Uber also continued its ongoing efforts to mislead reports and investors by emphasizing its “EBITDA Profitability” metric, which is not a measure of either profitability or EBITDA. An honest EBITDA measure would deduct interest, taxes, depreciation and amortization, which account for 6% of Uber’s total expenses. Such a measure would provide no new useful information for investors since it would closely track more widely understood measures such as GAAP Net Income and Operating Profitability. Uber’s bogus EBITDA measure deducts additional expenses ($6.6 billion in the last three years) that can vary widely from year to year that can account for as much of 20% of total expense. And its “Segment Adjusted EBITDA Profitability” which purports to measure the separate profitability of ridesharing and food delivery, is even worse, since it deducts another $500 million per year of core expenses, including Uber’s IT costs. [4] A 189 slide deck that Uber management presented at its February 10thInvestor Day made aggressive promises about improved EBITDA profitability, but never mentioned when it might achieve honest GAAP profitability. [5]
Uber’s operations burned $445 million in 2021, but new term loans raised enough money to increase its end of year cash position by $400 million, to $7.8 billion.
Lyft loses another billion dollars and remains cash negative
Lyft’s published GAAP net loss in 2021 was just over $1 billion on $3.2 billion in revenue, a negative 31% profit margin. Its cumulative losses over the five years when it has published financial reports now total $7.6 billion. This included gains from selling its failed autonomous vehicle operations to Toyota, which will total over a half billion dollars over the next few years but (as with Uber’s divestures of its failed operations) have nothing to do with the market performance of its ongoing business. As seen in the table below, adjusting for this increases Lyft’s 2021 loss by $120 million, so this is a smaller problem than Uber’s $3.2 billion profit overstatement.
Lyft’s operations remain cash negative, burning $100 million in 2021. This was almost identical to its operating cash burn in 2019 but a huge improvement over the $1.3 billion burned in 2020. Lyft has burned through 55% of the cash it had at the end of 2018 and would have burned through 65% but for its ability to convert some of its failed AV assets into cash.
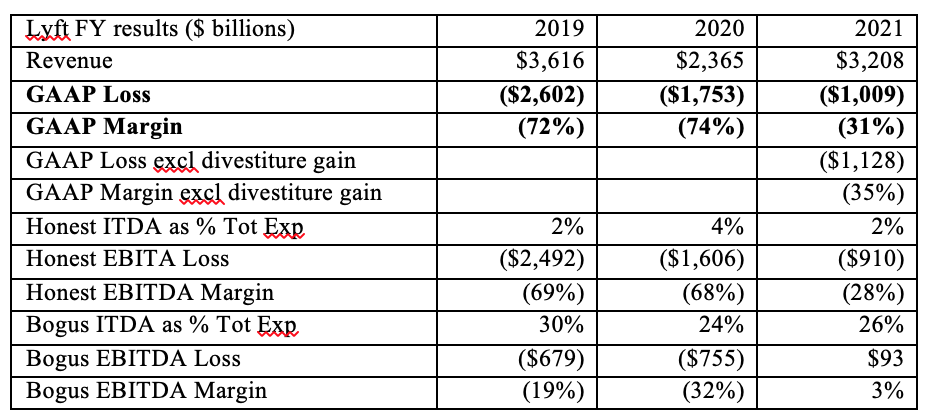
Like Uber, Lyft emphasizes a similarly bogus EBITDA metric designed to allow it to claim better profit performance than legitimate accounting measures would show. Lyft claims it was “profitable” in 2021 on the basis of this metric, which excludes 25-30% of total expense, when an honest EBITDA measure would only exclude 2-4%.
Uber/Lyft financial reporting is designed to mislead and confuse investors and reporters about its actual economic performance
Investors look to financial reports for help in understanding how profitability and cash flow performance has changed, how key factors that could affect future profitability (demand growth/weakness, pricing shifts, cost efficiency changes, etc.) have changed, and which components of the overall business are improving or weakening. By including unrealized gains from securities received in exchange for failed operations, and focusing on its bogus and inconsistent EBITDA metrics, both companies present “profit” pictures that can fluctuate wildly, making it much more difficult for investors and reporters to tell how much progress its ongoing operations are making towards honest profitability over time.
Uber and Lyft provide almost no useful operations or revenue data. This means investors have no way of knowing whether revenue changes are driven by demand growth or pricing power, or whether cost savings are due to lower demand or improved efficiency or from forcing drivers to accept lower compensation. Lyft is essentially a one-business/one-market company (ridesharing in North America) but Uber refuses to break down trip volumes or unit revenues between ridesharing and delivery, or by geography. Thus, investors have no way to understand how their two separate businesses and many international markets are contributing to (or detracting from} profit performance.
This allows Uber and Lyft to better control the public narrative about their performance, by ensuring that reporters cannot explain specific results in terms of the broader profitability questions readers might be interested in. Thus, news reports this week emphasized the large absolute year-over-year growth in revenue but did not explain this was relative to the worst of the pandemic demand collapse, or how much was due to volume recovery versus higher prices. They also emphasized that Uber’s delivery business was growing much faster than ridesharing, and Uber’s claim that its delivery business had achieved “breakeven.” But they did not explain how far removed Uber’s breakeven metric was from actual profitability or explain how the faster growth of a much lower margin business was affecting Uber’s ability to eventually achieve honest GAAP profitability.
Most stories mentioned that “outside investments” such as Grab impacted P&L gains, but never explained the magnitude of these impact, and never explained that these were not “investments” made for their profit potential, but were obtained in return for the assets salvaged from failed businesses. Stories prominently highlighted both companies’ bogus EBITDA profitability metric, claiming it “signal[s] that its operations are moving toward future profitability” even though most reporters did not understand that it was very different from honest EBITDA measures, and could not explain why this metric provided better evidence about the path to future profitability than GAAP Net Income or Operating Income. [6]
Both company’s published results hid evidence of the major changes in ridesharing economics that have occurred since the pandemic
The addendum at the conclusion of this article, based the analysis using data collected by the city of Chicago, presents some of the critical data about the ridesharing market that is completely missing from these financial reports and press articles.
The meteoric growth of ridesharing in Chicago prior to the pandemic was driven by fares 45% lower than what traditional taxis offered, and by enormous capacity growth, over 400% in terms of trips and probably 700% in terms of trip-miles. The ridesharing companies were not seeking to merely supplant traditional taxis, but to totally dominate a dramatically expanded car service market. The ridesharing companies captured 85% of the total market by the end of 2019, and much of their growth was at the expense of transit ridership. As previous posts in this series have discussed, much of the added rideshare capacity served the most unprofitable parts of the car service market that traditional taxis carefully avoided—peak demand periods (such as Friday and Saturday night) and lower density neighborhoods where empty backhauls were much more likely. But Uber and Lyft were laser focused on maximizing top-line revenue growth which they believed (plausibly) was the most effective way to maximize their equity value.
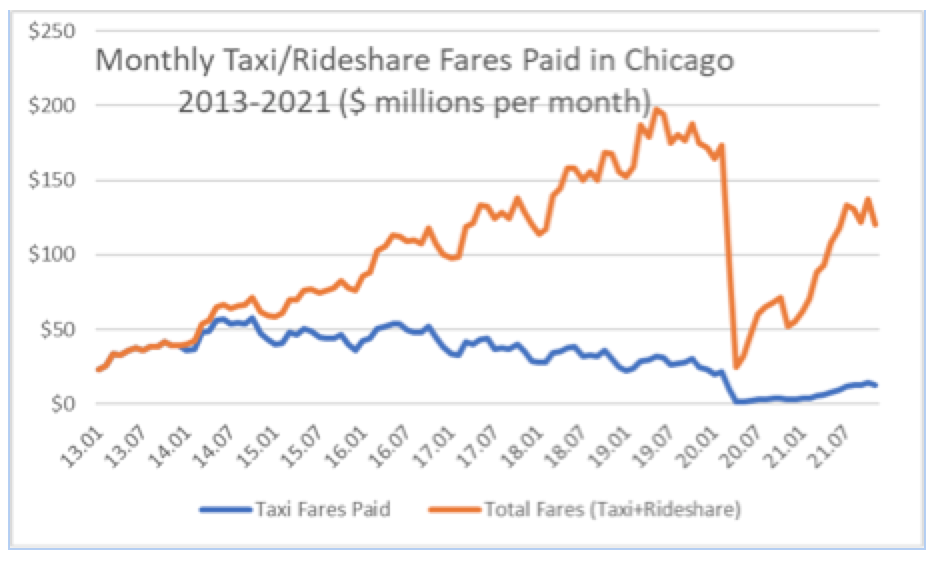
Uber and Lyft obviously bear none of the blame for the massive post-pandemic market collapse. 2Q2020 total market revenue was only 20% of the 4Q2019 level, and traditional taxi revenue almost completely vanished. But this rendered the longstanding hypergrowth strategy that was the heart of the narrative these companies had been selling to the capital markets completely obsolete. Two years later any hopes that the demand for cars to take people to concerts and restaurants would magically return to 2019 levels have been completely dashed. In this week’s earnings announcements both companies said they expected 2022 revenue growth to fall below even the modest growth that stock analysts had been predicting.
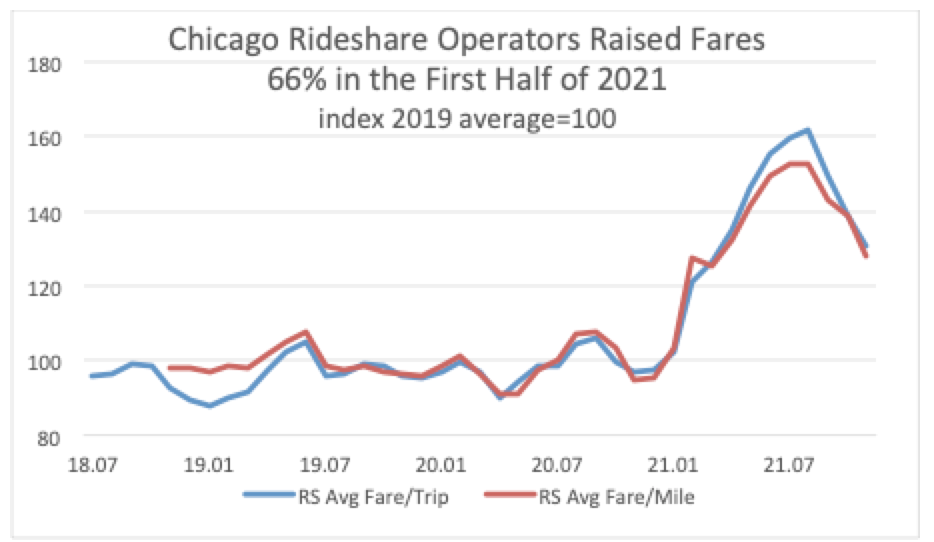
The rideshare companies floundered in 2020, but in early 2021 began aggressively raising prices to levels totally inconsistent with the discounting that had originally made ridesharing popular. The average fare per rideshare trip in Chicago was $26.96 in July 2021, 66% higher than the same rideshare trip in July 2019, and 72% higher than the comparable taxi trip in July 2013, before the rideshare companies dominated the market. This Chicago data is consistent with multiple press reports about dramatically higher 2021 rideshare fares [7]. Some of this may be explained by the low initial resistance to inflationary price hikes seen in many consumer businesses, and by the likelihood that the lower level of 2021 rideshare demand may have been dominated by higher income customers. But the data suggests consumer resistance has set in, as these steady fare increases could not be sustained beyond August.
Neither company’s financial releases included the operating and revenue data needed for investors to see that these dramatic changes in the ridesharing market had occurred, much less to help them understand how they affected bottom-line P&L results. Uber has obviously improved from the worst days of the 2020 collapse, but since they don’t show separate volume or unit revenue data for ridesharing and food delivery, these important changes are masked. Since Uber also doesn’t provide meaningful profit breakdowns for the different regions it serves, it is also impossible for investors to evaluate their vulnerability to increased regulatory requirements outside the US [8] or to countries where Covid restrictions may limit demand recovery more.
In the second half of 2021 Lyft ridership was up 50% versus dismal 2020 levels but still 15-20% below 2019 levels and its published ridership numbers have been flat for the last nine months. Lyft increased full year revenue 35% versus 2020 while pandemic driven cost cuts held the full year expense increase to only 2%. But these efficiency gains collapsed in the fourth quarter, when revenue increased 11% versus the third quarter, but expenses increased 31%. Lyft’s earnings release said nothing about its future ability to keep expenses from growing faster than revenue.
While Lyft’s “average revenue per active rider” metric was up 14%, it said trip lengths had increased, so true unit revenue performance may not have improved at all. Nothing can be firmly concluded here but this suggests that Lyft may have been less willing to raise fares than Uber since their future growth narrative is totally dependent on rideshare.
The other major driver of ridesharing profitability is how little out of each customer fare dollar Uber and Lyft give to drivers, and again, their financial releases are designed to make it as difficult as possible for investors to understand how driver compensation (or utilization) shifts affect current results. There is ample anecdotal evidence that driver frustration with low pay and perceptions that they are not getting a fair share of what passengers are paying will reduce supply, and the incentives needed to restore supply will quickly reduce Uber/Lyft revenue.
Lyft has never published gross passenger payment data, and by combining ride and delivery volumes one cannot reliably determine how Uber unit revenues have changed. The interrelationship between fares, trip volumes and driver compensation is critical to ridesharing profitability, but these companies do not want outsiders to be able to understand these dynamics.
Uber’s strategy for reducing its food delivery losses is based on massively reducing competition
As this series has discussed at length, while no one has any plausible plan for achieving sustainable ridesharing profitability, the economics of the fiercely competitive food delivery business are substantially worse. In eight years DoorDash, the dominant US company, never made a profit. The CEO of Grub Hub, the number two company, said food delivery “is and always will be a crummy business.”
Even by Uber’s crude “Segment Adjusted EBITDA profitability” metric delivery services were 63 margin points worse than ridesharing in 4Q2019 and were still 25 margin points worse in 4Q2021. Uber’s new emphasis on using food delivery to inflate trip volumes and total revenue recognized that throughout its history capital markets had myopically focused on the rapid growth of these top-line numbers while totally ignoring the question of whether that growth would ever produce sustainable profits.
Uber’s food delivery strategy depends entirely on driving the industry consolidation that might allow it to exert much greater anti-competitive market power over drivers and restaurants. It attempted to acquire Grubhub (a rollup of 12 previously independent competitors), which would have allowed the merged company to leapfrog over Doordash with a 58% market share. When that failed, it spent $2.6 billion to acquire Postmates, giving Uber Eats a slightly stronger (32%) third place market share. It also acquired Drizly and GoPuff, in the hopes of achieving the type of powerful position in liquor and convenience store deliveries that it has been unable to achieve in food or grocery deliveries. [9]
There is absolutely no evidence showing that extreme industry concentration could be achieved, or that it might make these hugely unprofitable companies viable. Certainly no one has laid out a path that might allow Uber Eats or the other delivery companies to achieve profitability without significantly reducing competition. Despite Uber Eats’ unprofitability and limited market share, the FTC has opened a new review of the Drizly/GoPuff acquisition, recognizing that their only plausible basis was the elimination of competition and the hope of being able to squeeze drivers and suppliers. [10] Unlike ridesharing where the drivers and traditional taxi companies harmed by Uber and Lyft’s pursuit of dominance and market power have no meaningful political voice, the restaurants that have been crippled by the delivery fees charged by the big venture capital funded companies have found sympathetic local governments officials willing to consider delivery fee caps and other actions to protect competition.
The existence and survival of Uber (and to a lesser extent Lyft) has always depended on their ability to create and promulgate public narratives about their virtues. As a result, this week’s financial released carefully avoided mentioning things that helped improve P&L results but don’t fit the desired narrative. Companies usually brag about the ability to raise prices 66% within six months but that would undermine the idea that ridesharing’s popularity and long-term growth potential was based on tangible consumer benefits. Companies usually brag about the ability to improve margins by squeezing workers and suppliers and buying up competitors, but this would draw attention to the fact that profitability has been elusive for 12 years, and profits depended on exploiting everyone else. The business press remains central to this narrative management. Not a single press story made any attempt to explain whether this weeks’ P&L improvements had anything to do with higher fares, lower driver and restaurant compensation or reduced competition. Not a single press story raised the questions about whether these companies’ growth narratives still made any sense, or whether Wall Street expections that they can quickly return to rapid growth rates are plausible given the pandemic’s unpredictable path and the major changes in ridesharing markets that have occurred as a result of the pandemic.
ADDENDUM—Highly detailed marketplace data from Chicago confirms several of this series’ major findings
This series’ analysis of the economics of Uber and Lyft has been largely based on data from their quarterly financial releases, and has relied on data on traditional taxi economics given the absence of data on rideshare operations, unit costs and unit revenues. The city of Chicago has established publicly accessible databases that provide urban planners who want to better understand car services in Chicago with a wealth of hard data. They include trip level origin/destination, time, mileage and fare data for taxis going back to 2013 and rideshare services since November 2018. [A1] The ridesharing companies had fought the requirement to produce this data for the same reason they have refused to provide investors with basic operating and revenue data.
The Chicago data is fully consistent with the major findings I have presented over the past five years and provides objective marketplace data that allows those findings to be quantified more precisely. I extrapolated backwards from the very detailed post 2018 Uber/Lyft data, using high-level data from financial reports, so that aggregate rideshare trips and revenue in Chicago can be reasonably estimated going back to 2016.
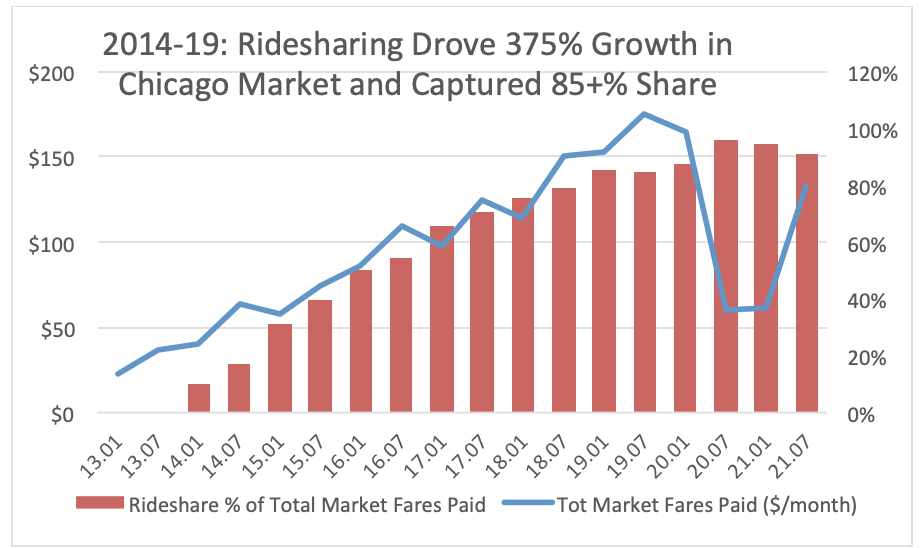
Uber and Lyft were not merely trying to supplant traditional taxi operators, but to dominate a vastly expended market. Uber and Lyft were laser focused on extraordinarily rapid top-line revenue growth, which they believed was the primary driver of equity value growth. Consumer expenditures on urban car services in Chicago (taxi plus rideshare) increased by 375% between 2014 and 2019, with the ridesharing companies capturing 85% of the overall market prior to the pandemic. Taxi revenues began declining in 2014 but did not collapse until the pandemic.
Two thirds of rideshare growth in Chicago between 2016 and 2019 was share shift away from existing providers. Media coverage has focused exclusively on business captured from traditional taxis but this only explains 17% of rideshare growth. Another 45-50% of the growth in rideshare trips tracks with declines in Chicago Transit Authority ridership. This was during a period when Chicago economic and demographic trends should have driven increased transit and taxi usage. The balance would appear to be increased intra-Chicago travel stimulated by very low rideshare fares and the increased capacity offered. This data is consistent with claims made in many cities that Uber and Lyft had significantly increased street traffic congestion and pollution. [A2] It also highlights the fact that estimates of the economic cost of ridesharing cannot narrowly focus on Uber and Lyft’s multi-billion-dollar losses but must also include the huge revenue losses imposed on local transit operators, and (by extension) local taxpayers.
The two primary drivers of ridesharing’s meteoric growth were massive fare discounting and a massive increase in the capacity offered. The Chicago data allow us to objectively quantify just how aggressively Uber and Lyft pursued growth and just how aggressively they cut prices and expanded capacity in pursuit of that growth.
In the 15 months prior to the pandemic, rideshare fares per mile were 45% lower than taxi fares. Press reports about low Uber/Lyft fares had quoted fares per trip, which understate the true price comparison because rideshare trips were on average 50% longer than taxi trips. The graph below shows the true magnitude of rideshare price per mile discounting after November 2018 (when the full Chicago database fully incorporated ridesharing) compared to the smaller (but still significant) 15% price per trip difference going several years further back. The collapse of taxi operations after the pandemic hit renders recent price comparisons meaningless.
Trip volumes grew by over 500% by 2019 and trip-mile growth probably exceeded 700%. [A3] Discounting explains the discrepancy with the 375% growth in market revenue. Much of this added capacity was added outside the central business and commercial districts that traditional taxis had focused on. Databases with origin and destination data for each trip allow one to analyze changes in geographic service levels, but these are difficult to summarize with simple graphs. But Todd Schneider prepared a detailed set of maps that powerfully demonstrate the major changes that occurred in New York after ridesharing became dominant. Traditional taxi service had been concentrated at the airports and the wealthiest portions of Manhattan, but Uber and Lyft aggressively served Brooklyn, Queens and northern Manhattan. [A4]
This series has also argued that many of the specific tactics Uber and Lyft used to fuel growth had substantially worse economics than the capacity traditional taxis operated. In addition to making sure basic fares were high enough to cover their actual costs and defending entry limits that ensured a rough balance between overall market supply and demand, the viability of traditional taxi operators depended on maximizing the revenue productivity of drivers and vehicles by limiting geographic coverage. They focused on relatively shorter trips (where the much higher rate for the initial mile had a greater impact) and on the districts with the highest demand (allowing drivers to maximize revenue utilization because they could quickly find their next fare).
They also maximized the service available during peak demand periods which can be five times more expensive to serve than midday demand. As the 2019 Chicago data below indicates, 10% of an entire week’s demand occurs on Friday and Saturday night; vehicles and drivers serving this demand have zero revenue potential the rest of the week. Similarly, vehicles and drivers serving the 2-hour evening peak Monday thru Thursday have no revenue potential the rest of the day.
Over five years ago this series first pointed out that the high cost of serving demand peaks and lower demand neighborhoods was the main reason traditional taxis were marginal businesses, but the Uber business model had not only failed to solve the problems but was actually less efficient and higher cost. [A5] The Chicago data allows us to measure how much longer and geographically dispersed rideshare trips are, and to demonstrate that Uber and Lyft have done nothing to address the extreme peaking of car service demand. Everything Uber and Lyft did to produce the meteoric top-line revenue growth its owners wanted made its operating efficiency much worse. All of the things that made Uber and Lyft extremely popular (extremely low prices, plenty of capacity on Friday and Saturday night, better service to neighborhoods with lower demand) made it hopelessly uneconomic.
Chicago rideshare operators raised fares 66% in the first half of 2021 and are no longer offering consumers what they had promised them before the pandemic
This series has focused on the evidence showing that even under ideal pre-pandemic, non-recessionary conditions, the Uber and Lyft business models are incapable of producing sustainable profits. The historical Chicago data confirms that Uber and Lyft were totally focused on maximizing top-line growth numbers. All of the pre-pandemic data shows that total rideshare revenue growth was almost entirely driven by volume growth. Growth in gross passenger payments per month moved in lockstep with the number of trips per month. The rideshare companies had established the low fares they thought would stimulate growth, and aside from small monthly fluctuations these overall levels were basically flat. But as the graphs presented earlier demonstrated, starting in January 2021 the ridesharing companies aggressively increased fares to levels far above their pre-pandemic levels and even further above the levels traditional taxis had offered before Uber entered the market.
The public narrative about ridesharing is that it used innovative technology and powerful network economies to offer consumers much higher service coverage at much lower fares, and that its high corporate valuation was justified by its unicorn-like growth rate and its potential for many more years of robust growth. None of this narrative was ever true, and this marketplace data helps demonstrate that it no longer offers consumers the things that made it popular and has little potential for future growth. But despite this data and $31 billion in losses over twelve years (Uber) and $7.6 billion in losses in the last five years (Lyft) have stopped the business press from continuing to endorse the old narratives. And both companies carefully avoid releasing the operating and revenue data that would make it easier for investors and reporters to question the validity of those narratives.
________
[1] Grab stock prices ($10.31 on Oct 1, $7.13 on Dec 30) as listed on Google Finance. Grab’s NASDAQ listed SPAC went public on December 2ndand declined 40% in value thru Feb 8. It is possible that Uber was comparing the Dec 30thvalue with a hypothetical value from further in the past, but if so, it would be highly improper to assert (as Uber has) that this appreciation should be seen as profit earned during the fourth quarter of 2021. Even if buried in footnotes, one would think that Uber would have provided investors with careful explanation of items with multi-billion-dollar P&L impacts.
[2] Ironically the $5 billion 2018 overstatement was due to the claimed appreciation of the Didi stock which is now virtually worthless. See Can Uber Ever Deliver? Part Thirteen: Even After 4Q Cost Cuts, Uber Lost $4.5 Billion in 2017, 16 February 2018, Part Nineteen: Uber’s IPO Prospectus Overstates Its 2018 Profit Improvement by $5 Billion, April 15, 2019 and Part Twenty-Two: Profits and Cash Flow Keep Deteriorating as Uber’s GAAP Losses Hit $8.5 Billion, February 7, 2020. Uber received Didi stock when it shut down its failed China operations in August 2016. Issues related to Didi’s previously inflated and now depressed corporate value were discussed in Part Twenty-Five: Didi’s IPO Illustrates Why Uber’s Business Model Was Always Hopeless, 2 August 2021.
[3] 2014 was Uber’s fifth year of operations; 2021 was year 12. The table also adjusts pre-2019 results to spread $5 billion in stock based compensation (SBC) expense that was entirely assigned to 3rdquarter 2019 results to the four previous years when those obligations were incurred. This was a GAAP requirement that Uber could not have avoided, and has no impact on the cumulative profit numbers. This issue was explained and documented in the previous posts cited in note 2. Uber has never officially published P&L data for years prior to 2016. The sources for the 2014 and 2015 number can be found in Parts One and Six of this series. Results prior to 2014 would be immaterial given Uber’s very limited operating volumes.
[4] This series has discussed Uber’s use of “Adjusted EBITDA” to mislead reporters and investors on multiple occasions including Can Uber Ever Deliver? Part Nineteen: Uber’s IPO Prospectus Overstates Its 2018 Profit Improvement by $5 Billion” April 15, 2019 and Part Twenty-Six: With No Hope of Real Profits, Uber and Lyft Double Down on Fake Profit Metrics, 9 August 2021.
[5]Presentation available at https://investor.uber.com/files/doc_presentations/2022/Uber-Investors-Day-2022-Presentation.pdfAlso see Jackie Davalos, Uber’s Ambitious Outlook for 2024 Leaves Market Skeptical, Bloomberg, Feb 10, 2022
[6] Maria Armental, Lyft’s Revenue Jumps 70% as Higher Fares Offset Fewer Riders, Wall Street Journal, Feb 8, 2022, Preetika Rana, Uber Fourth-Quarter Revenue Jumps as Customers Go Out, Keep Ordering In, Wall Street Journal, Feb 9th 2022, Alex Wilhelm, Uber wrapped 2021 with strong revenue growth and greater adjusted profitability, TechCrunch, Feb 9, 2022
[7]Kate Conger, Prepare to Pay More for Uber and Lyft Rides, New York Times, May 30, 2021, Winnie Hu, Patrick McGeehan and Sean Piccoli, You Can’t Find a Cab. Uber Prices Are Soaring. Here’s Why, New York Times, June 15, 2021, Whizy Kim, Let’s Talk About The Real Reason Ubers Are So Expensive Now, Refinery29.com, July 7, 2021, Preetika Rana, Uber, Lyft Prices at Records Even as Drivers Return, Wall Street Journal, Aug. 7, 2021, Bobby Allyn, Lyft And Uber Prices Are High. Wait Times Are Long And Drivers Are Scarce, NPR, 7 August 2021, Laura Forman, At Uber and Lyft, Ride-Price Inflation Is Here to Stay, Wall Journal, 4 October 2021, Kim Mackrael, Uber and Lyft Thought Prices Would Normalize by Now. Here’s Why They Are Still High., Wall Street Journal, 30 October 2021; Tom Dotan, Uber and Lyft prices are staying stubbornly high, despite drivers returning to the ride-hailing platforms, Business Insider November 11, 2011, Levi Sumagaysay, With Uber and Lyft prices rising, passengers return to the original ride-hailing service: taxicabs, November 27, 2021. Data in these reports came from firms that process corporate expense claims but do not include fares that were not expensed. The Dotan and Sumagaysay stories cited Chicago fare increases of 40% (August vs January) and 37% (year-over year October).
[8] Madhumita Murgia, Delphine Strauss, Javier Espinoza and Sam Fleming, Uber grapples with multiple challenges to business model in Europe, Financial Times, 7 December 2021 Lee Fang, Uber CEO Admits Company Can Afford Labor Protections for Drivers, The Intercept, January 7th, 2022
[9] Edward Ongweso Jr, Uber’s New Strategy: Buy Unprofitable Companies, ???, Profit, Vice, June 30, 2020, Mike Isaac and Erin Griffith, Uber to Buy Postmates for $2.65 Billion, New York Times, July 5, 2020, Heather Haddon, DoorDash and Uber Eats Are Hot. They’re Still Not Making Money, Wall Street Journal, May 28, 2021, Maureen Tkacik, Restaurants are barely surviving. Delivery apps will kill them, Washington Post, May 29, 2020, Helen Rosner, The Fight to Rein in Delivery Apps, New Yorker, 5 October 2021
[10] Josh Sisco, Uber and Its Delivery Rivals Reveal Closely Guarded Data to Antitrust Investigators, The Information, February 7, 2022
[A1] The database for taxis can be accessed at https://data.cityofchicago.org/Transportation/Taxi-Trips/wrvz-psewand for ridesharing at https://data.cityofchicago.org/Transportation/Transportation-Network-Providers-Trips/m6dm-c72p.
[A2] Among many other examples see Flegenheimer, Matt & Fitzsimmons, Emma, City Hall and Uber Clash in Struggle Over New York Streets, New York Times, 16 Jul 2015, Izabella Kaminska, Ride-hailing apps are creating an inefficient and unfair transit system, Financial Times, October 4, 2016, Faiz Siddiqui, A new study says services like UberPool are making traffic worse, Washington Post, July 25, 2018, Bruce Schaller, Time for a cap on Uber and Lyft: Why a traffic expert changed his mind, New York Daily News, Jul 30, 2018, Carolyn Said, Uber, Lyft cars clog SF streets, study says, San Francisco Chronicle, Oct 16, 2018, Andrew J. Hawkins, Uber and Lyft are the ‘biggest contributors’ to San Francisco’s traffic congestion, study says, The Verge, May 8, 2019, Eliot Brown, The Ride-Hail Utopia That Got Stuck in Traffic: Uber and Lyft said they would ease congestion. Instead, they made it worse. Wall Street Journal, Feb 15, 2020
[A3] Trip counts in Seattle grew by 450% between 2014 and 2018, in line with the Chicago volume growth, but Uber and Lyft successfully blocked local governments from collecting the revenue data needed to show how much consumer demand had increased. Craig A. Leisy, Transportation Network Companies and Taxis: The Case of Seattle, Routledge Books 2019.
[A4] Todd W. Schneider, Analyzing 1.1 Billion NYC Taxi and Uber Trips, with a Vengeance, November 2015 updated March 2018. This and similar analysis using the Chicago data can be found at his website, https://toddwschneider.com/archives/. Schneider was kind enough to assist with the data pulls I used to produce the graphs in this section. His piece Reverse Engineering Uber and Lyft Surge Pricing in Chicago, March 25, 2020 touches on geographical issues in Chicago, and illustrates how these databases can be used to evaluate local service issues but does not directly address the impact of ridesharing on service levels in previously underserved neighborhoods.
[A5] Can Uber Ever Deliver? Part Three: Understanding False Claims About Uber’s Innovation and Competitive Advantages, December 2, 2016


Another excellent piece, and well tied to the recent post and commentary on the importance of narratives in the price of equities. It’s quite clear that the management of Rideshare companies know the importance of narratives and do their best to present the ever present growth and disruption story to traders.
What I fail to understand is how can these businesses continue at such staggering levels of annual losses? I would suppose at some point that the institutions providing the cash to keep them investing and operating would look at these numbers much differently than the average investor stop buying their bonds or investing in them. The idea that Uber has burned $31 billion yet has nearly $8 billion in cash on hand is remarkable to me.
As for local on the ground observations, I have found that Lyft and Uber are back in my neck of the woods in suburban Boston. My area has never been highly served by the ride services, but for much of the pandemic it was only possible to find the service closer to urban cores, and even then it would be a struggle. But this week I needed work on my car that only the dealer could reliably provide. That’s always a pain for me as the nearest dealer is about a 30 minute drive away for me. The dealer now partners with Lyft to make sure you’ll seek out their services. When I checked the app for what the ride they paid for would cost me, I saw it was about $30. That is entirely reasonable to me, doesn’t feel like gouging at all.
For almost anything more involved than changing a wiper blade, I take my car to the dealership, 30 miles away over rural roads. If they need it for a while (even 1/2 a day), they’ll give me a loaner car. I pay only for gas I use. You need to find a better dealership!
I’ve seen Yandex delivery robots on the University of Arizona campus.
I think they’re being used for food delivery, and let me tell you, when I see one, I steer clear of them. Why? Because I simply don’t trust them not to run into me.
Suffice it to say that I don’t want to become another Elaine Herzberg. Context:
https://en.wikipedia.org/wiki/Death_of_Elaine_Herzberg
It’s Arizona, Slim. If a robot delivery ever runs into you, you are liable for the cost of the robot and the replacement meal that needs to be sent because you made the original one cold while it was running you over. When our governor sells out to the “self-driving lobby” he goes all the way.
> If these unrealized gains unrelated to ongoing operations are excluded, Uber’ 2021 GAAP loss was $3.7 billion (not $0.5 billion), and its profit margin was negative 38% (not negative 3%).
There has been an improvement and Uber should be profitable by 2060.
They used to sink one Nimitz unit per year, now it’s a mere 4/5ths of a Nimitz.
You know what they say: “A billion here a billion there and pretty soon we’re talking real money”.