Like millions of Americans, Alex Smith watched protesters take to the streets after the brutal killing of George Floyd, a Black man, while in Minneapolis police custody. As he skimmed social media in search of information, a Twitter thread caught his eye.
A BuzzFeed journalist tweeted that protests against police brutality reached beyond major hubs like Chicago and New York City into America’s smallest towns and rural areas. Smith, a data analyst from Tucson, Arizona, was stunned.
“I remember thinking, `Wow, this movement is much greater than I realised. Something big is going on.’ I wanted to create a document as fast as I could to capture the magnitude,” said Smith, who fell in love with maps as a child. He set out to find every city and town where Black Lives Matter (BLM) or George Floyd-related protests had taken place since the May 25 tragedy.
He scraped the first 450 protest locations from maps created by NBC News, Al-Jazeera and other media outlets. The first individual point he added was Pelham, New York, population 12,470, found on a Twitter thread. He turned to Google searches, Wikipedia, and Reddit to track locations. Once the map got traction, he started getting tips via email.
By July 26, Smith’s map contained 4,352 communities worldwide where protests, marches, vigils, and demonstrations had taken place, some in far-flung places like Karachi, Pakistan; Abuja, Nigeria, and Binnish, a city in war-torn Syria. Moscow, Hong Kong and Beirut were in the mix.

Alex Smith is a geographic information system analyst in Tucson, Arizona. His goal is to map every city or town that held a George Floyd/Black Lives Matter protest, action, or vigil using Esri's ArcGIS Online software.
Smith provided a visual portrait of the outcry for racial justice spreading to white, small-town America and into the politically conservative strongholds of Mississippi, Oklahoma and Wyoming. Protesters carried “Black Lives Matter” signs in Pulaski, Tennessee, population 7,652, known as the birthplace of the Ku Klux Klan.
“Seeing the flood of dots on the map is a powerful image. It counters those who say that protests are limited to blue/Democrat urban areas, or that they are driven by Antifa and somehow dangerous or suspect,” said the former lawyer turned technology whiz. “There are people everywhere supporting Black Lives Matter, and it’s astonishing and inspiring to map.”
Verification comes through links to news articles, mentions on social media, and Twitter posts tracked by loyal volunteers.
On July 11, citing Smith as a source, the Washington Post reported that changes in small communities were fueling a racial justice movement across the Midwest. The New York Times and USA Today have used his research; stories about the project have appeared in the Bloomberg Newsletter and on National Public Radio’s Here & Now. Smith has a master’s degree in geographical information systems and technology.
In late July, he still was adding locations. “This is a project I know will never be 100 percent complete. It is perfect to do while I’m self-quarantined,” said Smith, who uses Esri’s ArcGIS online mapping software.

A female demonstrator offers a flower to a soldier at an anti-war protest at the U.S. Pentagon in 1967. Courtesy of Wikicommons/ Photo by S.Sgt. Albert R. Simpson. Department of Defense. Department of the Army. Office of the Deputy Chief of Staff for Operations. U.S. Army Audiovisual.
Media coverage of protests: Then and now
Google, Twitter and YouTube weren’t around when anti-Vietnam war protesters chanted “Hell no, we won’t go” in the late 1960s and early 1970s. These activists depended on mainstream television and newspapers to get their message out. That put them in a precarious position, said media scholar Douglas M. McLeod.
“They had a hard time getting media attention unless they did something dramatic like engage in civil disobedience, which often brought a response from the police. Ultimately, that kind of coverage portrayed the protesters as deviants and had detrimental effects on public reaction,” explained McLeod, who has studied media coverage of social protests for almost 40 years.
The 21st century has seen profound changes in the media landscape. Mobile phones have turned citizens into public watchdogs, capturing events on video and posting them on YouTube. Activists use the Internet and social media as megaphones, bypassing the Fourth Estate. A more diverse media environment gives voice to the voiceless on social issues like racism and police brutality.
During research for this report, the term “protest paradigm” repeatedly showed up in studies about media coverage of social unrest. Coined decades ago by McLeod and fellow scholar James Hertog, it referred to newsgathering patterns that tended to disparage protesters, obscure their role in the political arena, and give greater voice to the authorities.
In June, the term resurfaced in a NiemanLab report titled, “It’s time to change the way the media reports on protests.” According to the article, for almost a week after the BLM demonstrations started “national media made editorial choices, mirroring a framework social scientists have dubbed the `protest paradigm,’ that often failed to frame the events of the day accurately.”
It’s the idea that “the press contributes to the political status quo by reinforcing whatever the government thinks,” media researcher Danielle Kilgo told NiemanLab.
In the context of race and racism, data helps validate experiences and perspectives that are often undercut, misunderstood, silenced or ignored.
At first, McLeod also thought the paradigm might be in play. He observed the framing of the protests as contests between the police and demonstrators. There was more emphasis on the protesters’ acts of civil disobedience than on critical issues like racism. Much of the early coverage followed the same pattern of portraying the marchers as deviant, said the University of Wisconsin journalism professor.
Then, as momentum spread across the globe, he noticed changes in media content -- stories began appearing more sympathetic to the protesters and their causes. “Initially, we saw coverage that reflected the protest paradigm, and then a gradual shift away from that,” said McLeod.
He speculates that communication tools in the hands of the movement made it easier for the public and journalists to have access to the protesters’ viewpoints. The duration and size of the demonstrations made it harder to ignore the legitimacy of issues that drove the activism.
“When public opinion begins to shift the media coverage will respond as well,” said McLeod. A June Pew Research Center Report found that two-thirds of U.S. adults support the Black Lives Matter movement.
There might have been another factor. “In the context of race and racism, data helps validate experiences and perspectives that are often undercut, misunderstood, silenced or ignored,” said Kilgo, who studies media portrayal of social movements. “Narratives holding police behaviour accountable would bring a shift to the protest paradigm.”
Using forensic methods of investigation, mapping tools and visualisation, journalists have shed light on what may be the largest social movement in American history.

A Black Lives Matter Protest in Washington D.C. on 1 June 2020. Courtesy of Unsplash/ Instagram: @koshuphotography
Documenting police violence and racism
In today’s political environment, exposing racism and police brutality often is a prime target for investigative journalists. Data is among the key building blocks.
Videos, maps and graphics have been used to verify police violence against protesters, expose patterns of racism in American communities, and reconstruct the scene where George Floyd cried “I can’t breathe” while a White police officer knelt on his neck. Some of the projects have become prototypes for multi-dimensional storytelling.
In July, the Washington Post published “Resources to understand America’s long history of injustice and inequality,” featuring in-depth stories, videos, photo essays, audio and graphics of Black history and the progress – or lack of it – in the fight for racial justice. It wasn’t the first time the Washington Post put racism under the microscope.
In 2015, the newspaper created a database of police killings, logging in all fatal shootings by an on-duty police officer in the United States. Among the findings: “Although half of the people shot and killed by police are White, Black Americans are shot at a disproportionate rate. They account for less than 13 percent of the U.S. population, but are killed by police at more than twice the rate of White Americans.”
Hispanic Americans also are killed by police at a disproportionate rate, the study found. The Post’s methodology for “Fatal Force” can be read here.
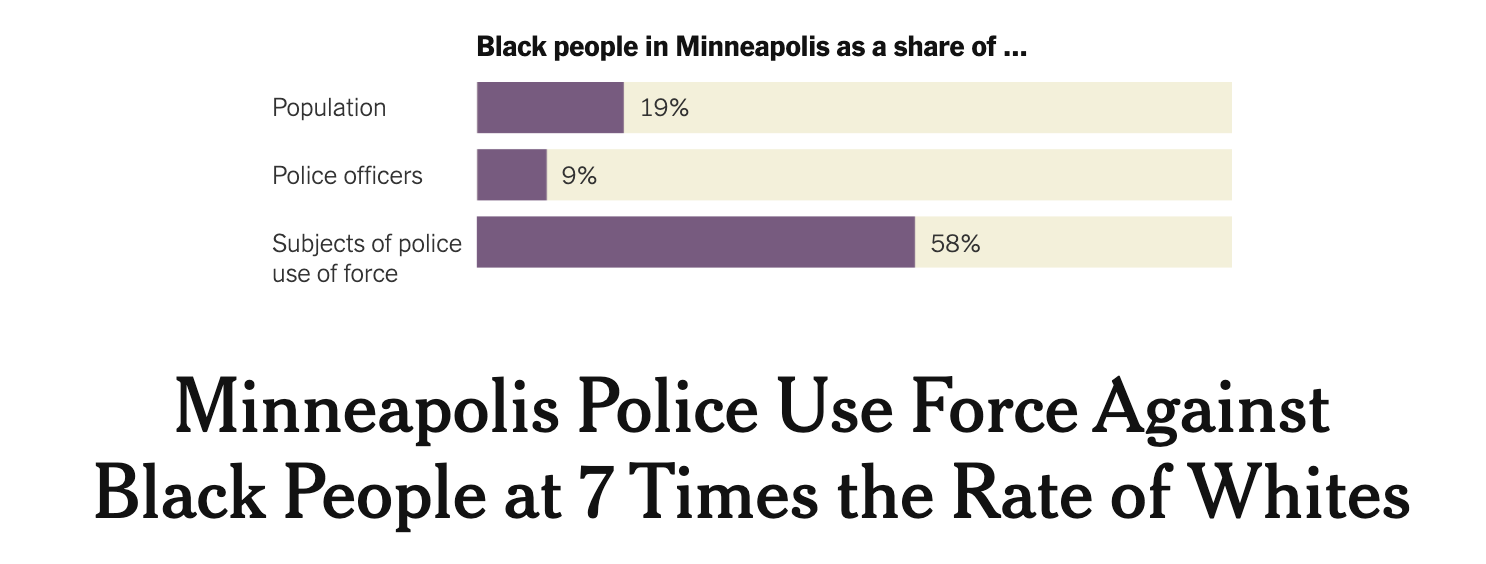
In June, The New York Times zeroed in on police brutality in Minneapolis, examining data from 2015 through May 26, the day after George Floyd’s death. The pattern of abuse was striking: Minneapolis police used force against Black people at seven times the rate of Whites. A map broke down police use of force against the Black population by city block. A graphic illustrated how often neck restraints, chemical irritants and other types of force were used on Black people versus Whites. About 20 percent of Minneapolis’s population of 430,000 is Black. “But when the police get physical — with kicks, neck holds, punches, shoves, takedowns, mace, tasers or other forms of muscle — nearly 60 percent of the time the person subject to that force is Black, according to the city’s own figures,” the Times reported.
For another story, The New York Times’ visual investigative team reconstructed the minutes leading to Floyd’s death, using security footage, witness videos, official documents, and interviews with experts, a combination of traditional reporting with advanced digital forensics. The video shows evidence of officers violating Minneapolis Police Department policies as they tormented Floyd.
There is evidence of police assaults on another front. Bellingcat, a non-profit investigative group, collaborated with The Guardian to visualise police violence against journalists at protests across the U.S. They found more than 148 arrests or attacks on reporters and photojournalists between May 26 and June 2. These were known incidents; the total could be higher.
Charlotte Godart, a Bellingcat investigator, described the data-gathering, process for this investigation: “We compiled the data into a spreadsheet and plotted each of the incidents using geolocation. We compared the streets, buildings, and specific details in the videos and images until we were able to find, in most instances, the exact spots where these journalists were standing when they were detained, pepper-sprayed, or physically assaulted by the police.” An interactive map visualised where these incidents occurred in space and time. The Bellingcat website provides a “Beginner’s Guide to Geolocating’ video.

In search of reliable data
Over the years, Amnesty International has fought a continuing battle against the world’s worst human rights abuses. In May, the spotlight was on America. Between May 26 and June 5, 2020, researchers documented 125 incidents of police violence against protesters, journalists and bystanders in 40 states and the District of Columbia committed by state and local police, National Guard troops and security forces from federal agencies.
According to the report, “Police across the U.S. committed widespread and egregious human rights violations against people protesting the unlawful killings of Black people and calling for police reform.” Abuses included beatings, misuse of tear gas and pepper spray, and firing projectiles such as rubber bullets directly at protesters. A Washington Post story told of eight people being partially blinded by the police.
For journalists, the Amnesty report was a bonanza. The data provided reporters with fodder to explore police activities in their hometowns. It also linked to a larger issue: Brutality by law enforcement on a national scale that went beyond the urban centres.

Investigators found that local police improperly used tear gas against peaceful protesters in Murfreesboro, Tennessee, Sioux Falls, South Dakota, and Conway, Arkansas, among others. In Iowa City, Iowa, police fired tear gas and threw flash-bang grenades at protesters kneeling and chanting “Hands up, don’t shoot,” according to Amnesty. In Fort Wayne, Indiana, a local journalist lost his eye when police shot him in the face with a tear gas grenade.
"The analysis is clear: when activists and supporters of the Black Lives Matter movement took to the streets in cities and towns across the country to peacefully demand an end to systemic racism and police violence, they were overwhelmingly met with a militarized response and more police violence," said Brian Castner, Amnesty's senior crisis adviser on arms and military operations in a statement.
Amnesty’s website posted a summary on how the data was collected: “The Crisis Evidence Lab gathered almost 500 videos and photographs of protests from social media platforms. The digital content was verified, geolocated and analysed by investigators with experience in weapons, police tactics, and international and U.S law governing the use of force. In some cases, researchers were also able to interview victims and confirm police conduct with local police department departments."
Non-profits like Amnesty International provide reliable information and are go-to sources for reporters. Media Bias/Fact Check rates Amnesty high for factual reporting “due to proper sourcing and a reasonable fact check record.”
In some newsrooms, journalists themselves are gaining the skills to do open-source investigative reporting, using visual forensic methods to tell the story. In a June 16 article for Global Investigative Journalism Network (GIJN) reporter Rowan Philp highlighted tools and techniques reporters around the globe are using.
“These tools are absolutely remarkable, especially when we add dogged curiosity. Then they become really powerful,” said Philp, a GIJN media reporter and former foreign correspondent who has covered corruption and conflict in more than two dozen countries.
His article points out that the visual forensics approach “is not about a smoking gun document or whistleblower’s testimony, but rather about assembling pieces of a visual and time puzzle, where, taken together, they have the weight of evidence to have an impact.”
This raw evidence can expose attacks by security forces beyond a reasonable doubt. Philp cited an example from BBC’s Africa Eye where reporters grabbed Facebook Livestream clips of a protest in Sudan in real-time, and later pieced together evidence of the massacre of at least 61 protesters by a hostile militia. The team reconstructed events from 300 mobile phone videos, mostly taken by protesters as they fled.
Philp has high praise for Bertram Hill, part of Africa Eye’s investigative team. Hill has developed an accessible list of more than 200 open source and forensic tools that are Africa-centric but can be applied globally. “These are incredible tools for journalists anywhere and most of them are free,” said Philp.
His GIJN story lists 12 techniques used in recent investigations tracing abuse by security forces. Among them:
“Remember the familiar tools you use every day. If you need to show that a protester or police officer could not have walked from A to B in a certain time, just enter those addresses in Google Map, and it will automatically show the walking time.”
“Track individuals through video clips by using markers, like distinctive clothing. One man’s bald spot proved to be an important marker for the NYT investigation into the beating of protesters by a Turkish security detail.”
“Avoid manipulating footage, unless it is essential for audience understanding, and, if you do, explain why you’re altered it. However, artificially highlighting an object, like a weapon, is appropriate, when presented within the context of the original photo.”
Philp’s story contains a dizzying array of information from timeline-based video editing tools and advanced search functions on Google and Twitter to archiving tools and people-finding apps like Pipl and Spokeo. Hill’s list of 200 resources can be found here.
The use of data to expose police violence and racism is inspiring. It clearly makes a case for visual forensic methods and other cutting-edge technology to be part of the journalists’ toolkit. Philp would like to see reporters around the world develop these niche skills, as he calls them. The results, he said, can be “exhilarating.”
Other resources that can help:
The Committee to Protect Journalists (CPJ) has posted a safety advisory and monitors incidents of police violence against the press via the U.S. Press Freedom Tracker. According to CPJ, the police appear to be responsible for the majority of incidents, although crowds and protesters also have targeted the press.
Among CPJ’s tips for digital safety:
- Be aware of the information stored on your devices. Think about the type of information police will have access to should they detain you and gain access to phone or laptop.
- If possible, leave your main phone behind and instead carry a phone that has minimal information on it. If you cannot leave your phone behind remove as much personal information as possible, including logging out of and deleting apps from the phone. For more information, see CPJ’s advice about device security.
- Turn off location services for your apps]as this information is stored by companies and could be subpoenaed by the authorities at a later date.
The U.S. Crisis Monitor bills itself as “The only source of real-time data that captures both political violence as well as demonstrations in the United States.” This joint effort of the Armed Conflict Location & Event Data Project and the Bridging Divides Initiative at Princeton University features an interactive crisis mapping tool that is updated regularly with new data and trends.
National Press Photographers Association: Practical advice about covering high profile news stories during protests and the upcoming election by Micki Osterreicher, NPPA general counsel. It offers information on a variety of topics, including arrest and release, being questioned or detained, and complying with police orders.
First Draft News: George Floyd Protests: Resources for online newsgathering, verification, protecting sources and colleagues*. It covers how to use social media to report on protests over police brutality and structural racism sweeping the world.

- Data visualisation by hand: drawing data for your next story
- A data journalists guide to building a hypothesis
- Making numbers louder: telling stories with sound
- Conflict reporting with data
- The promise of WikiData as a data source for journalists
- Harnessing Wikipedia's superpowers for journalists
- Own your newsfeed, own your data
- Privacy guide for data journalists


Capturing racial justice protests with data - How verification and open source investigative techniques exposed police brutality, racism and the need for change
15 min (1) - Click to comment