Technology
Mapped: The Top Surveillance Cities Worldwide
#surveillance-cities-map{min-height: 672px;}@media (max-width: 1200px){#surveillance-cities-map{min-height: 820px;}}
The Top Surveillance Cities Worldwide
Since the world’s first CCTV camera was installed in Germany in 1942, the number of surveillance cameras around the world has grown immensely. In fact, it only took us 79 years to go from one camera to nearly one billion of these devices.
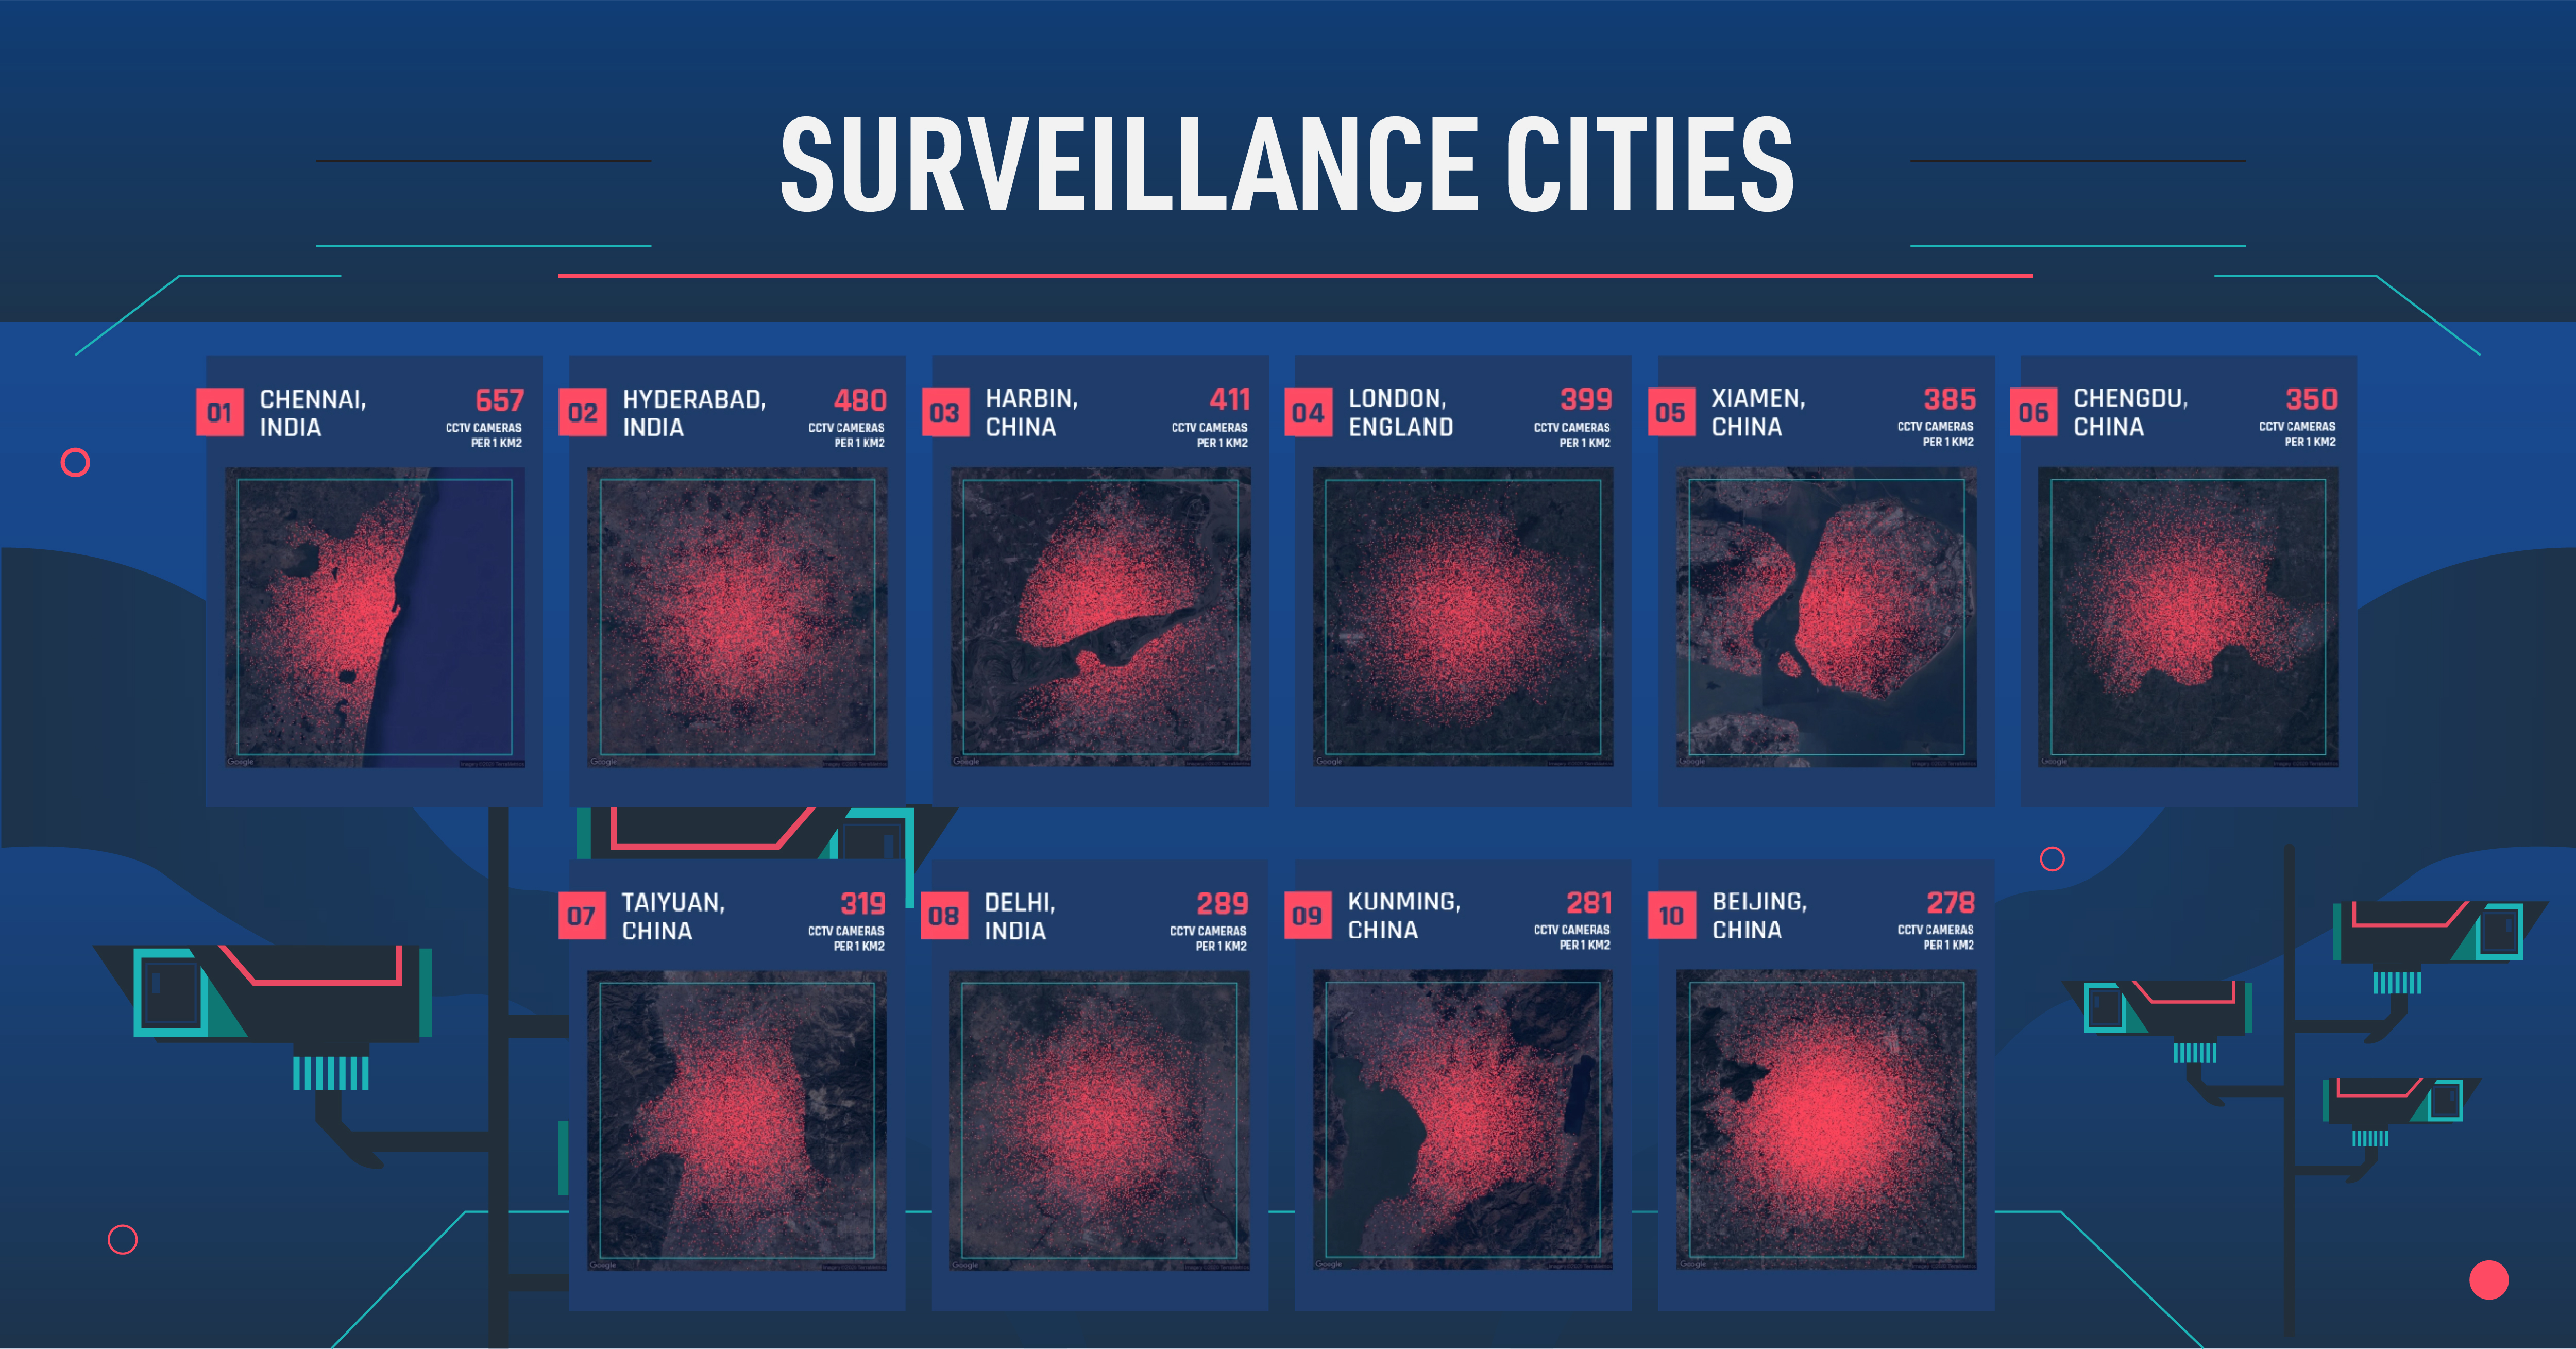
In the above interactive graphic, Surfshark maps out how prevalent CCTV surveillance cameras are in the world’s 130 most populous cities.
Big Brother is Watching
So how many of us are being watched? China and India are the countries with the highest densities of CCTV surveillance cameras in urban areas. Chennai, India has 657 cameras per square kilometer, making it the number one city in the world in terms of surveillance.
Here’s a closer look at the world’s top 10 cities by CCTV density.
| Rank | City | CCTVs per square km | CCTVs per 1,000 people |
|---|---|---|---|
| #1 | 🇮🇳 Chennai, India | 657 | 25.5 |
| #2 | 🇮🇳 Hyderabad, India | 480 | 30.0 |
| #3 | 🇨🇳 Harbin, China | 411 | 39.1 |
| #4 | 🇬🇧 London, England | 399 | 67.5 |
| #5 | 🇨🇳 Xiamen, China | 385 | 40.3 |
| #6 | 🇨🇳 Chengdu, China | 350 | 33.9 |
| #7 | 🇨🇳 Taiyuan, China | 319 | 119.6 |
| #8 | 🇮🇳 Delhi, India | 289 | 14.2 |
| #9 | 🇨🇳 Kunming, China | 281 | 45.0 |
| #10 | 🇨🇳 Beijing, China | 278 | 56.2 |
London is the only non-Asian city to crack the list with 399 CCTV cameras per square kilometer.
Beijing ranks in tenth place. The Chinese capital has the highest number of CCTV cameras in total, at just over 1.1 million installed in the city.
Although CCTV cameras have become extremely prevalent in cities around the world, this does not mean these cameras are seeing and recognizing our every move. In most instances, cameras are in a fixed position—and some of the more invasive aspects of CCTV, like accompanying facial recognition technology, are not universal yet.
The Need for CCTV
The ubiquity of surveillance cameras can be unnerving to some, as they represent diminishing privacy. However, there are also those that feel the presence of cameras creates added safety.
While governments like China’s claim that having high amounts of surveillance cameras helps reduce crime, the actual data gets messy. For example, the Chinese city of Taiyuan has roughly 120 cameras per every thousand people and yet the city has a higher crime index than most.
Freedom vs. Security
As surveillance networks become more sophisticated and granular, there is increasing concern about breaches to personal freedoms.
China is doubling down with surveillance in its cities by pioneering the usage and exportation of facial recognition technology. This technology is integral to China’s proposed social points system. With a database of 1.3 billion pictures that can be matched to a face on a CCTV camera in seconds, troublemaking citizens can easily be identified.
In India, on the other hand, the amount of cameras can be attributed to mass urbanization, rising crime, and scarcity of urban resources. Overall, there is a rising middle class that wishes to protect itself with the use of CCTV cameras.
As we close in on one billion CCTV surveillance cameras globally by the end of 2021, we will undoubtedly continue to be monitored well into the future.


Technology
All of the Grants Given by the U.S. CHIPS Act
Intel, TSMC, and more have received billions in subsidies from the U.S. CHIPS Act in 2024.


All of the Grants Given by the U.S. CHIPS Act
This was originally posted on our Voronoi app. Download the app for free on iOS or Android and discover incredible data-driven charts from a variety of trusted sources.
This visualization shows which companies are receiving grants from the U.S. CHIPS Act, as of April 25, 2024. The CHIPS Act is a federal statute signed into law by President Joe Biden that authorizes $280 billion in new funding to boost domestic research and manufacturing of semiconductors.
The grant amounts visualized in this graphic are intended to accelerate the production of semiconductor fabrication plants (fabs) across the United States.
Data and Company Highlights
The figures we used to create this graphic were collected from a variety of public news sources. The Semiconductor Industry Association (SIA) also maintains a tracker for CHIPS Act recipients, though at the time of writing it does not have the latest details for Micron.
| Company | Federal Grant Amount | Anticipated Investment From Company |
|---|---|---|
| 🇺🇸 Intel | $8,500,000,000 | $100,000,000,000 |
| 🇹🇼 TSMC | $6,600,000,000 | $65,000,000,000 |
| 🇰🇷 Samsung | $6,400,000,000 | $45,000,000,000 |
| 🇺🇸 Micron | $6,100,000,000 | $50,000,000,000 |
| 🇺🇸 GlobalFoundries | $1,500,000,000 | $12,000,000,000 |
| 🇺🇸 Microchip | $162,000,000 | N/A |
| 🇬🇧 BAE Systems | $35,000,000 | N/A |
BAE Systems was not included in the graphic due to size limitations
Intel’s Massive Plans
Intel is receiving the largest share of the pie, with $8.5 billion in grants (plus an additional $11 billion in government loans). This grant accounts for 22% of the CHIPS Act’s total subsidies for chip production.
From Intel’s side, the company is expected to invest $100 billion to construct new fabs in Arizona and Ohio, while modernizing and/or expanding existing fabs in Oregon and New Mexico. Intel could also claim another $25 billion in credits through the U.S. Treasury Department’s Investment Tax Credit.
TSMC Expands its U.S. Presence
TSMC, the world’s largest semiconductor foundry company, is receiving a hefty $6.6 billion to construct a new chip plant with three fabs in Arizona. The Taiwanese chipmaker is expected to invest $65 billion into the project.
The plant’s first fab will be up and running in the first half of 2025, leveraging 4 nm (nanometer) technology. According to TrendForce, the other fabs will produce chips on more advanced 3 nm and 2 nm processes.
The Latest Grant Goes to Micron
Micron, the only U.S.-based manufacturer of memory chips, is set to receive $6.1 billion in grants to support its plans of investing $50 billion through 2030. This investment will be used to construct new fabs in Idaho and New York.

-

 Education1 week ago
How Hard Is It to Get Into an Ivy League School?
-

 Technology2 weeks ago
Ranked: Semiconductor Companies by Industry Revenue Share
-

 Markets2 weeks ago
Ranked: The World’s Top Flight Routes, by Revenue
-

 Demographics2 weeks ago
Population Projections: The World’s 6 Largest Countries in 2075
-

 Markets2 weeks ago
The Top 10 States by Real GDP Growth in 2023
-

 Demographics2 weeks ago
The Smallest Gender Wage Gaps in OECD Countries
-

 Economy2 weeks ago
Where U.S. Inflation Hit the Hardest in March 2024
-

 Environment2 weeks ago
Top Countries By Forest Growth Since 2001