
The mesmerizing visualizations brought to you by the eBird Science team with the help of more than 300,000 eBirders around the world offer a bird’s-eye view of avian movements. One could easily get lost in watching warblers and flycatchers migrate across continents—it’s an experience like no other. “I just love looking at the animations and learning about where birds spend the winter and seeing how they move into my area. I could do that for hours.” says Lucas Foerster, an eBird reviewer in Ontario, Canada.
This year, for the first time, the eBird Science team built models depicting movements, distribution, and abundance patterns for 179 species whose breeding range is outside of the United States and Canada and augmented an expanded set of species from the Americas. The team pulled in 6 million more eBird checklists from 3.5 million more locations and refined cutting-edge statistical models and machine learning techniques to visualize distribution and abundance patterns for 807 species.
What’s new
- 807 species—197 more species than 2019
- 179 species whose breeding range is outside the United States and Canada
- Global roads inventory
- Improved water body data
- 6 million more checklists
- 3.5 million more locations
- Checklists from 311,692 eBirders
A global look
Dr. Alice Boyle, associate professor at Kansas State University says she’s really excited to see status and trends results for more tropical species this year. The eBird Status and Trends models reveal patterns that Boyle says, “we can’t usually see and are nearly impossible to study in the field, which is incredibly useful for generating new hypotheses.”
Dr. Alex Lees, associate professor at Manchester Metropolitan University, says, “the new iteration of eBird Status and Trends data products represents a step change in our knowledge of how birds are distributed in space and time. As someone who has worked on combating the pervasive assumption of residency for many tropical species, it is incredibly exciting to see the first steps towards dynamic models of species distributions in the Old World tropics.”
 Sparkling Violetear © Claudia Brasileiro/Macaulay Library
One of the new species modeled this year is the Sparkling Violetear, a hummingbird found in South America. “The abundance animation visualizations show some really spectacular movements in the Andes”, says Luke Seitz, eBird Status and Trends reviewer at the Cornell Lab of Ornithology. “The northern populations are stationary while the southern populations move down the Andes in the summer months. Being able to visualize movement patterns like this at a large spatial scale greatly improves our understanding of the species’ biology,” says Seitz.
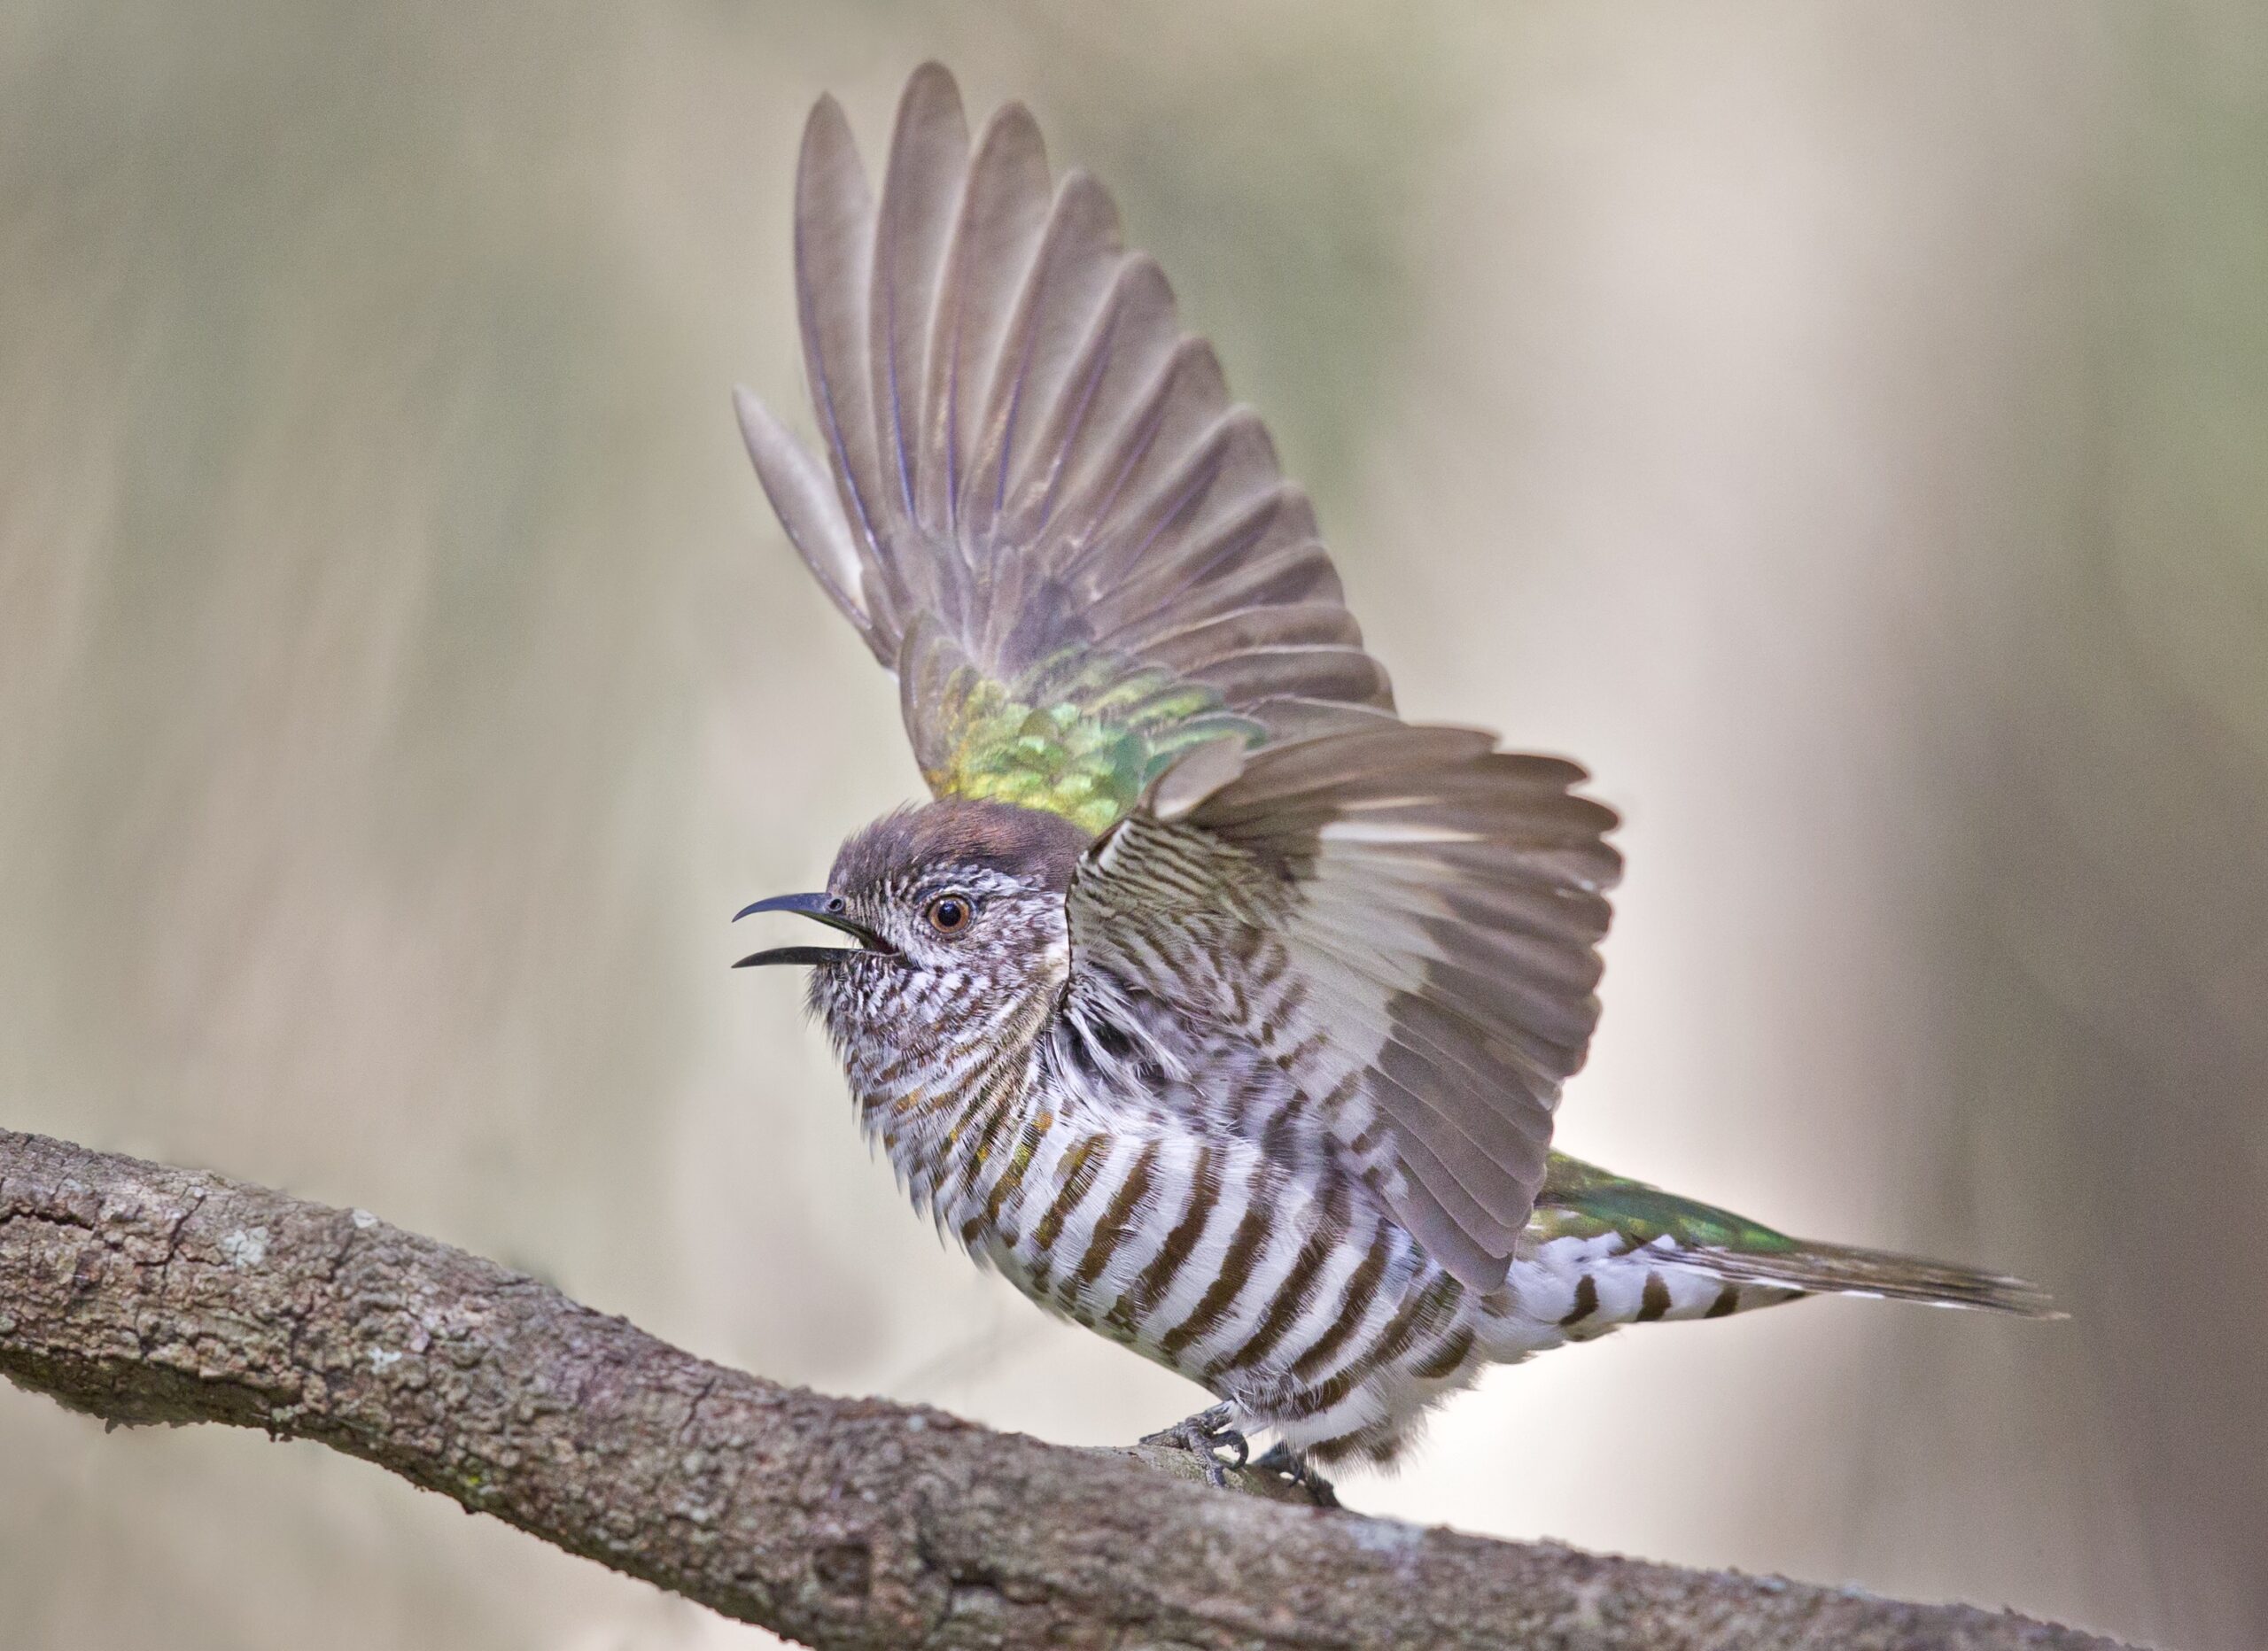
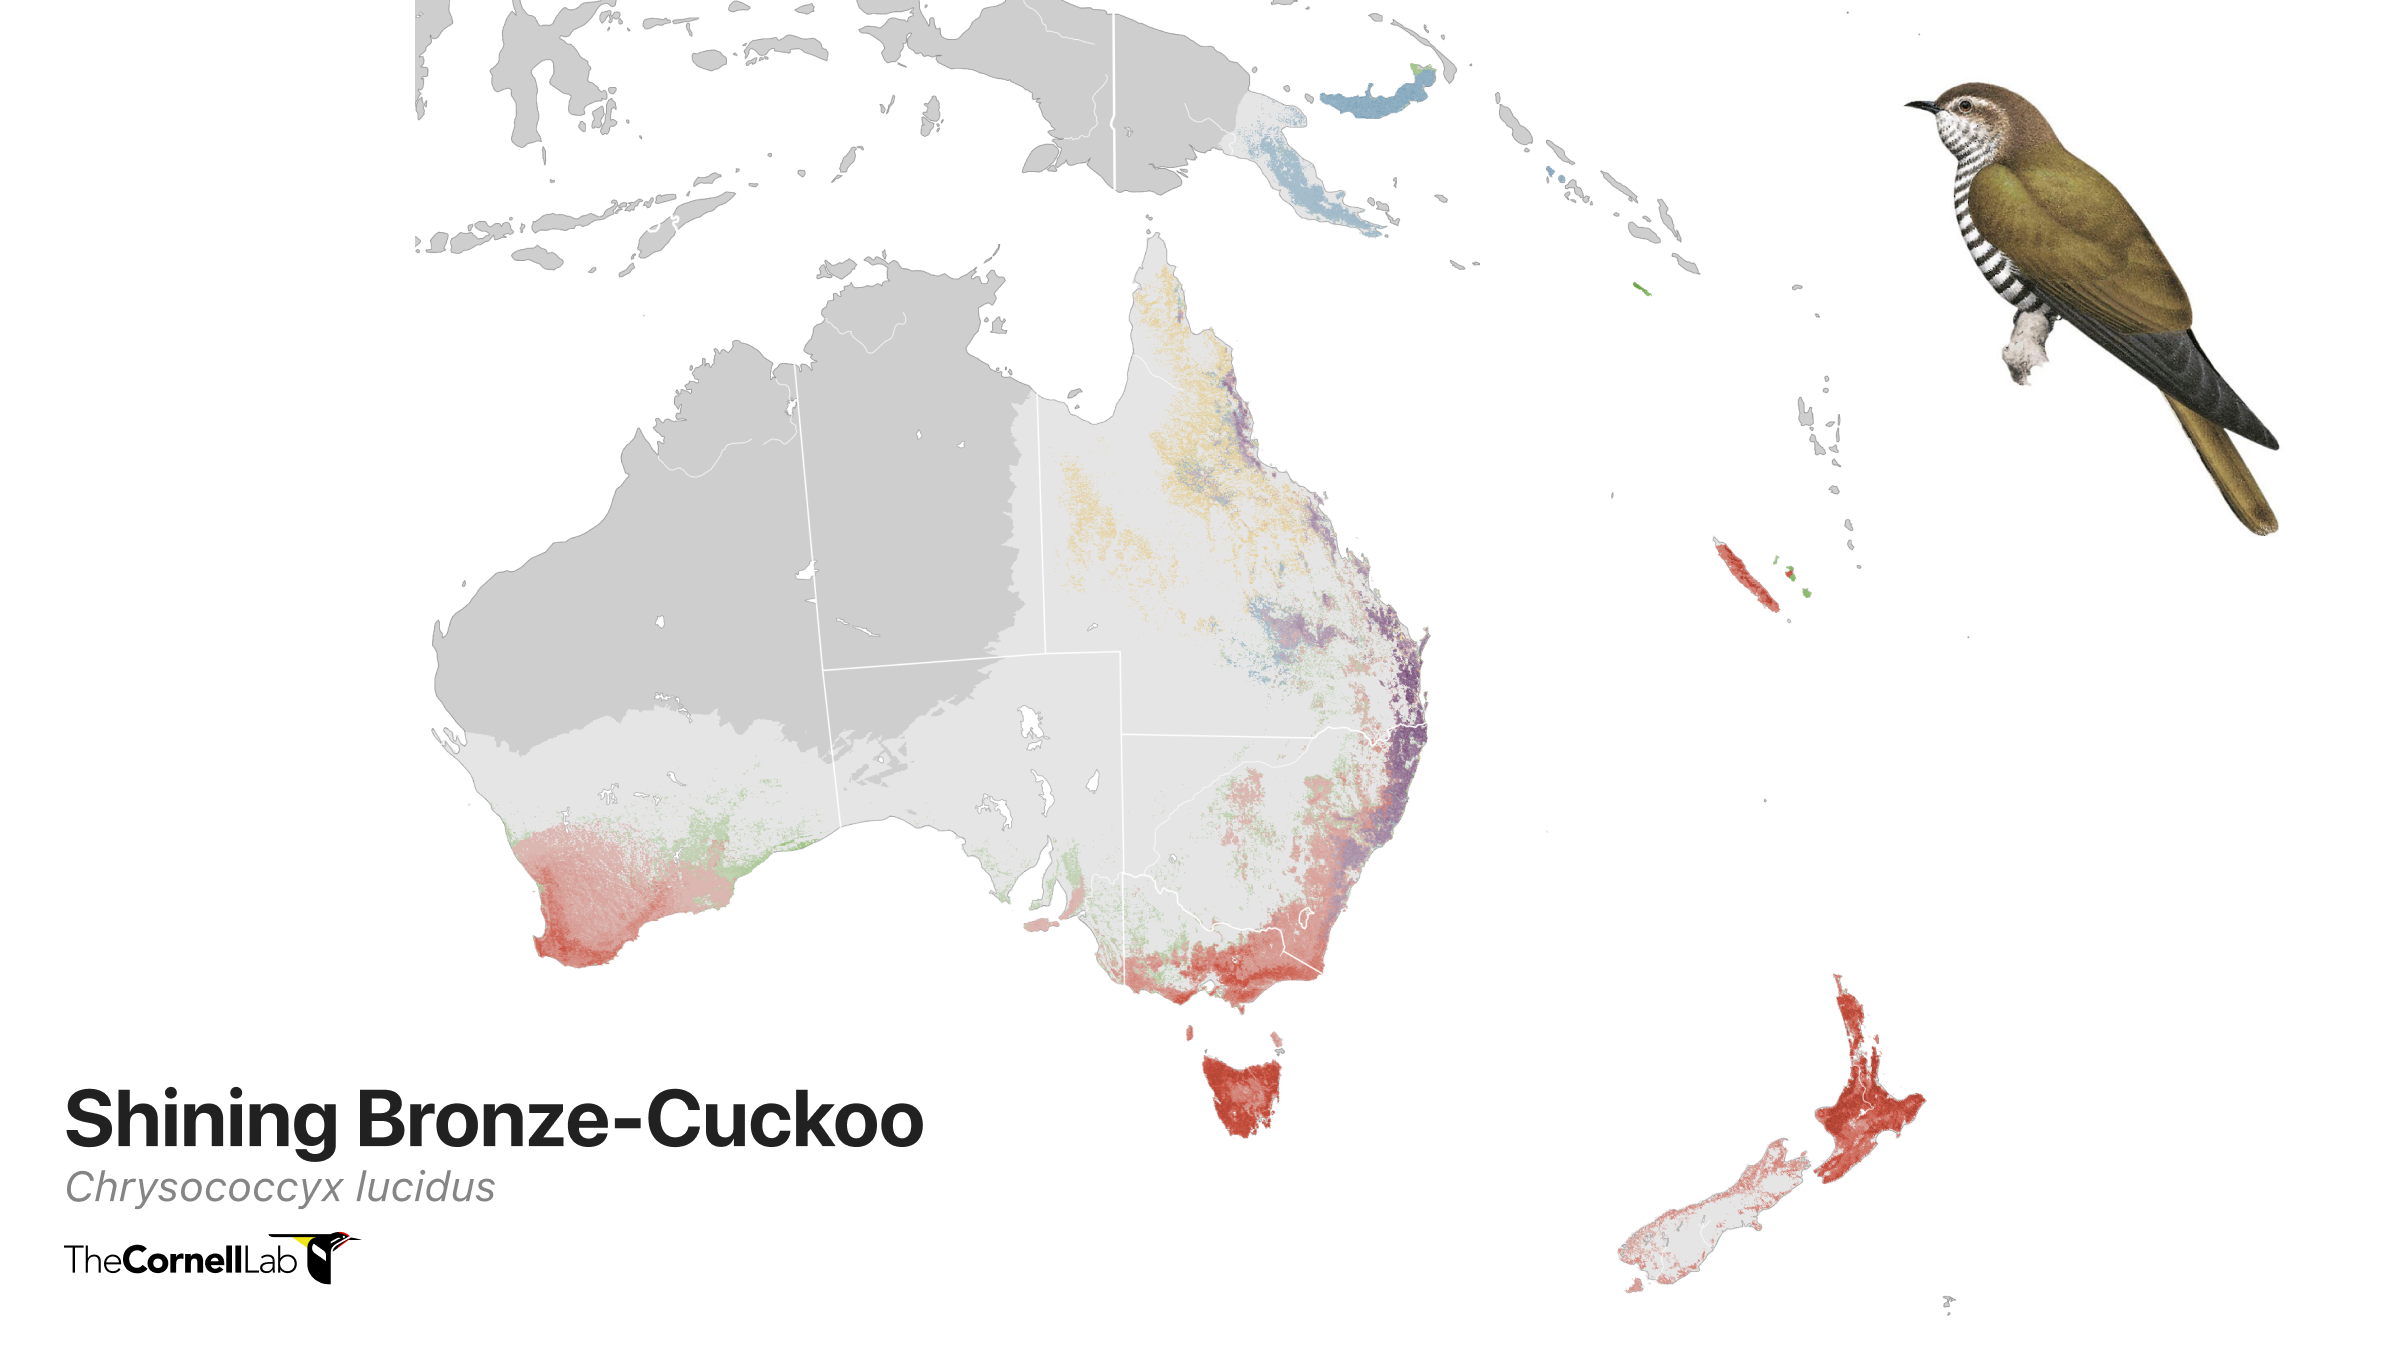
Shining Bronze-Cuckoo © Mat Gilfedder/Macaulay Library
Outside of the Americas, the new eBird Status and Trends products are helping us visualize movement patterns never before seen. Some Shining Bronze-Cuckoos are year-round residents in parts of Australia, but other populations migrate from Western Australia to Indonesia while other populations migrate from New Zealand to New Britain and the Solomons stopping along the eastern coast of Australia. “These animations reveal the strong migration signal of Shining Bronze-Cuckoos in southern Australia and they also highlight how these birds rely on several countries in our region,” says Mat Gilfedder, an eBird reviewer in Australia and a member of the eBird Australia team. Gilfedder adds, that because the Shining Bronze-Cuckoo subspecies residing in New Zealand has a green crown while birds in Australia have a brown crown, eBirders can document which subspecies they see to identify the migrating New Zealand birds at stopover locations in Australia to help paint a more complete picture of their migratory route.
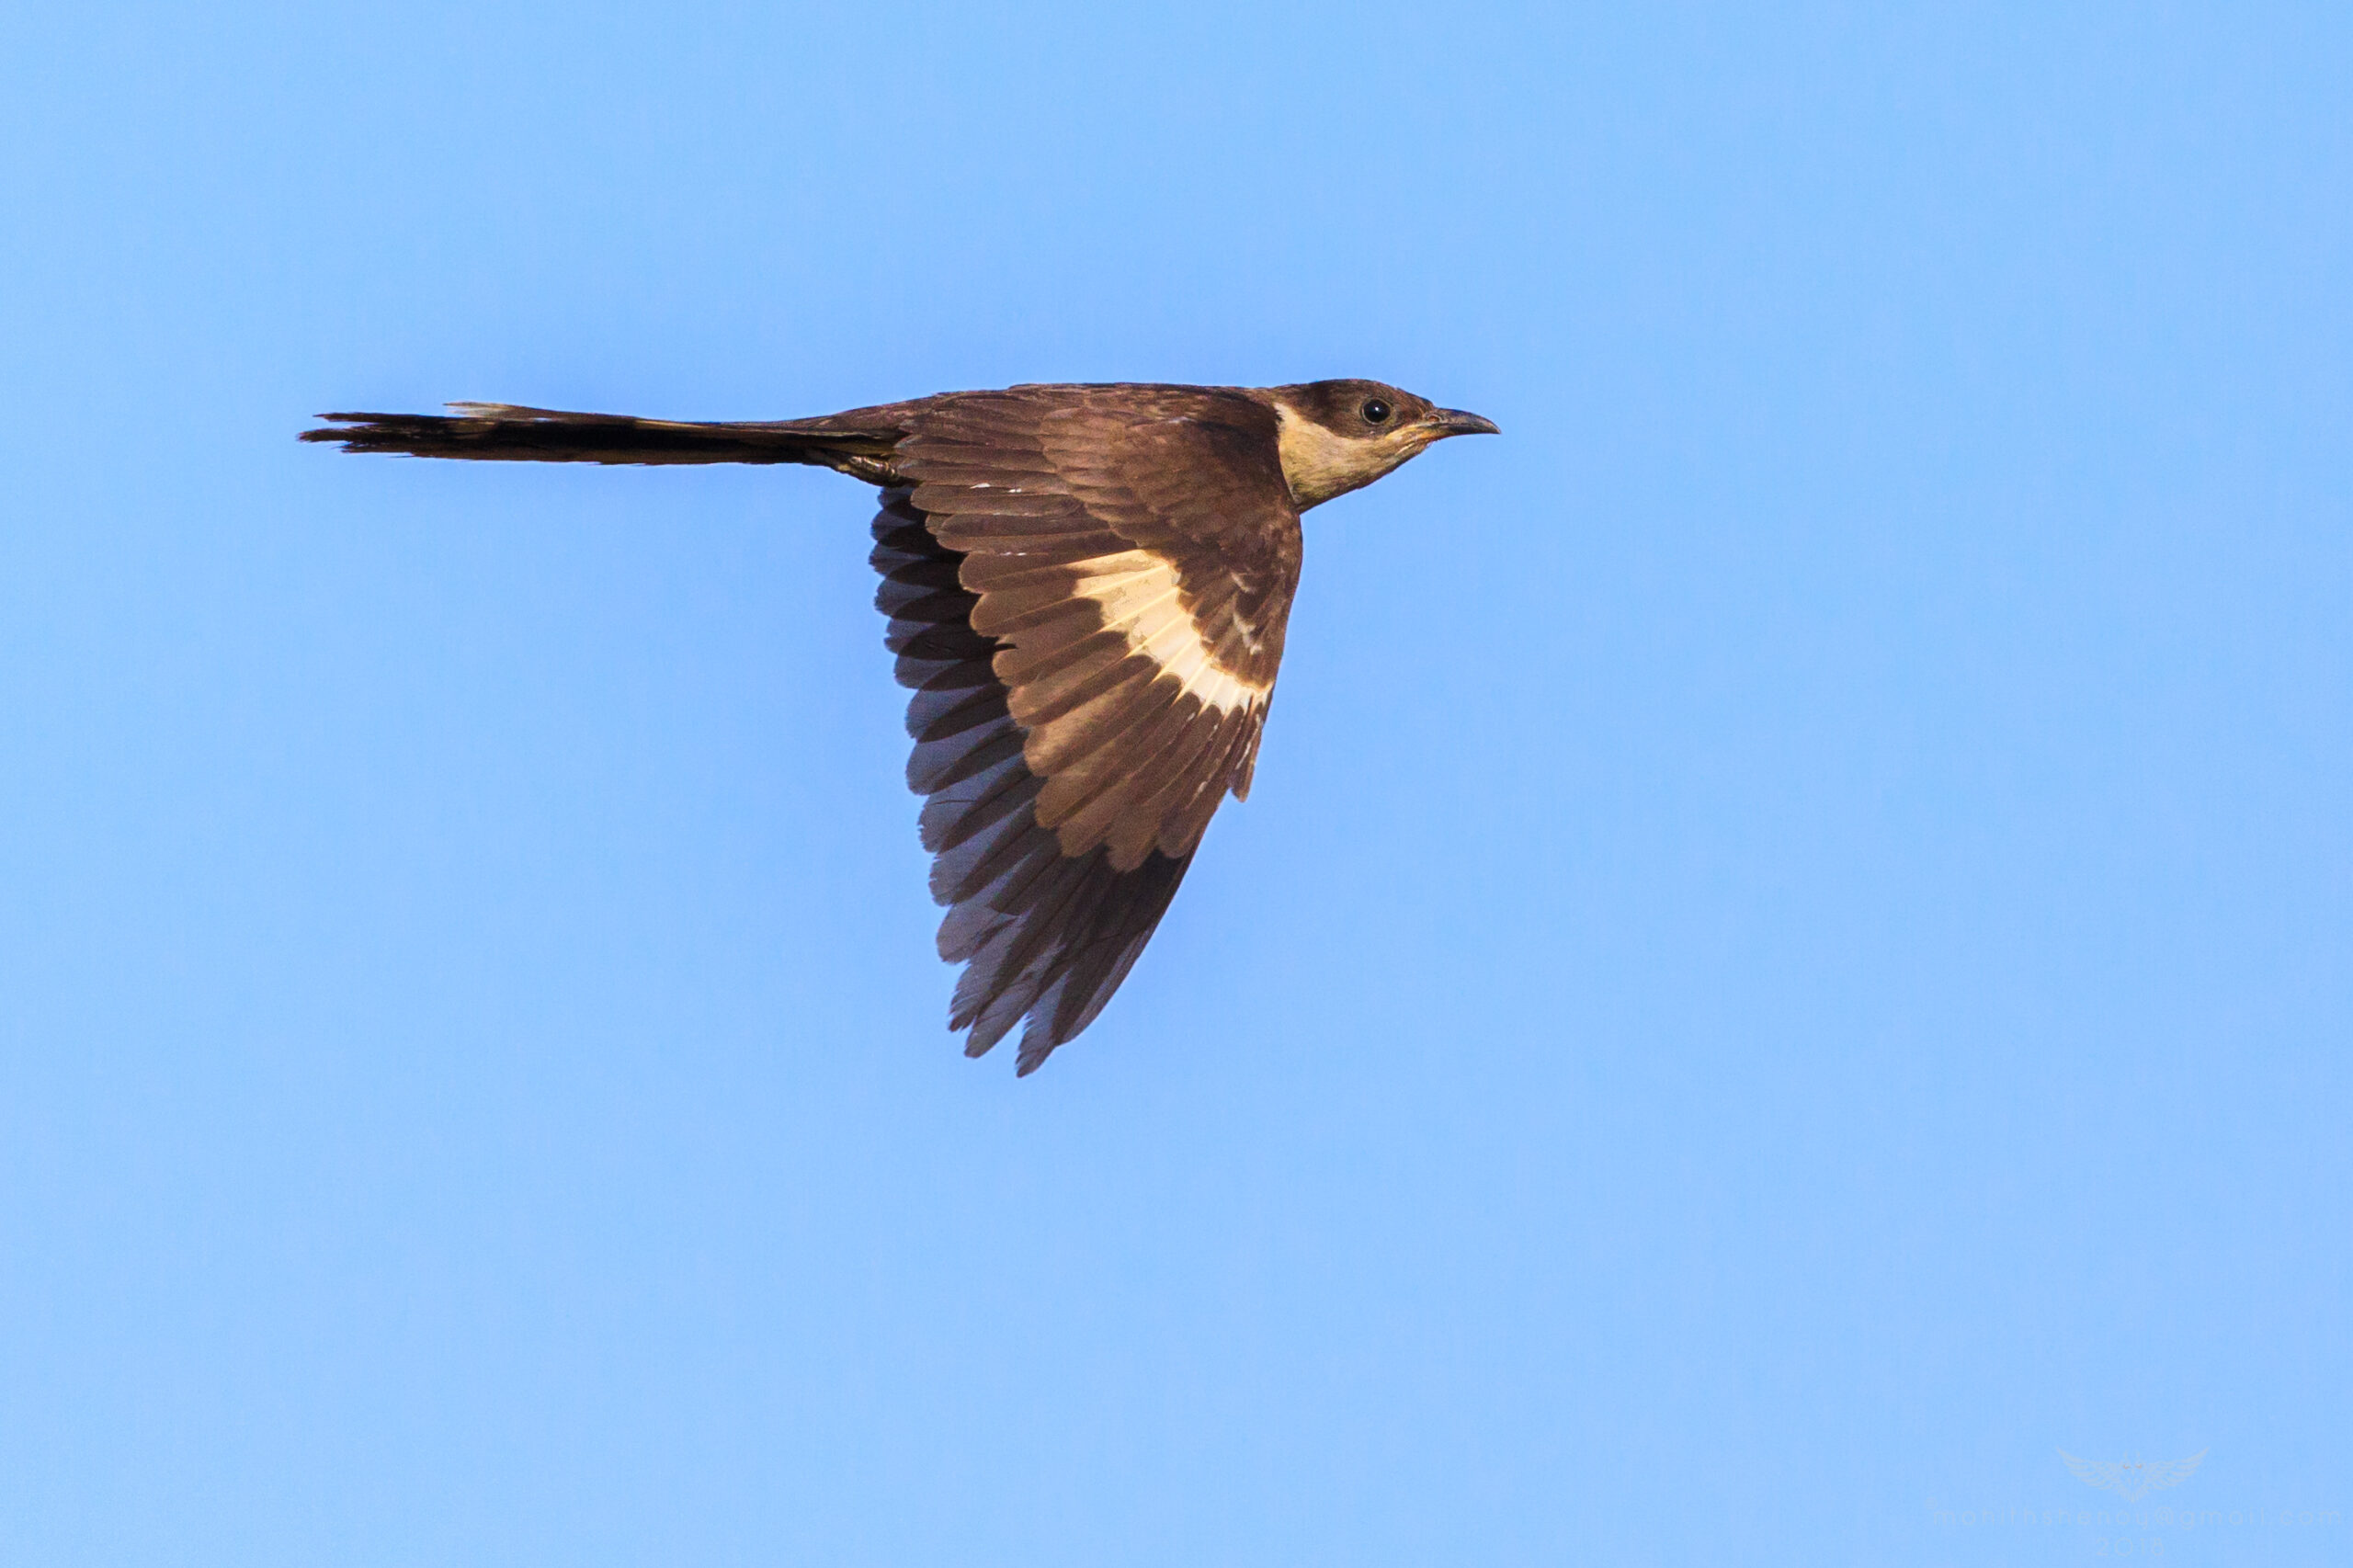
Pied Cuckoo © Mohith Shenoy/Macaulay Library
Pied Cuckoos, also known as the “rain bird,” move over the ocean from Africa to India and back again, following the rains. They arrive in Africa as the rainy season brings an abundance of caterpillars and when the rain subsides they migrate to India in time for the rain there. The eBird Status and Trends visualizations highlight continental movements and underscore the importance of ensuring habitat protections across countries. The first ever models outside the Americas also highlight the need for more checklists. Some areas within a species’ range do not have enough data to be modeled with confidence, hence areas in West Africa are not displayed for the Pied Cuckoo.
Better models to power research and conservation
Daniel Fink, research associate and one of the developers of the models, at the Cornell Lab of Ornithology says, “one of the unique things about eBird Science Status and Trends data products is that we are analyzing distribution and abundance patterns across broad extents at fine spatial resolution at weekly intervals throughout the year.” The results of which are visualized in map format, but Fink says, “the results are more than just maps, it’s a statistical process distilled into map visualizations.” Another aspect that makes the visualizations unique is the amount of work that goes into verifying and checking the results to ensure what we are seeing is valid, says Fink. A team of global bird experts pour over the results every year flagging models that don’t look right and giving an A-grade to those that look as expected.
To improve the visualizations and to better understand human impacts on birds, this year the team included a global roads network and an improved global water body dataset from NASA in their analyses. Tom Auer, research associate at the Cornell Lab of Ornithology, says “the roads data improve the fit of the models, showing that bird abundance is low near roads for species that don’t respond well to road disturbance. But there’s a wealth of yet-explored information here, looking at what road types might be more or less associated with bird abundance.” In short, says Auer, “There is lots to study.”
Sprague’s Pipit is one of the species where the addition of the road data shows fewer individuals near roads. Although previous research aimed at identifying causes of decline in Sprague’s Pipits found ambiguous results when it came to the impact of roads, the new eBird Science models show that roads may be affecting pipits after all. In Montana, Alberta, and Saskatchewan tiny lines are breaking up otherwise contiguous detections of Sprague’s Pipits. Those tiny lines are roads, suggesting that Sprague’s Pipits may be avoiding areas near roads. Armed with this knowledge, researchers can investigate the impacts more thoroughly to better understand how road density impacts Sprague’s Pipits and other declining grassland birds.
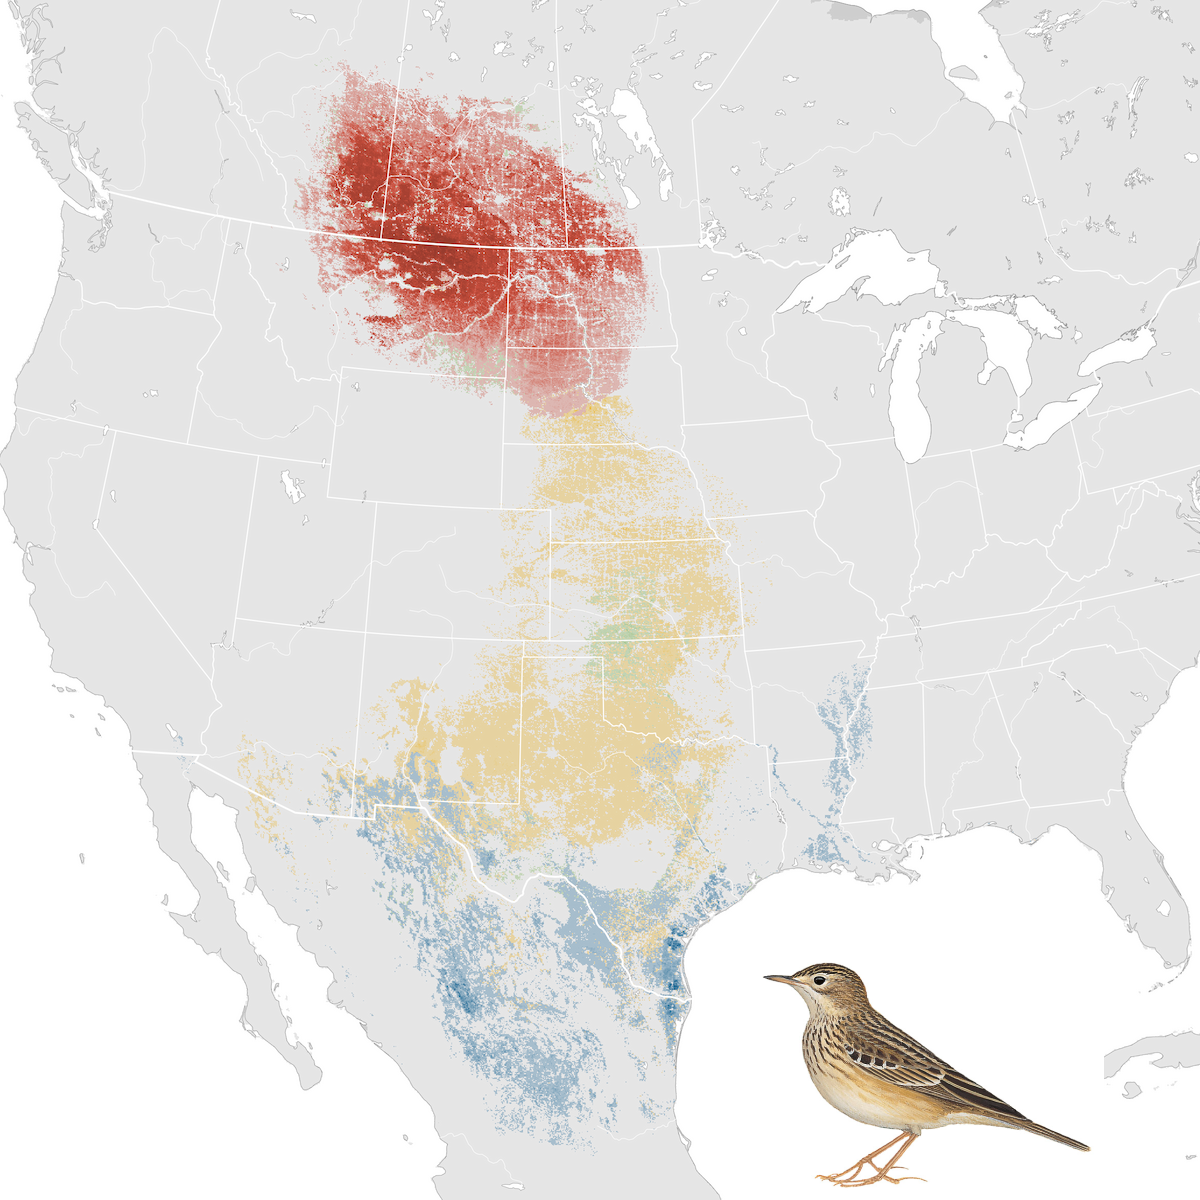
Relative abundance of Sprague’s Pipit is depicted for each season along a color gradient from a light color indicating lower relative abundance to a dark color indicating a higher relative abundance. Relative abundance is the estimated number of individuals detected by an eBirder during a traveling count at the optimal time of day to find the species. The breeding season is shaded in red; the non-breeding season is shaded in blue; and locations where the species is present during the pre-breeding migration are shaded green and post-breeding seasons are shaded in yellow. Sprague’s Pipit illustration © Ren Hathway/Lynx Edicions.
These new Status and Trends data products showcase how your bird sightings can help scientists devise new research questions to improve our understanding of their biology as well as in their conservation.
Boyle and her graduate student, Dylan Smith are putting eBird data to use to study grassland birds. Boyle and Smith noticed that few of the Grasshopper Sparrows they were studying were returning to the same breeding area year after year. Instead these birds were moving upwards of 50 miles between breeding seasons, unlike many other songbirds, which frequently return to the same breeding site year after year. Puzzled by what they were seeing, they used raw eBird data and reviewed eBird’s Status and Trends abundance animations to devise research questions to explain why Grasshopper Sparrows would move so much between breeding seasons. “We are finding that Grasshopper Sparrows don’t always return to the same spot each year, and where they end up breeding appears to be driven by the amount of rainfall in the area from the previous year,” says Boyle.
eBird Status and Trends data products provide limitless opportunities to guide research questions, and also inform on-the-ground conservation and policy decisions. The United States Fish and Wildlife Service turned to eBird Status and Trends abundance estimates to define low risk zones for wind energy development. The U.S. Fish and Wildlife Service needed to better understand where Bald Eagles were most likely to be found throughout the year to reduce potential collision risks from wind energy projects. eBird Status and Trends data products provided the most complete and accurate picture to help them inform policy decisions at the federal level.
eBird at its best
Checklists from 311,692 eBirders were used in the new eBird Status and Trends data products. “eBird is the cool part,” says Fink, “it’s a super effective way to collect data across space and time, that would not be possible any other way.” And for eBirders it’s a feeling of elation. “It’s super awesome to know that my observations are in there,” says Foerster.
As eBirders submit more sightings across the globe, the eBird Science team will be able to model movements, distribution, and abundance patterns of more and more species from more and more regions. Thank you for sharing your sightings with eBird—together we are creating a better understanding of birds around the world.