
Why cycling is good for everything from retail sales to property prices
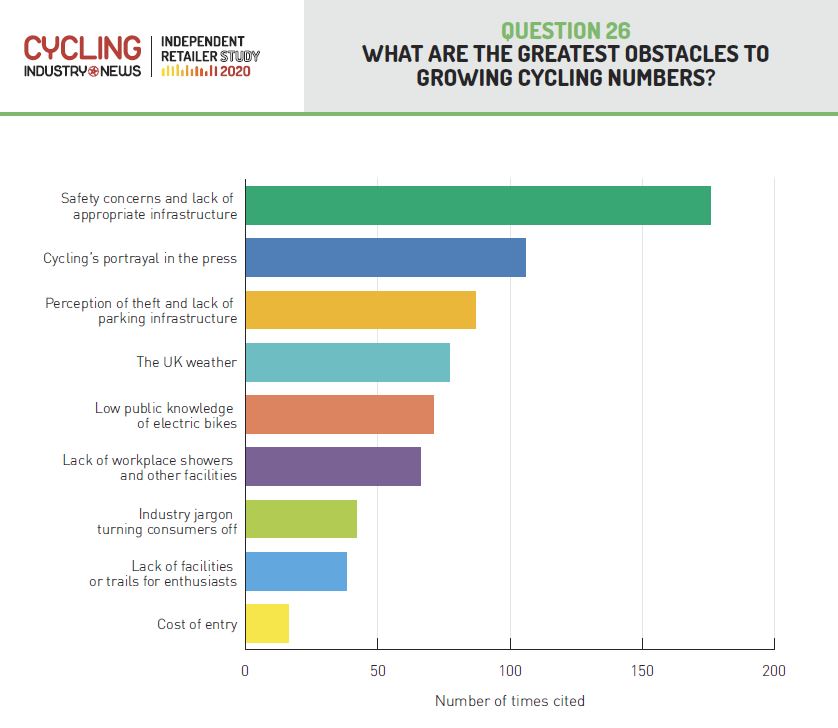
The portrayal of cycling in the press has emerged as something that 48% of bike shops surveyed in CI.N’s annual retail study deem a significant barrier to growing cycling numbers. Then there’s social networks that amplify myths and misunderstandings further; but isn’t it time to put those knee-jerk reactions to bed and talk seriously about cycling as transport form of the future? Here CI.N catalogues and debunks the common complaints with data, research and expertise for those taking an evidence-based approach to future transport discussions…
Before we begin, some context of where we are as a nation.
- Cycling is to receive a £2 billion spend, to be split with spend on improving walking conditions. This budget equates to £400 million per year, to be divided across 343 English local authorities. Some of the spend has already been allocated via the Active Travel Fund, which come with a few hoops to jump through. Further cash from the budget has gone toward the Bike Repair Vouchers scheme, which thus far has only issued 10% of the promised quota.
- For context, the budget to fill potholes is £2.5 billion and the road building budget is £27 billion, 13.5 times higher than that for active travel.
- Progress has been made with a set of national design standards for cycling infrastructure now applicable to England and Northern Ireland. Paint on the road without a protected element will no longer be funded apart from in exceptional circumstances, according to the Government’s announcement. The newly created Active Travel England will oversee many big projects.
- The Walking and Cycling Alliance believe between £6 billion and £8 billion is the figure required over five years to double cycling from its low modal share.
- In 2018, 60% of trips in England measured less than two miles and 80% between two and five were made by car. Reducing this short distance car dependency would vastly reduce congestion for the benefit of all. Congestion costs the UK economy £30 billion a year, while pollution contributes to 40,000 premature deaths annually in the UK.
“Cycle lanes will negatively impact the High Street”
There are a number of documents available from both the Department of Transport and Transport for London that go to great lengths to catalogue the benefits to High Streets when people arrive by means of active travel.
Before we get into the UK’s potential first let’s skip over the pond to Manhattan’s now famous Measuring the Street Report, which tracked the effects of the USA’s first protected cycle lanes on local retailers. In this study of businesses on 9th Avenue to 23rd and 31st street retail sales rose by up to 49% in places with safe infrastructure against a borough wide increase of 3%. This came in tandem with a feeling of safety on the streets for shoppers, who incidentally were involved in 58% less injuries on 9th Avenue.
Where underused parking zones were converted to people friendly spaces an 172% increase in retail sales followed, with 77% more pedestrians seated outside local restaurants. 47% fewer retail vacancies latterly were recorded in one area against a borough wide average of just 2% up.
Overall, a 177% increase in bicycle use was recorded on First and Second Avenues, Manhattan.
But that’s in the USA, the UK is different, you’ll be told. Not according to Transport for London’s “Walking and Cycling: The Economic Benefits” document. Within this report it was found that walking and cycling improvements can very quickly return an increased retail spend of up to 30% where more sociable conditions exist for active travel. What’s more, such conditions allow for up to 5% more people to pass by at peak times. For the business owner, those cycling for transport were found to take 27% fewer sick days.
Where cycle parking exists, the report cites a 2016 Raje and Saffrey study that found that as much as five-fold the retail spend can be achieved per square metre versus car parking, much thanks to the footprint vehicles take up.
With freedom of movement enabled and less hassle finding a place to park, TfL found that people who walk make 16 visits per month and cyclists 12. Those who drove visited just 8 times.
Within the DfT’s Cycling and Walking Strategy document it is noted that the installation of cycle lanes benefit nearby retail footfall by up to 40%. This is based on research carried out by Matthew Carmona of University College London’s Bartlett School of Planning. The findings were drawn by studying areas of London that have been converted to be more akin to Holland than the UK. Where such conditions existed, people were found to linger, increasing their retail activity by as much as 216%.
The knock-on effect of that is a boon for landlords, with retail rental values said to have increased on such streets by 7.5%, while the retailers themselves began to grow in number; vacancies fell by 17%.
The Department for Transport’s own reporting on cycling’s cost to benefit ratio returns an average range of between 5:1 and 19:1 but has hit as high as 35:1 where assessments have been made in Cambridge. These take into account the positive externalities, such as benefits to health, congestion or retail trade.
As a direct result of the cycling industry’s contribution to the economy, The Bicycle Association in 2018 calculated a contribution of £5.4bn, sustaining some 64,000 jobs. At the time it was noted that the tally was around three-fold that of the steel industry’s economic contribution.
Further reading: Study tells real estate developers building for walking and cycling is good for business Cycling and the economy.
“There’s no demand and cycling is a minority activity”
Moving on from the chicken and egg saga that is infrastructure, cycling’s potential is only now coming to be understood as a series of studies are carried out among those who do not yet cycle.
For example, research recently commissioned by Sustrans found that 55% of people from ethnic minority groups who currently do not cycle (74%) would like to start. There are barriers to entry that may not be immediately obvious, notably that 20% stated that cost of a suitable bike was prohibitive, while 33% desired to have some cycle training prior to getting riding.
As a result, Sustrans is keen to address an elephant in the room when it comes to the cycle to work scheme, which could provide discounted bikes to a wider pool of people. That elephant is of course the accessibility of the scheme to those on lower-income jobs, or not in employment.
Further research conducted by YouGov on behalf of cycling industry campaign #BikeIsBest has taken the time to understand the public’s real desire to cycle, even accounting for how the perceive their friends and colleagues feel about cycling for transport.
70% of people believe greater levels of cycling would actually benefit the motorist in terms of reduced congestion.
The data further showed that 3.26 people support the thinking that Britain would be better if more people cycled” for every 1 against. But when asked what they thought the opinion of their friends or the public would be, many respondents drastically overestimated the negativity towards cycling.
The data varies quite dramatically between demographics, with young people believing that Britain would be a better place to live if people felt more comfortable cycling at a rate of 5.1 in agreement to every 1 against. Over 55s, meanwhile tend to support measures to boost walking and cycling at a rate of 4.56 for to 1 against.
“Cyclists and cycling are dangerous”
This perception almost certainly comes from the mainstream press, who down to the rarity of deaths caused by cycling, tend to report them a much greater proportion of the time than a similar incident involving the driver of a car.
Before we get to the KSI data, let’s explore the physics. One tonne of car at 30 miles per hour is, quite plainly, going to pack a greater punch than around 100 kilograms of bike and human flesh traveling at the very average pace of 12mph.
When it comes to collisions involving a cyclist and a pedestrian they really are comparatively rare in the data. During the years 2011-2016 there were 20 pedestrian fatalities in collisions involving only one pedal cycle, representing 1 per cent of pedestrian fatalities overall. In 2016, 3 deaths were adjudged to have been caused by a bicycle colliding with a pedestrian, versus 289 for cars. These levels, as checked by Full Fact, have been broadly consistent for the past five years.
It is, seemingly more dangerous to drive a car than it is to cycle. In 2016 1,792 deaths and 179,592 injuries took place in cars on Britain’s roads. That said, cyclists are among the most vulnerable when two transport forms collide.
According to the Department of Transport’s most recent assessment of the 2016 statistics 102 pedal cyclists were killed in Great Britain, 6% of all deaths, whilst 3,397 were reported to be seriously injured. Gladly, the trend has been falling since the 1980s. In 1984 345 cyclists were killed, but since the year 2000 no year has surpassed 148 deaths. This trend comes despite a steady rise in cycling levels with cyclists recording 3.45 billion miles in 2016 against 2.57 billion miles in both 2000 and 2001.
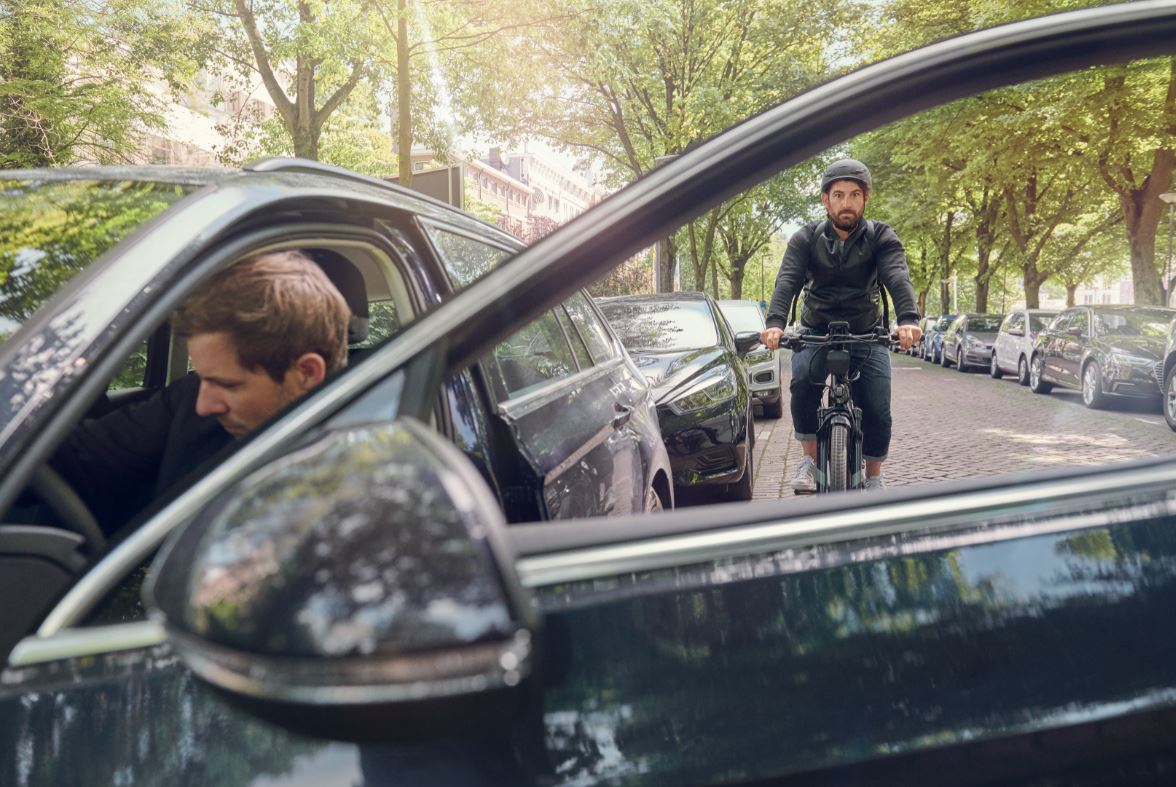
For further context, during the period spanning 2011 to 2016 pedal cyclists saw one KSI for every 1 million miles cycled and one KSI casualty for every 100,000 hours cycled. 92% of all casualties involved one other car, cementing the notion that segregated cycle paths, as promised by the Government, will become crucial to further dropping KSI rates. HGV drivers, it was found, were disproportionately involved in incidents accounting for 23% of fatalities, despite making up just 5% of traffic. This is likely down to the design of cabs, which tend to have significant blind spots.
“Helmets should be mandatory”
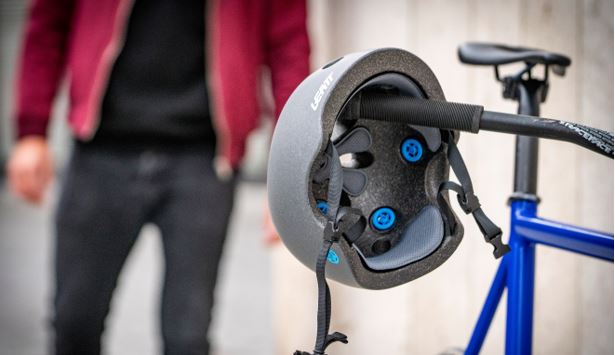 This one stirs up quite some emotion. Helmets are of course very useful in the event of a crash, for example when hitting a pothole. There is a misconception, though that they’re designed to save lives when collisions with a speed hunk of metal impacts a cyclist. While they may help somewhat, no cycling helmet is designed to withstand such forces, as explained by Giro Cycling’s Eric Richter in issue three of our Trade Journal earlier this year. Quite simply, the strength and variety of forces that can occur in crashes with large speeding vehicles are too diverse to plan against and the physics simply will never lend themselves to the level of meaningful protection in these instances.
So, the helmet compulsion argument is very often a can of worms based on some assumptions that are not always correct. We should clarify that CI.N very much recommends a helmet, but compulsion is a different matter and, where deployed, has had very negative consequences to cycling levels.
That was best demonstrated in Australia where fines are readily available in some territories for declining to wear a helmet and cycling levels dropped in tandem with the creation of helmet compulsion laws. One New South Wales study taken back in 1993 found that while helmet uptake had risen with laws compelling it, 30% less children rode to school after legislation was introduced.
Further east, New Zealand’s helmet compulsory cycling helmet laws came into force in 1994, bicycle trips fell by 51% between records taken between 1989 and 2006.
Helmet laws, then, are only useful if the objective is to reduce cycling and return people to cars.
“Cyclists should pay road tax and have a licence plate”
A classic that you’ll find in any article comment section or public meeting that discusses cycling on the roads, this is the stick used to beat cyclists with, despite the fact it is inherently flawed.
It is worth remembering that 80% of cyclists are also said to drive, it is in fact rare for a person to use just one mode of transport. Therefore, it’s highly likely that rider will be paying many of the taxes that motorists pay, even though if they choose cycling they’ll be doing far less damage to the road surface, emitting less in pollution terms and are in theory decongesting by taking a smaller vehicle.
“Road tax” is a term that really shouldn’t exist, but that has become an easy reference for the mouthful that is Vehicle Excise Duty. Road tax did exist, now well over 100 years ago when it was introduced as the Road Fund within a 1909/10 Finance Act. With this cash no new roads were financed.
Skip to 1937 and Winston Churchill abolished the Road Fund, at which point motorists themselves stopped any direct contribution to the roads, except through their contributions to local and general taxation; that’s things like council tax, VAT and income tax.
Though the fine detail has shifted over time, the taxation stick used to beat cyclists is rather non-sensical all the same. Certain low emissions cars get away with zero contribution after an initial payment under current rules. Cycling, as a non-polluting transport form, would be entitled to the same luxury of a bill of £0, if the rules on motoring were applied.
On the topic of licence plates, the Government’s own stance (found at section G, 6.43 in the CWIS strategy document) has is one of considered balance, noting that the cost and complexity of introducing such a system “would outweigh the benefits”.
“The introduction of a registration and licensing system would deter people from cycling and so significantly reduce the benefits, especially over the short-term. The safety case for a testing/licensing system for cyclists is not as strong as that for drivers since, by contrast with motor vehicles, bicycles involved in collisions on the highway are far less likely to cause serious injury to other road users,” says the DfT document.
The case for less polluting and smaller vehicles
 An analogy you may have seen on these very pages before is “If the city is your funnel, fill it with marbles and sand and see which flows through quicker.” That school of thought can be applied to traffic management and it is the reason why images depicting how many bicycles can fit in to one car’s footprint tend to go viral quite often. To our knowledge, the best is 42 folded Bromptons, all in the space of one parked car.
By that logic, it has to be acknowledged that the electric scooter is bound to have a place in the future of city mobility at less than half the footprint of a standard bicycle. At the present time, however, only those vehicles operated by share schemes are legal for use on public land. This is widely expected to change in 2021.
As with Ford buying into bike share, car makers are similarly buying in to micromobility in all its new shapes and sizes. Among those making micro electric cars for the city are Seat, Renault and Citroen, with China and Japan already well acquainted with the concept of single seater vehicles. It is, arguably, an acknowledgement that peak car has been reached and that the bicycle business may soon have some well-financed competition looking to have our cake and eat it too.
The bicycle is arguably, a more convenient solution and has been demonstrated to be quite brilliant in pulling down pollution readings when safe conditions to cycle are prioritised. This is best illustrated by the annual closed roads RideLondon event that winds its way to a finish in the capital. With each event levels of Oxides of Nitrogen (ug m-3 as NO2), Nitric Oxide (ug m-3) and Nitrogen Dioxide (ug m-3) plummet in the air.
Air pollution is believed to be a contributing factor in some 9,000 deaths, in the UK capital alone, annually.
Build it and they will come
As it stands, it is unanimously agreed that feeling of insecurity on the road is the primary reason for people choosing not to cycle. In a Transport Research Laboratory study conducted in 2001, 62% of adults said they do not cycle as they feel it too dangerous.
Much more recently, #BikeIsBest data revealed that 51% of people would cycle more, if protected cycle lanes were abundant. For every person against seeing protected cycle lanes laid there are 6.5 people who are in favour, showing that public mood toward cycling is not as dire as some social media sites and newspapers would have you believe.
Successful designs such as Blackfriars Bridge, London have been flagged in recent news. Here separation on the road saw cycling traffic rise 55% post installation. What’s more, it was found that East-West and North-South cycle routes in London were moving 46% of the people in only 30% of the road space, illustrating how useful smaller mobility can be at handling city volume.
Another interesting study on the correlation between safe lanes and upped modal share comes from the Simon Fraser University in the USA, as published in the International Journal of Behavioural Nutrition and Physical Activity.
Having developed a ‘bike score’ system, similar to the widely used ‘walk score‘ tool used in North America, Meghan Winters and her colleagues found that for every ten-unit increase in bike score, those commuting by bicycle went up by half a percent. The scoring system analyses bike lane topography, connectivity and availability on a scale of 1 to 100. The assessment pulled data from 24 North American cities to reach its conclusion.
How can we understand what and where to build for active travel?
For the local authority who will be assessing a budget and looking to spend cash effectively, this is absolutely key. Understanding where to build infrastructure and who will likely use it has historically been a dark art reserved only for consultants like David Hembrow, a noted English cycling advocate who, with A View from the Cycle Path (that’s his excellent blog, FYI) in Assen, Holland, has carved out a niche for advising how to build effective infrastructure.
That knowledge is invaluable, of course, but nowadays we live in a data-driven age where all things ‘smart’ can provide the facts to back the anecdote. Increasingly, wherever the cyclist has a GPS device either fitted or in their pocket, it has been possible to use heat mapping to discover where they have been, all with personal data anonymised.
Strava Metro is one such service and Irene and Phillip Mcaleese of See.Sense’s data mapping service another. Both of these services have been deployed to help city and transport planners understand why cyclists have chosen a route and, better still, whether a better route could be put in place to shorten and thus stimulate further journeys by bike.
In the case of See Sense’s technology, bikes equipped are even able to deliver accelerometer data that alludes to collisions and near miss hotspots, speed carried on a stretch, dwell times that could be useful insight for retail visits, as well as the intricate detail of the surface cycled on. What’s more, once routes are provided, local authorities can then monitor their success over time.
An added perk of cycle routes being built is the finding that residential property prices rise by 1% when local motor traffic is reduced by 50%, according to a report commissioned by the Department for Transport. This as it turns out could be a fresh talking point for the now hotly-contested Low Traffic Neighbourhood schemes.
“You can’t carry anything on a bike, you can only deliver with vans”
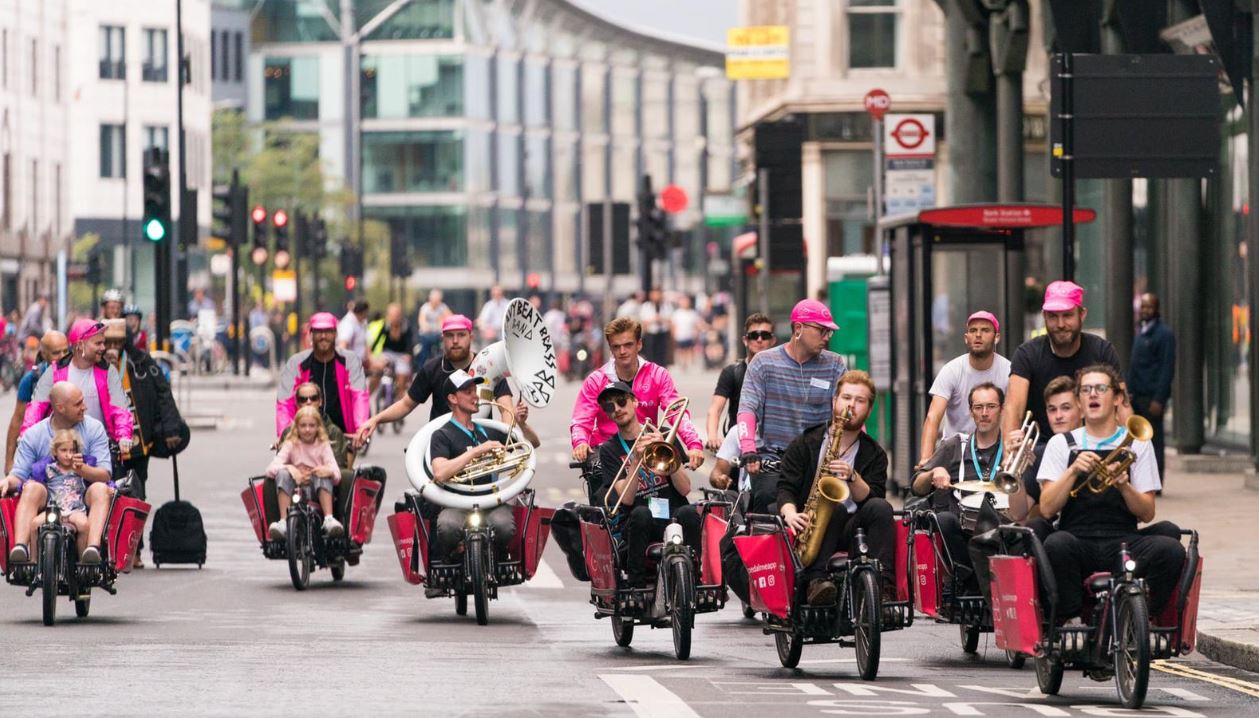 Tell that to Pedal Me, which on the same day Prime Minister Boris Johnson was quoted as saying “Of course you can’t deliver a fridge-freezer on a cargo bike” proceeded to deliver a fridge by cargo bike. “Fridge freezers, good for a bit of drama,” joked PedalMe, when asked about the heaviest load they’d carried, which for the record is a whopping 300kg.
That’s not totally unheard of elsewhere, either. “A Carla Cargo trailer is rated at 150kgs payload; a Tern GSD S10 is rated at 180kgs including the rider; and so on,” explains Richard Armitage of the European Cycle Logistics Federation and Cyclelogistics.
“The discussion must not be about the fatuous: how are we going to shift a 100t metal bridge by cargo bike,” he says in response to the silly quips that are sometimes banded at cycling advocates. “The key target is to replace 50% of all LCVs (light commercial vans – i.e. 3.5t and below) with cargo bikes across Europe by 2030. This is based on solid research to do with what is carried in those vans (by volume, by weight) and over what distance.”
In reality the average London van is only 38% full, according to research by the Urban Transport Group in its White Van Cities paper. With that in mind, a further study from the Bicycle Association on the topic of cargo bikes concluded that in supermarket trials of cargo bike delivery, 97% of orders could be deliverable by pedal power. With the rise and rise of online retail, paired with increasingly generous returns policies, van use is likewise growing exponentially, adding to traffic issues; in fact it is now the fastest growth segment of all transport. In a bid to counter this issue, the Government’s scientific advisers to the DfT are now recommending a ‘plastic bag’ style tax on all consumer deliveries from larger retailers due to a significant trend of ‘over ordering’.
Worse than clogging up the roads, a study of van usage has found worse problems associated to a van’s disproportionate use of space.
“The amount of walking that a ‘parcel delivery’ van driver does in a city is surprising: Early in the project pre-GDPR, we were tracking vehicles and rounds for delivery, blending routes, taken to look at the drivers daily role, working with 18 parcel carriers in one day in London, van stopping about 38 times, driving seven km, driver walking ten kms, the van is stationary for 68% of the time, the van asset sat at the roadside,” Tom Cherrett, Professor of Logistics, University of Southampton told a conference on logistics.
With his oversight, Armitage informs us that the CEN TC 333 WG9 cargo bikes standards committee is probably going to limit the first standard they produce to a maximum of 300kgs. For context, that’s around three smaller fridge freezers in weight.
While the carriage limit discussion is one point of interest, what’ll prick more ears is the notion that businesses can save time and money in the vast majority of instances. One European research project spanning 20 cities and 40 businesses found that the majority of those public and private sector companies involved in the experiment opted to retain their e-bike delivery fleet, with some participants completely restructuring their logistics following trials.
In the Pro E-Bike study it was discovered that for short distance small load transfers cargo bikes are overwhelmingly more efficient over motor transport. The MOBI research group at Brussels University suggests that this is applicable to around 68% of trips in cities, something that could drastically alter the workings of inner-city life for citizens and businesses.
The Health benefits of cycling
Truth be told, this one is another article in itself, but just as we were sending this magazine to print a great piece of analysis of British Census data from the National Institute for Health Research came on to our radar. The findings revealed that, those cycling to work were 20% less at risk of premature death, 24% less likely to have cardiovascular complications and 16% less likely to develop cancer than the motorist commuter. 300,000 people were surveyed between 1991 to 2011 as part of the study.