A reader asks:
As a long term investor (10-20 year horizon) is it worth selling portions of a stock when it’s up and taking some profits, maybe reinvesting when the price goes down or pocketing the money? Or, is it best to stay “all in” regardless of the ups and downs?
There are two different ways to think about this question.
One is the Charlie Munger approach. Buffett’s righthand man once stated, “If you’re not willing to react with equanimity to a market price decline of 50% two or three times a century, you deserve the mediocre result you’re going to get compared to the people who do have the temperament.”
Munger and Buffett are generally buy and hold forever investors in stocks but they also take concentrated positions. If you’re going to buy and hold forever you just have to get used to losses because there is no avoiding downturns in the stock market.
Losses are what you sign up for on day one in the markets. There is no reward without some risk. Suck it up and hold.
This is one way to think about investing.
Another way to think about this is those losses mean the market is always and forever cyclical.
Howard Marks once wrote, “In the world of investing nothing is as dependable as cycles. Fundamentals, psychology, prices and returns will rise and fall, presenting opportunities to make mistakes or to profit from the mistakes of others. They are givens.”
Rebalancing can help investors take advantage of these cycles.
I believe diversification and asset allocation are two of the most important building blocks for any long-term investment plan. And if you diversify broadly in an asset allocation that matches your risk profile and time horizon, why wouldn’t you rebalance back to those target weights on occasion?
Rebalancing is a form of risk management.
If done systematically, rebalancing provides automated contrarian behavior by selling some of what has worked and buying what hasn’t. It’s a bet on regression to the mean since nothing grows to the sky.
The tough part about regression to the mean is you can’t set your smartphone to it since there is no pre-set schedule for market cycles.
For example, I pulled the 10 best years for the U.S. stock market going back to 1926 to see what the returns looked like in the years before and after those big gains:
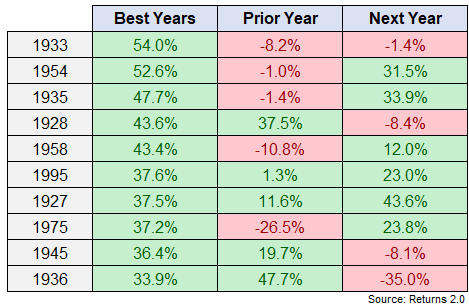
Sometimes the best years followed big down years (1958 & 1975). Sometimes big up years were followed by down years (1928, 1933, 1936 & 1945). And sometimes big up years were followed by big up years (1927, 1935, 1954, 1958, 1975 & 1995).
Investing would be easier if markets followed a set pattern but that’s not how things work. Humans are unpredictable so the stock market is as well.
The same is true if you look at the worst years in stock market history:
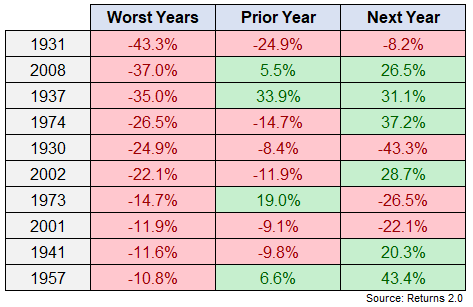
Sometimes the worst years followed big gains (1937 & 1973). Sometimes the worst years were followed by wonderful years (1937, 1941, 1957, 1974, 2002 & 2008). But sometimes the worst years were followed by even more pain (1930, 1931, 1973 & 2001).
It’s no fun that stocks are down 15-25% this year (depending on the index). But can you imagine seeing stocks down 20% this year and down an additional 20% next year?!
This is a rare occurrence but not out of the realm of possibilities.
Some cycles take longer than others to play out.
So what does this mean for rebalancing?
If you wait a little longer to rebalance, say 1-2 years, there are times when you’re sure to miss the turning point in the cycle and fail to buy certain assets on the cheap. Alternatively, there will be times when being more patient in your rebalancing schedule will pay off, as is the case in a strong bull market.
And if you rebalance more periodically, say every quarter or semi-annually, there are times when you’ll be selling top early and times when you will be taking advantage of downturns that don’t last as long.
Another option would be to place certain bands on your asset allocation targets and only rebalance when your weights get too far out of whack.1
I could run a bunch of backtests and simulations for you on each of these strategies but the numbers will be highly dependent on the cycle. It’s like horseshoes and hand grenades — close is good enough.
The most important thing you can do when setting a rebalancing strategy is to create a plan you can follow without hesitation.
Perfect is the enemy of good when implementing this kind of thing.
We discussed this question on this week’s Portfolio Rescue:
Bill Sweet joined me again to answer questions about real estate vs. inflation, dollar cost averaging vs. lump sum investing, taking RMDs from an IRA and backdoor Roth IRA conversions.
Here’s the podcast version of this week’s show:
1For example, let’s say you have a 50% weight in your portfolio to U.S. stocks. You could buy or sell every time that weight gets to 45% or 55%. Or 40% and 50%. Something like that.
