Markets
Visualizing the State of Global Debt, by Country
View the expanded version of this infographic to see all countries.
View the expanded version of this infographic to see all countries.


Visualizing the State of Global Debt, by Country
Since COVID-19 started its spread around the world in 2020, the global economy has been put to the test with supply chain disruptions, price volatility for commodities, challenges in the job market, and declining income from tourism. The World Bank has estimated that almost 97 million people have been pushed into extreme poverty as a result of the pandemic.
In order to help with this difficult situation, global governments have had to increase their expenditures to deal with higher healthcare costs, unemployment, food insecurity, and to help businesses to survive. Countries have taken on new debt to provide financial support for these measures, which has resulted in the highest global debt levels in half a century.
To analyze the extent of global debt, we’ve compiled debt-to-GDP data by country from the most recent World Economic Outlook report by the IMF.
Global Debt by Country: The Top 10 Most Indebted Nations
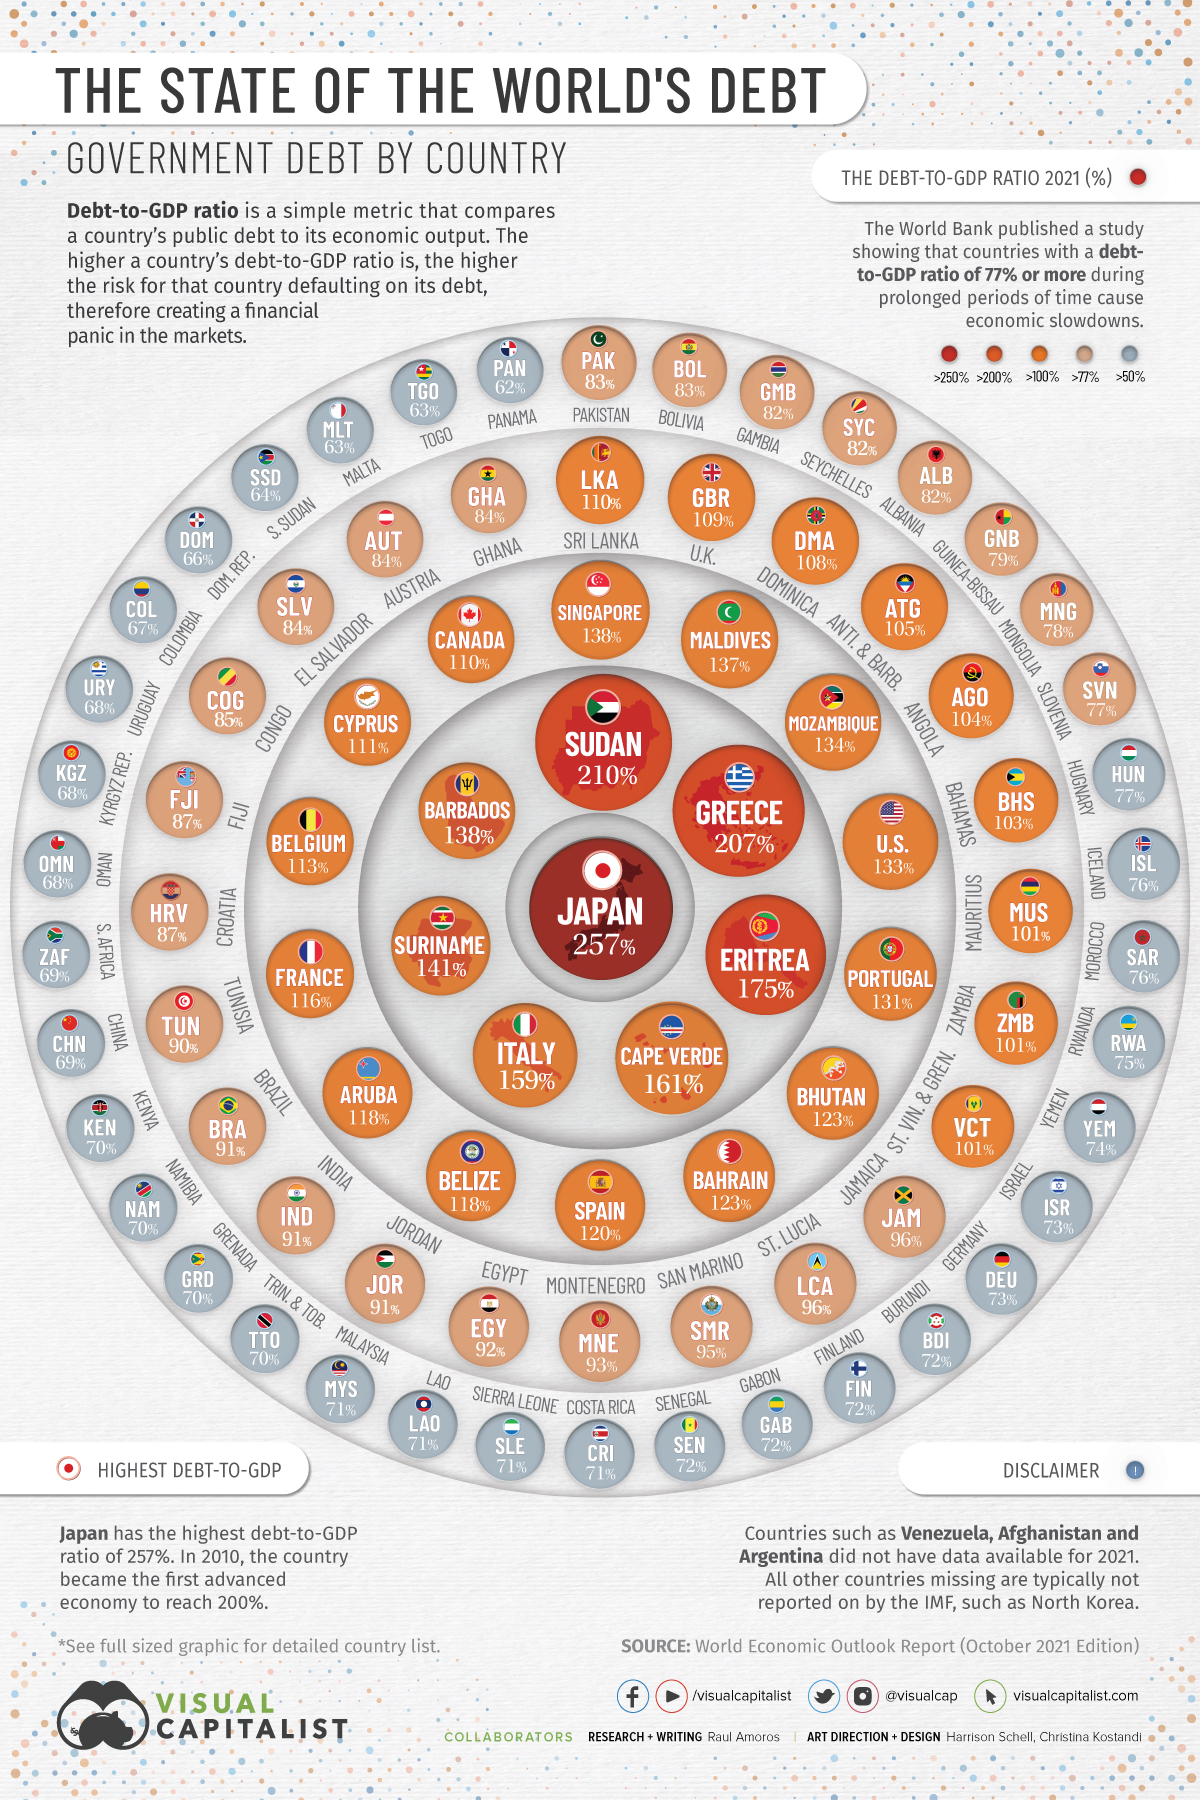
The debt-to-GDP ratio is a simple metric that compares a country’s public debt to its economic output. By comparing how much a country owes and how much it produces in a year, economists can measure a country’s theoretical ability to pay off its debt.
Let’s take a look at the top 10 countries in terms of debt-to-GDP:
| Rank | Country | Debt-to-GDP (2021) |
|---|---|---|
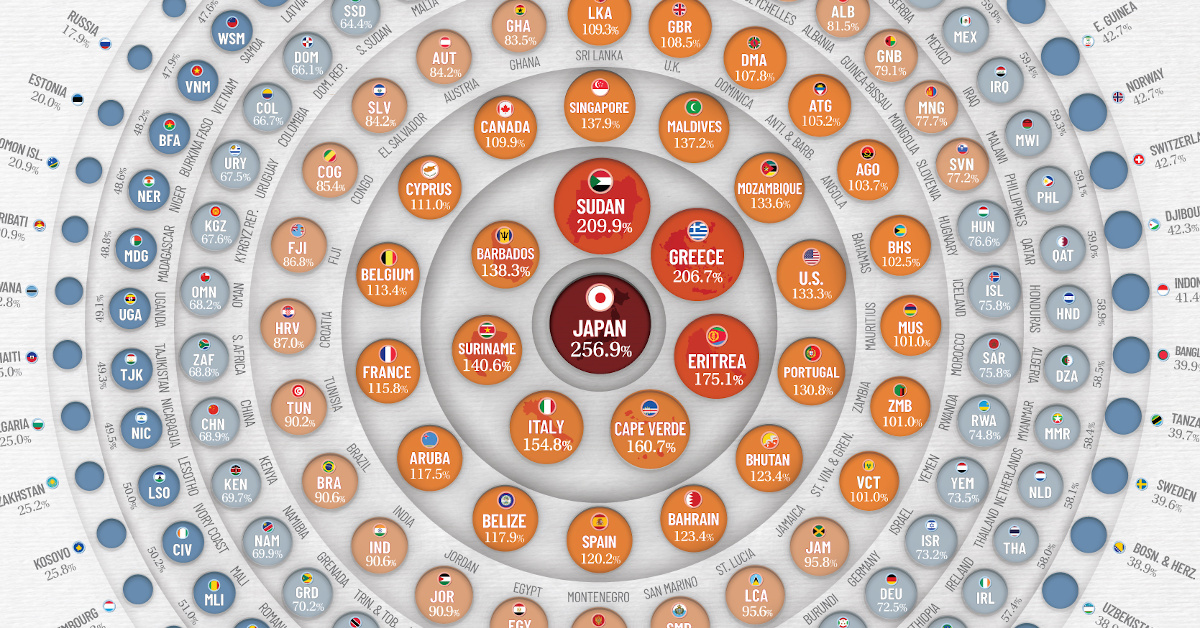
| #1 | Japan 🇯🇵 | 257% |
| #2 | Sudan 🇸🇩 | 210% |
| #3 | Greece 🇬🇷 | 207% |
| #4 | Eritrea 🇪🇷 | 175% |
| #5 | Cape Verde 🇨🇻 | 161% |
| #6 | Italy 🇮🇹 | 155% |
| #7 | Suriname 🇸🇷 | 141% |
| #8 | Barbados 🇧🇧 | 138% |
| #9 | Singapore 🇸🇬 | 138% |
| #10 | Maldives 🇲🇻 | 137% |
Source: World Economic Outlook Report (October 2021 Edition)
Japan, Sudan, and Greece top the list with debt-to-GDP ratios well above 200%, followed by Eritrea (175%), Cape Verde (160%), and Italy (154%).
Japan’s debt level won’t come as a surprise to most. In 2010, it became the first country to reach a debt-to-GDP ratio 200%, and it now sits at 257%. In order to finance new debt, the Japanese government issues bonds which get bought up primarily by the Bank of Japan.
By the end of 2020, the Bank of Japan owned 45% of government debt outstanding.
What is the main risk of a high debt-to-GDP ratio?
A rapid increase in government debt is a major cause for concern. Generally, the higher a country’s debt-to-GDP ratio is, the higher chance that country could default on its debt, therefore creating a financial panic in the markets.
The World Bank published a study showing that countries that maintained a debt-to-GDP ratio of over 77% for prolonged periods of time experienced economic slowdowns.
COVID-19 has worsened a debt crisis that has been brewing since the 2008 global recession. A report from the International Monetary Fund (IMF) shows that at least 100 countries will have to reduce expenditures on health, education, and social protection. Also, 30 countries in the developing world have high levels of debt distress, meaning they’re experiencing great difficulties in servicing their debt.
This crisis is hitting poor and middle-income countries harder than rich countries. Wealthier countries are borrowing to launch fiscal stimulus packages while low and middle income countries cannot afford such measures, potentially resulting in wider global inequality.
The IMF Warns of Interest Rates
Global debt reached $226 trillion by the end of 2020, seeing the biggest one-year increase since World War II.
Borrowing by governments accounted for slightly over half of the $28 trillion increase, bringing global public debt ratio to a record of 99% of GDP. As interest rates rise, IMF officials warn that higher interest rates will diminish the impact of fiscal spending, and cause debt sustainability concerns to intensify. “The risks will be magnified if global interest rates rise faster than expected and growth falters,” the officials wrote.
“A significant tightening of financial conditions would heighten the pressure on the most highly indebted governments, households, and firms. If the public and private sectors are forced to deleverage simultaneously, growth prospects will suffer.”
Editor’s note: All data used in our visualization was extracted from the World Economic Outlook Report (October 2021 Edition) and The World Bank. We will update this data when the new report is available in April 2022.


Economy
The Most Valuable Companies in Major EU Economies
From semiconductor equipment manufacturers to supercar makers, the EU’s most valuable companies run the gamut of industries.
Most Valuable Companies in the EU, by Country
This was originally posted on our Voronoi app. Download the app for free on iOS or Android and discover incredible data-driven charts from a variety of trusted sources.
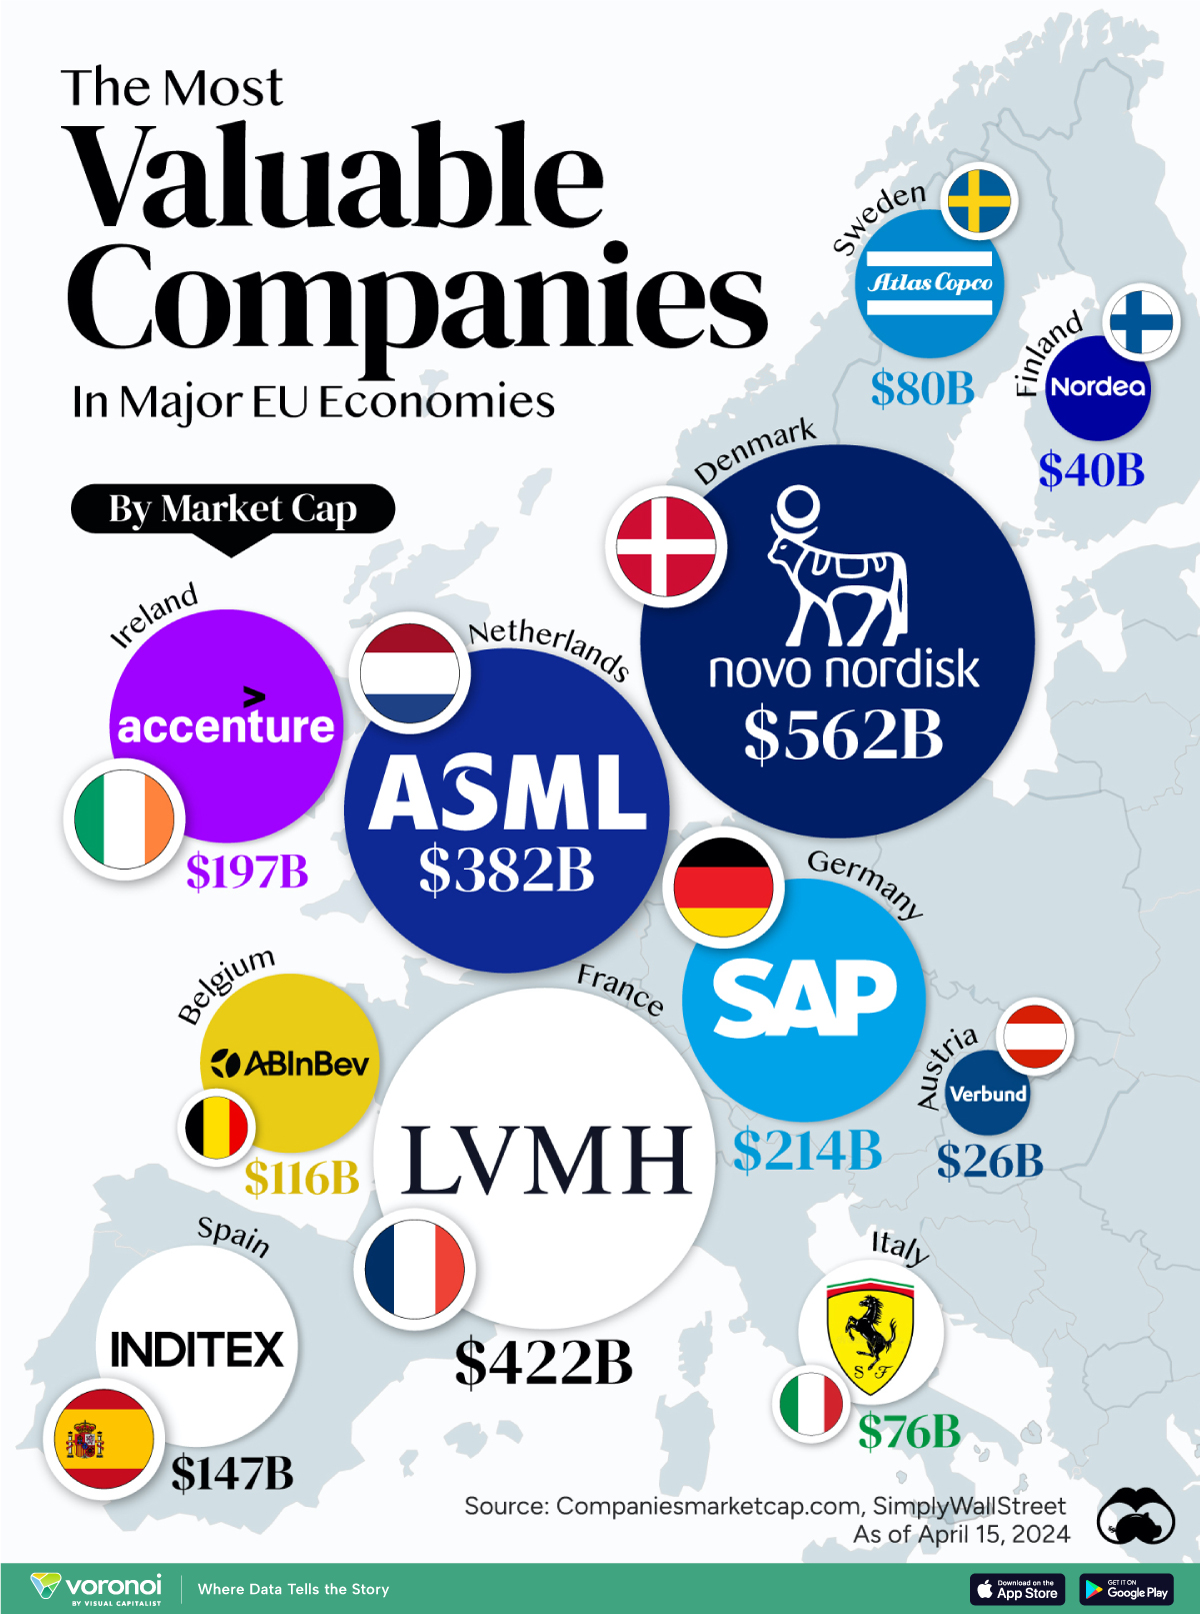
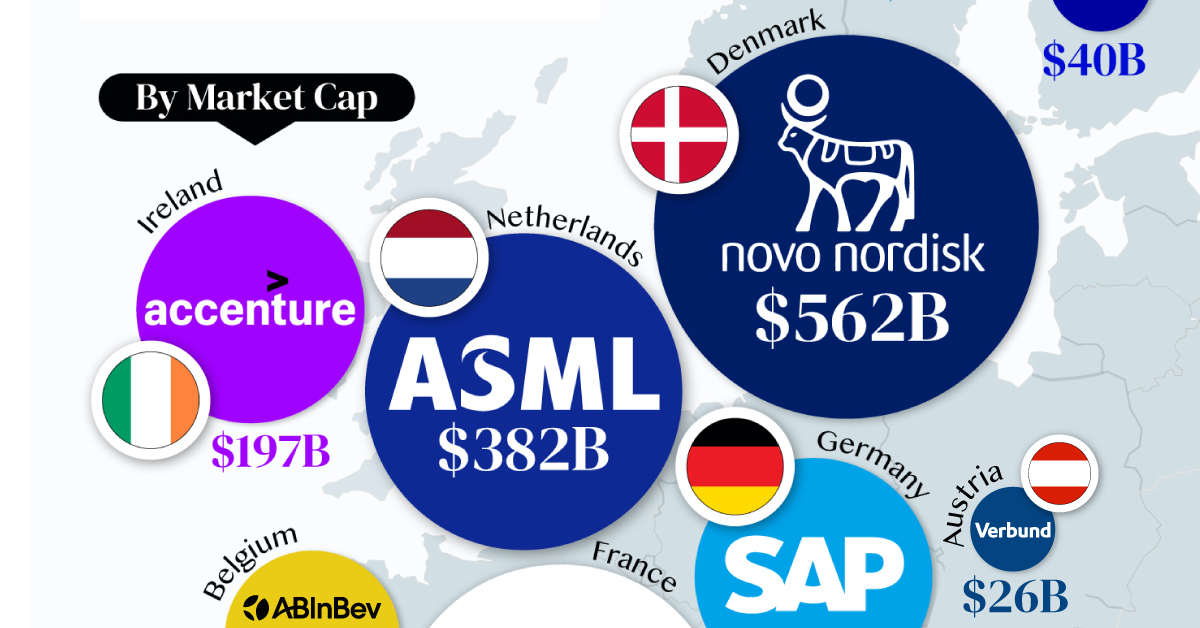
In this graphic, we mapped out the most valuable corporations in 11 major EU economies, based on their market capitalizations as of April 15th, 2024. All figures are in USD, and were sourced from Companiesmarketcap.com.
Novo Nordisk is currently worth more than $550 billion, making it Europe’s most valuable company by a wide margin. The pharmaceutical giant specializes in diabetes and weight-loss drugs. Demand for two of them, Ozempic and Wegovy, has surged due to their weight-loss capabilities, even causing nationwide shortages in the United States.
The following table includes an expanded list of the most valuable publicly-traded company in larger EU economies. Many of these were not included in the graphic due to space limitations.
| Country | Company | Sector | Market Cap |
|---|---|---|---|
| 🇩🇰 Denmark | 💊 Novo Nordisk | Pharmaceuticals | $562B |
| 🇫🇷 France | 👜 LVMH | Luxury Goods | $422B |
| 🇳🇱 Netherlands | 🔧 ASML | Semiconductor Equipment | $382B |
| 🇩🇪 Germany | 💼 SAP | Enterprise Software | $214B |
| 🇮🇪 Ireland | 🖥️ Accenture | IT Services | $197B |
| 🇪🇸 Spain | 👗 Inditex | Retail | $147B |
| 🇧🇪 Belgium | 🍻 Anheuser-Busch InBev | Beverages | $116B |
| 🇸🇪 Sweden | 🛠️ Atlas Copco | Industrial Equipment | $80B |
| 🇮🇹 Italy | 🏎️ Ferrari | Automotive | $76B |
| 🇫🇮 Finland | 🏦 Nordea Bank | Banking | $40B |
| 🇦🇹 Austria | 🔌 Verbund AG | Energy | $26B |
| 🇱🇺 Luxembourg | 🏗️ Tenaris | Oil & Gas Equipment | $22B |
| 🇨🇿 Czech Republic | 💡 CEZ Group | Energy | $20B |
| 🇵🇱 Poland | ⛽ PKN Orlen | Energy | $20B |
| 🇵🇹 Portugal | 🔌 EDP Group | Energy | $16B |
| 🇬🇷 Greece | 🏦 Eurobank | Banking | $7B |
| 🇭🇺 Hungary | ⛽ MOL Group | Energy | $7B |
| 🇭🇷 Croatia | 🏦 Zagrebacka Banka | Banking | $6B |
| 🇷🇴 Romania | ⛽ Romgaz | Energy | $4B |
| 🇸🇮 Slovenia | 💊 Krka | Pharmaceuticals | $4B |
Note: Figures are rounded and last updated on April 15th, 2024. Countries with top publicly-traded companies worth under $4 billion are excluded.
Luxury supergiant LVMH—which owns brands like Tiffany, Christian Dior, and TAG Heuer to name a few—is Europe’s second largest company by market cap, at $420 billion.
Rounding out the top three is ASML, which produces equipment crucial to chip manufacturers, worth $380 billion.
When looking at the region, there is a vast disparity between EU member states and their most valuable companies.
For example, as mentioned earlier, Denmark’s Novo Nordisk and France’s LVMH are worth between $400-550 billion each. Meanwhile, some countries don’t even have a single publicly-listed company that is worth over $1 billion.
In fact, only 12 EU countries (less than half of the union) are home to the top 100 most valuable companies within the bloc. An additional four countries are represented if you look at the list of the top 200 companies.

-

 Wealth6 days ago
Charted: Which City Has the Most Billionaires in 2024?
-

 Mining2 weeks ago
Gold vs. S&P 500: Which Has Grown More Over Five Years?
-

 Uranium2 weeks ago
The World’s Biggest Nuclear Energy Producers
-

 Education2 weeks ago
How Hard Is It to Get Into an Ivy League School?
-

 Debt2 weeks ago
How Debt-to-GDP Ratios Have Changed Since 2000
-

 Sports2 weeks ago
The Highest Earning Athletes in Seven Professional Sports
-

 Science2 weeks ago
Visualizing the Average Lifespans of Mammals
-

 Brands1 week ago
How Tech Logos Have Evolved Over Time