2020 by the Numbers: Stats That Defined a Strange Season
The shortest, strangest season in baseball history is complete. That is itself a major accomplishment.
The season almost never began because of bickering between MLB and the players association over salaries. Remember “Tell us where and when”? Even when commissioner Rob Manfred decided on a 60-game season, some critics argued baseball foolishly was putting profits ahead of public health. Early-season COVID-19 outbreaks among the Marlins and Cardinals renewed angst about playing.
But thanks to rigorous, science-based protocols among teams and admirable discipline from players, baseball pulled off a successful season. All but two of 900 games were played, even though baseball built in more travel than the other pro sports.
The sport leveraged the short season and pandemic protocols to experiment with change: 28-man rosters, the DH in the NL, a runner at second base to start extra innings and 16 teams in the postseason. All experiments worked well given the circumstances, though some tweaks are in order if they should stick around.
Expanded playoffs work as an incentive for middling teams, which answers the players’ complaint that not enough teams are trying to win. If expanded playoffs are to continue in a 162-game season, MLB and the PA will probably reduce the field and give more reward to the one or two best division winners. Rosters should go back to 26, with 28 allowed for September. And if the extra-inning rule remains, it should be amended to start with a reset of the batting order for each team. (The ninth-place hitter is placed at second; leadoff hitter leads off.) Let’s see the best hitters from each team decide the game.
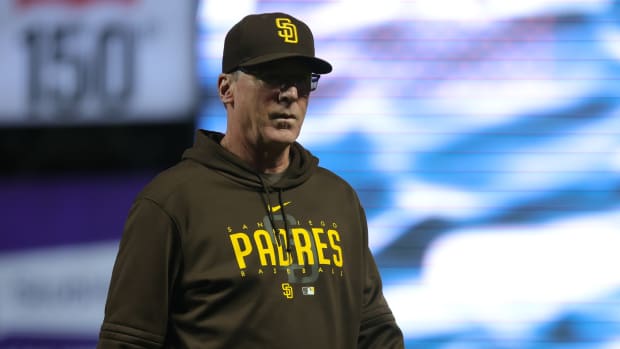
Jamie Schwaberow/Sports Illustrated
It wasn’t all good news. The pandemic protocols pushed aside talk of the game’s longstanding pace of action problem. And hitters had a difficult time as they saw more breaking pitches and more pitchers per game. Here are some snapshots of a weird and wild season.
• Thirty-six percent of all plate appearances ended with a walk, strikeout or home run–the so-called three true outcomes, in which the ball is not put in play. Ten years ago, it was 29%. In that same period, the average time of a nine-inning game increased from 2:50 to 3:07, an all-time record. This trend remains the greatest threat to baseball’s popularity, and it is the antithesis of every entertainment business model in today’s competitive culture: giving people less action over a longer period of time.
• The shaving away of subtleties and strategy continued in a power-hungry game. Triples, singles, sacrifice hits, sacrifice flies and intentional walks all sunk to all-time per-game lows. Batting average dropped to the lowest level in the DH era (since 1973).
• The strikeout rate hit another all-time high, surpassing one per inning for the first time (9.1 per nine innings).
• Thanks to shifts and more hitters lifting the ball in the air, batting average on balls in play fell to its lowest level since 1992 (.292).
• Hit by pitches per game reached the highest rate since 1900, thanks mostly to the proliferation of elbow armor.
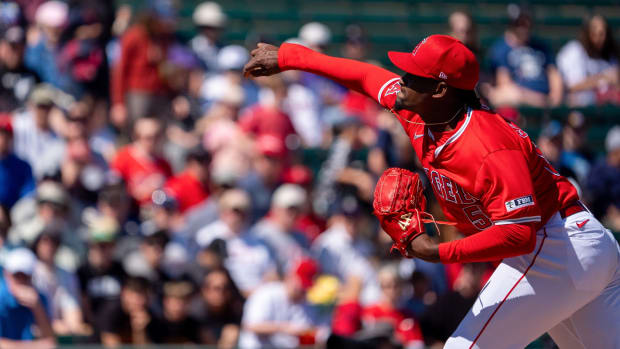
• Somehow a short season and expanded field still were not enough to get Mike Trout in the postseason. Twenty-seven of the 30 teams have made the postseason in the past six years. The only teams left on the outside have been the Angels, Mariners and Phillies.
• Forget what you knew as a kid about winning baseball, Part 1: Three teams played the entire schedule without a sacrifice hit. All of them made the postseason: Brewers, Rays and Reds.
• Part 2: The best team in the AL struck out the most (Tampa Bay hitters). Further, all five teams that struck out the most all made the postseason (Rays, Brewers, Braves, White Sox and Cubs).
• Part 3: If batting average is devalued, why do people still talk about batting with runners in scoring position as if it’s some truth-teller about who wins? Sometimes outs (moving a runner, sacrifice fly) are effective. And the game pivots now on power, not rallies. The Tigers and Phillies ranked 3–4 in batting with runners in scoring position. So what?
• Indians catchers hit .132, replacing the 2015 Mariners (.159) as the worst-hitting backstops ever. MLB catchers hit .232, one of the three worst such averages in the 101 seasons of the live ball era.
• The Twins did not attempt a steal of third base all year.
• The top eight home-run-hitting teams all made the playoffs. Of eight teams with the most stolen base teams, five missed the playoffs.
• The name of the game when it comes to pitching is defending the home run. That’s why pitches per plate appearance hit an all-time high (3.96). It’s why the number of full-count pitches per game has increased 14% in five years. And it’s why on those full counts this year pitchers threw a fastball only 55% of the time. Five years ago, it was 63%.
• The Astros had four wins this year against winning teams (and 13 losses)–and made the playoffs.
• Several great hitters never got untracked. Among those with surprising drops in OPS were Christian Yelich (-.314), José Altuve (-.273), J.D. Martinez (-.259), Kris Bryant (-.259), Javier Báez (-.248), Cody Bellinger (-.246), Carlos Correa (-.217), Pete Alonso (-.124), and Francisco Lindor (-.104).
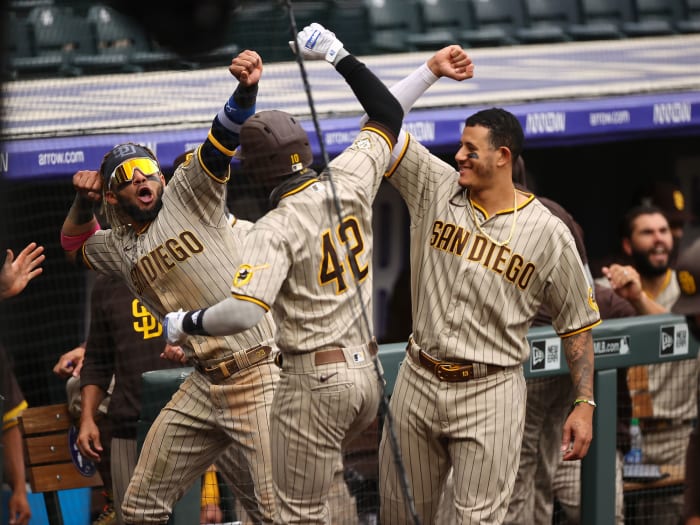
Brad Mangin/Sports Illustrated
• Mark Canha of Oakland hit .057 on breaking pitches (3-for-53). He hit .331 against fastballs.
• Devin Williams of Milwaukee threw 227 changeups. He gave up two hits on those changeups while ending 62 at bats, a .032 batting average.
• Shane Bieber of Cleveland threw 469 breaking pitches. Batters managed a hit against them only 13 times, hitting .107 against his sliders and curves.
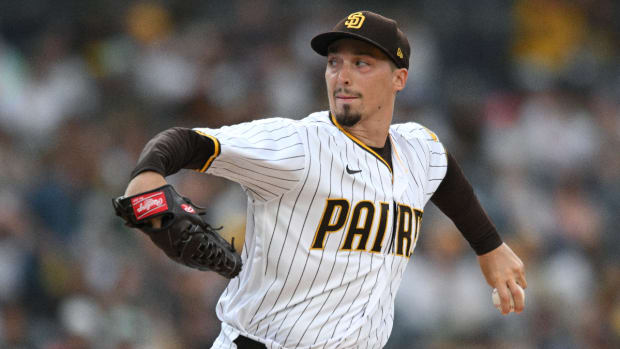
• Three of the four teams with the lowest average four-seam velocity made the playoffs: the Cubs and Marlins (T27th at 92.4) and Twins (30th at 92.0). The Padres topped the radar gun chart at 95.1.
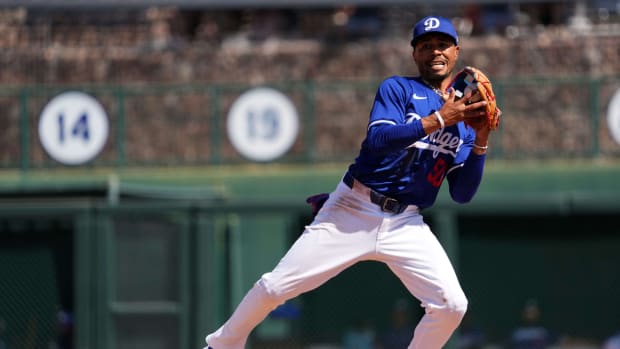
• Brusdar Graterol of the Dodgers threw 47 pitches clocked at 100 mph or more, the most in baseball. Second on the list was Garrett Crochet of the White Sox (45), who made his debut 10 days ago.
• On his 39th birthday, Adam Wainwright became the only pitcher this year to throw 120 pitches. Ten years ago, there were 131 such starts. Twenty years ago, there were 466.
• Remember all the hubbub about Charlie Blackmon's chasing .400? He was hitting .500 after 17 games. He hit .216 thereafter to finish at .303. Turns out the “.400 hitters” we should have been watching were Michael Conforto of the Mets and Travis d’Arnaud of the Braves. Conforto hit .412 on balls in play and d’Arnaud had a BABIP of .411. In the live-ball era (since 1920), only five qualified batters ever hit better on balls in play—all Hall of Famers in the 1920s: Babe Ruth, Rogers Hornsby, George Sisler, Ty Cobb and Harry Heilmann. The short season sure was long on oddities.