
We published an update on ORCL on June 29, 2022. A copy of the associated Earnings Update report is here.
Our Long Idea reports aim to identify firms that, despite market fears, unimpressive GAAP earnings, and other noise, have profitable businesses[1] and highly undervalued stock prices. They aim to show investors how to use our research and display the transparency of our analytical process. However, we understand that at the end of the day, investors care about one thing: performance.
2019 was an average year for our Long Ideas. Our picks, including reiterated ideas, averaged an 11% return over the course of the year, exactly matching the S&P 500.[2] Just 19 of our 56 Long Ideas outperformed the S&P 500. On the other hand, we picked very few losers, as just 14 of our 56 picks had negative returns.
Just as we did last year we’re going to start 2020 by looking at the Long Ideas that performed poorly in 2019. Next week, we’ll review our best picks. Michaels (MIK: $8/share), General Motors (GM: $36/share), and Oracle (ORCL: $54/share) were the Long Idea lowlights for 2019. Despite their underperformance, we remain bullish on these stocks, and they all remain open Long Ideas.
Lowlight 1: The Michael’s Companies (MIK) – Full Year Performance: Down 40% vs. S&P 500 up 29% - Reiterated September 11: Down 17% vs. S&P 500 up 8%
We initially made MIK a Long Idea on June 27, 2018. The stock was one of many retail picks that killed us in 2018, and while some of these picks – like Best Buy (BBY) and Skechers (SKX) – bounced back in 2019, MIK continued to lag. We reiterated our long thesis on the stock in September after a brief rally, but the stock promptly began to fall again amidst executive turnover, a Q3 earnings miss, and further analyst downgrades.
Our performance on this pick would have been much worse had MIK not rallied 35% in the last week of the year.
This volatility shows just how much disagreement remains in the market over this stock, and how much potential it has to deliver significant gains for investors. With 38% of the float held short, positive news could prompt a short squeeze to help maintain the recent momentum.
MIK continues to grow its economic earnings per share, improve sales per square foot, and earn margins well above its peers. Despite negative sentiment, there’s nothing in the fundamentals to suggest a troubled business. The stock has underperformed, but we remain bullish on the long-term outlook for the company and the stock.
Lowlight 2: General Motors (GM) – Full Year Performance: Up 9% vs. S&P 500 up 29% - Reiterated July 24: Down 10% vs. S&P 500 up 7%
We initially made GM a Long Idea on March 15, 2018. We reiterated GM as a Long Idea in our July 24 article, “Micro-Bubble Winners Continue to Outperform”. We featured the stock as one of four large incumbents that outperformed the more-hyped disruptors in their industries over the prior year.
For GM, we compare to Tesla (TSLA). At the time of our July update, TSLA had recently missed production targets and fell short of its projection to achieve profitability, while GM’s stock was up over 20% on the year, buoyed by strong cash flows and optimism over its self-driving efforts.
Since then, TSLA stock has doubled as it once again achieved GAAP profitability and announced it was on track to launch the Model Y in 2020. Since future cash flows for TSLA would likely come at the expense of GM, we expect the stocks to move opposite of one another, so it’s no surprise that TSLA’s gain in the second half of 2019 occurred as GM’s stock fell.
GM’s return on invested capital (ROIC) also declined in 2019 due to the impact of tariffs on margins and softer demand. Still, we remain bullish on the company over the long-term, and its current stock price of $36/share gives it a price to economic book value (PEBV) of just 0.5. This ratio means the market expects GM’s profits to permanently decline by 50%.
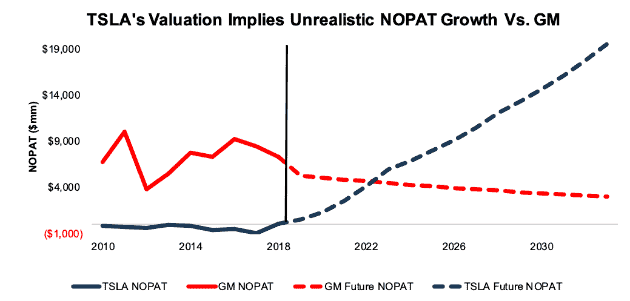
Our dynamic DCF model demonstrates the extent to which Tesla is overvalued and General Motors is undervalued by quantifying the cash flow expectations baked into their valuations.
Tesla’s current valuation of $460/share implies the firm will grow after-tax operating profit (NOPAT) by 50% compounded annually over the next 15 years. In this scenario, TSLA earns $19 billion in NOPAT in year 15, equal to 2019 NOPAT for Toyota Motor Corp (TM), the second largest automaker in the world. See the math behind this dynamic DCF scenario.
Meanwhile, General Motors’ current valuation of $35/share implies the firm’s NOPAT will decline by 6% compounded annually for 15 years. See the math behind this dynamic DCF scenario.
Figure 1 compares the NOPAT implied by these scenarios to the historical results of these companies dating back to 2010.
Figure 1: Tesla Vs. General Motors: Historical and Implied NOPAT
Sources: New Constructs, LLC and company filings
Lowlight 3: Oracle (ORCL) – Full Year Performance: Up 17% vs. S&P 500 up 29% - Reiterated July 24: Down 9% vs. S&P 500 up 7%
Oracle is another reiterated pick from “Micro-Bubble Winners Continue to Outperform.” We first made the stock a Long Idea in our original Micro-Bubble Winners piece on August 16, 2018. We must have been tempting fate to brag about our outperformers, because Oracle proceeded to drop after our July article.
The company fell short of revenue expectations in each of the two earnings reports since our article, and the stock was also shaken by the announcement that CEO Mark Hurd would be taking a leave of absence due to health issues.
Despite these concerns, the fundamentals of the business remain strong. Economic earnings per share increased by 30% over the trailing twelve months (TTM) period. ROIC remains steady at 20%.
Unlike GM, ORCL’s decline over the second half of 2019 wasn’t linked to another stock’s rise. Salesforce (CRM), the micro-bubble stock over which we think ORCL will ultimately prevail, was flat over the second half of the year. Still, the gap between the two companies’ valuations remains extreme.
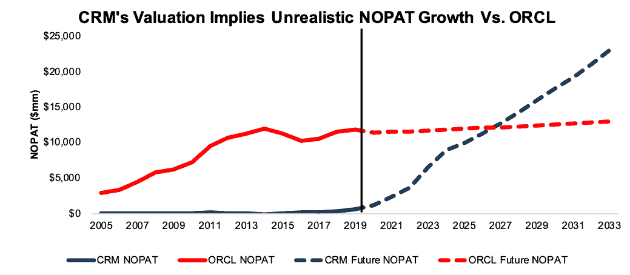
CRM’s current valuation of $175/share implies the firm will grow NOPAT by 31% compounded annually over the next 14 years. See the math behind this dynamic DCF scenario.
Meanwhile, ORCL’s current valuation of $54/share implies the firm’s NOPAT will grow by less than 1% compounded annually for 14 years. See the math behind this dynamic DCF scenario. This expectation seems overly pessimistic for a company that has grown NOPAT by 7% compounded annually over the past decade.
Figure 2 compares the NOPAT implied by these scenarios to the historical results of these companies dating back to 2005.
Figure 2: Salesforce Vs. Oracle: Historical and Implied NOPAT
Sources: New Constructs, LLC and company filings
It seems like the market’s negative reaction to ORCL was entirely due to the CEO’s health issues and a couple of underwhelming quarters. While there is some cause for concern, it is not enough to offset the strong fundamentals and cheap valuation of this stock. ORCL continues to earn our Very Attractive rating.
This article originally published on January 8, 2020.
Disclosure: David Trainer, Kyle Guske II, and Sam McBride receive no compensation to write about any specific stock, sector, style, or theme.
Follow us on Twitter, Facebook, LinkedIn, and StockTwits for real-time alerts on all our research.
[1] All of our reports utilize the superior data and earnings adjustments featured by the HBS & MIT Sloan paper, "Core Earnings: New Data and Evidence.”
[2] The S&P 500 gained 29% in 2019, but since our picks or reiterations are published over the course of the year we measure performance against the S&P 500 at the publication dates, not the beginning of the year.