
Note: This blog is part of the World Development Report 2021 series highlighting the importance of data synergies between public and private data in solving complex development problems.
Countries often face competing policy priorities for their limited resources. Achieving many of their goals is a tall order, especially when basic information on where the real problem lies is lacking. Despite the call for a data revolution back in 2013 by the UN High Level Panel on the Post-2015 Development Agenda, most countries do not yet have adequate data or enough analytical capacity to inform their policy agendas. Generating these data can turn intractable problems into more manageable ones.
Take the case of Sustainable Development Goal (SDG) 3.6, which is to reduce road mortality by half and save 675 thousand lives a year, many of them children and young adults. Data on road traffic crashes is lacking in low-income countries with official data estimated to capture only 17% of road traffic deaths.[1] The culprits are poorly developed administrative data systems that often rely on paper records and data that is not up to date.
The pressing need to address road safety in areas with large data gaps led our research team to ask: What other data exists that decision-makers can use to make better policies? Can the large quantities of privately held data generated from smartphones and social media usage offer a solution, taking care to safeguard privacy?

In 2012, the Kenya National Transport and Safety Authority (NTSA) faced an empty map of Nairobi, the country’s bustling capital city with a 6,200km road network (Figure 1). The National Police Services (NPS) had thousands of paper reports with information on when, where, and how crashes occurred. Yet, they would only manually count total fatalities and share with colleagues at the NTSA. These stacks of paper sitting in multiple police stations were not translating into useful and timely information on which policymakers could base life-saving decisions.
At the same time, there was a long list of road safety recommendations from the 2015 Brasilia Declaration on Road Safety[2] on improving regulation, enforcement, education, and infrastructure. The magnitude of the task of implementing these across the entire road network and the available resources presented a mismatch. Data did not exist in a format that would enable policy makers to narrow down this problem and identify where to prioritize interventions.
In 2018, we organized a workshop with six government agencies who agreed to support a data-intensive solution to Nairobi’s road safety problem. The NPS granted our research team access to paper records in the city’s 14 police stations. Working together, we turned this into a multi-year digitized dataset of over 8,500 Road Traffic Crashes (RTCs) – the first geolocated RTC map of Nairobi (Figure 2). Together, we also introduced a pilot for digital crash recording in the police force. The records collected under this pilot are rich with detailed information on the characteristics and location of the RTCs.
Analyzing these data can help classify where and when people die in the streets of Nairobi. It can help identify the underlying causes of crashes and which interventions could be best suited to address them.

The detailed police crash reports, however, only covered RTCs with injuries and deaths, not the universe of RTCs in the city. New data sources, such as social media platforms, provided an opportunity to supplement administrative data and fill in data gaps.
In Kenya, an existing traffic platform named Ma3Route had posted 870,000 transport-related tweets since 2012. Turning tweets into georeferenced data is not necessarily easy but the returns can be high. The team improved the database of Nairobi landmarks, adapted a natural language processing algorithm to identify crash reports, and geolocated them by developing a new geoparsing algorithm.[3] To verify the credibility of crowdsourced data, for a subset of tweets we dispatched a motorcycle delivery company to the site of the presumed crash minutes after each new crash report was received on Twitter to confirm validity. Encouragingly, a crash had occurred in the stated location or nearby in 92% of cases.
This process has produced georeferenced crash reports and populated a real time RTC map of 36,428 crash reports (and counting). The new data successfully complements administrative data to produce a more complete dataset of geolocated crashes (Figure 3).

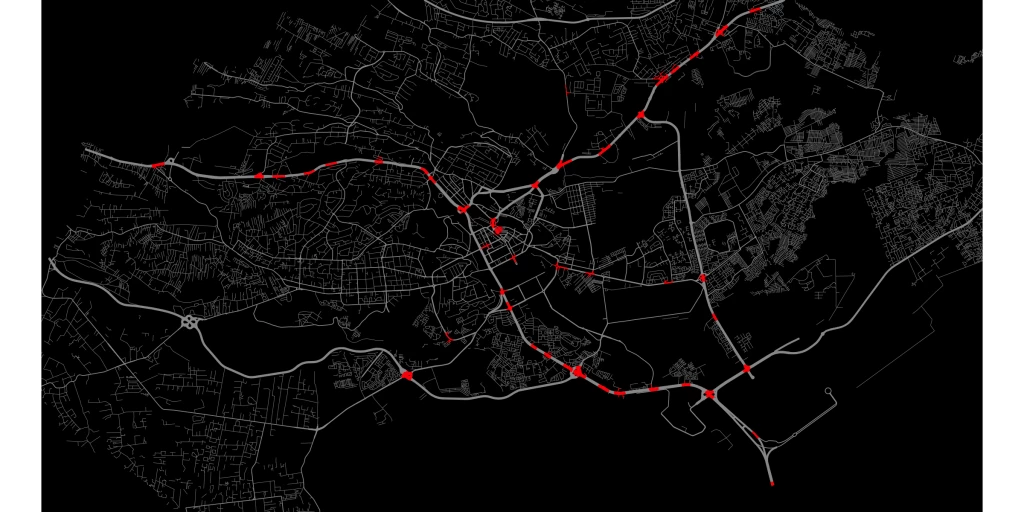
The analysis of the resulting dataset can help guide infrastructure redesign and enforcement policies to reduce RTCs. By geographically clustering RTCs, for example, we can start identifying city locations at high risk (Figure 4).

By ranking locations by number of RTCs or number of injuries and deaths, we can order sites for road safety investments. Using one year of the digitized data in Nairobi, for example, we find that 16% of locations alone spread across a meager 31 km of road experience an astounding 50% of the crashes (Figure 5). This means that by focusing our policy efforts on less than 1% of the road network, we can start resolving the road safety issue. No matter the resource constraint, investing smartly by focusing efforts where the problem is most severe holds great promise for achieving our goals.
To produce an even richer picture additional data can be used. Uber and Waze data, available through the Development Data Partnership, provide information on average speeds on different road segments or on obstacles such as potholes. Weather data can be used to understand driving conditions and Google Maps data to understand land usage such as pedestrian traffic near educational and health facilities. These data sources can be supplemented with survey data on infrastructure and road user behavior. In the case of Kenya, these private data sources were integrated with crash data to understand issues such as pedestrian flows versus availability of crosswalks, mortality and street lighting, or time of day and speeding.
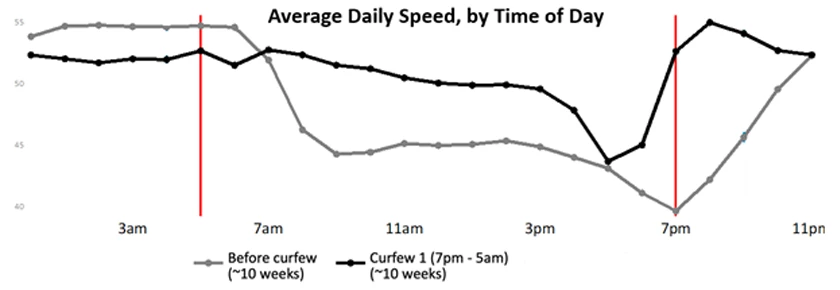
Importantly, setting up high-frequency spatially integrated data systems can provide the opportunity to answer questions as the need for new answers arises. For example, the same Waze and Google data that helps us understand potential causes of road traffic crashes can also be used to study how the COVID-19 lockdown and curfew measures are affecting the city of Nairobi. After Kenya announced a 7 pm curfew in March 2020, speed in Nairobi, as measured using estimated travel times from Google, is slowest at 5 pm instead of 7 pm as people leave earlier to get home. Speed peaks between 7 and 8pm as people try to reach their destination by curfew time or soon after (Figure 6). Speed is a key risk factor for RTCs. Therefore, any changes in speed could have important implications for crashes and this type of analysis can help agencies quickly react to prevent possible increases in crashes.
When traditional data is not enough, it is possible to improve the way we tackle development problems by building a data ecosystem that integrates survey, administrative, and new data sources, and that complements analysis to support the government’s policy priorities. This is but one among many examples that show great potential to improve development outcomes, described in the upcoming 2021 World Development Report, Data for Better Lives.
This project received funding from the DIME i2i ieConnect program, which has been funded with UK aid from the UK government, the Transport Global Practice and the Knowledge for Change Program (KCP) at the World Bank.
[1] Authors’ calculations based on a comparison of reported deaths and WHO modeled deaths from the WHO Global Status Report on Road Safety 2018.
[2] This was adopted during the Second Global High-Level Conference on Road Safety in 2015 and reiterated in the Stockholm Declaration by the Third Global Ministerial Conference on Road Safety "Achieving Global Goals 2030."
[3] The algorithms built on work by Finkel et al (2005); Ritter et al (2011); and Gelernter and Balaji (2013).


Join the Conversation