 Understanding Cancer using Machine Learning
 Understanding Cancer using Machine Learning
Use of Machine Learning (ML) in Medicine is becoming more and more important. One application example can be Cancer Detection and Analysis.
Introduction
As demonstrated by many researchers [1, 2], the use of Machine Learning (ML) in Medicine is nowadays becoming more and more important. Researchers are now using ML in applications such as EEG analysis and Cancer Detection/Analysis. For example, by examining biological data such as DNA methylation and RNA sequencing can then be possible to infer which genes can cause cancer and which genes can instead be able to suppress its expression. In this post, I will walk you through how I examined 9 different datasets about TCGA Liver, Cervical and Colon Cancer. All the datasets have been provided by the UCSC Xena (University of California, Santa Cruz website). For each of the 3 different types of cancer considered, three datasets were used, containing information about DNA methylation (Methylation450k), gene expression RNAseq (IlluminaHiSeq) and finally exon expression RNAseq (IlluminaHiSeq). These datasets are then grouped by information type rather than by cancer. I decided to use these datasets because they had all their features in common and shared a similar number of samples. Furthermore, I decided to select these types of cancers, because they offered a varied view of the genes and chromosomes characteristics of the human body since the different cancers were located in different parts of the body. In this way, the classification results obtained in this exercise could be generalised to other forms of cancer. DNA methylation plays an important role in the regulation of gene expression, and its modification can either result in generation or suppression of cancerous cells [3].
Classification
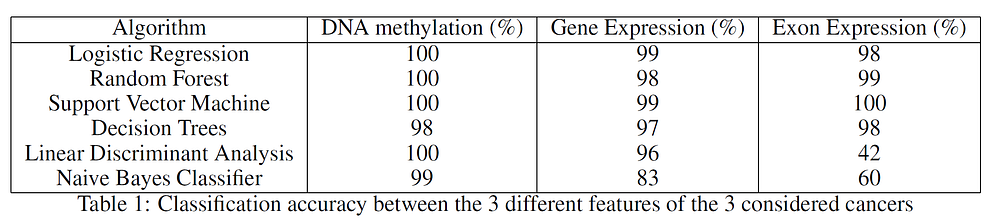
Each of the datasets had to be transposed and pre-processed. After forming the final three datasets, the classification between the different types of cancers was performed. In order to produce these results, a 70% training, 30% test split ratio was used. As shown in Table 1, many classifications algorithms were considered. These results were obtained making use of the whole datasets and the classifiers aimed to correctly distinguish between the three different types of cancer.
Feature Extraction
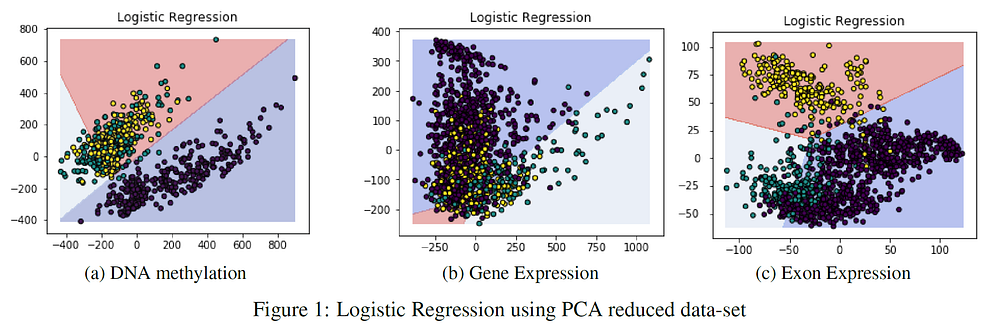
I performed Principal Component Analysis (PCA) on the 3 given datasets to see how the classification accuracy results would be affected by using just the first two principal components (Table 2). PCA aims to reduce the dimensionality of a dataset while preserving as much variance as possible. As can be noticed from Table 2, reducing the data dimensionality to just two features didn’t lead to a drastic decrease in accuracy.

Figure 1 provides the PCA classification results using Logistic Regression, the two axes represent the two principal components created by PCA. The Exon expression dataset seemed to be the most affected by PCA, scoring at maximum 65% accuracy. The reason for this result is the major overlap between the different classes, this is shown in Figure 1(c).
Finally, I decided to apply another feature extraction technique such as t-SNE. This technique can be implemented to visualise high-dimensional data into a lower dimensional space maximising the separation between the different classes. The results are shown in Figure 2, the two-axis represents the two main components engineered by t-SNE. Each of the three different types of cancer has been labelled using different colours (TCGA Liver = 0, Cervical = 1, Colon = 2). As can be seen, by Figure 2, t-SNE created two features able to separate well the three different classes.

Feature Selection
The previous sections showed us that using the whole datasets it was possible to achieve really good classification results. Using feature extraction techniques such as PCA and t-SNE, it has then been shown that it is possible to reduce dimensionality whilst still yielding an appreciable classification score. Thanks to these results, I then decided to plot a decision tree representing the main features (the ones holding the biggest weights) used in classification to take a closer look at most important ones. I decided to use a Decision Tree for analysis due to its classification performance in all three datasets. The results can be seen in Figure 3 (DNA methylation), Figure 4 (Gene Expression) and Figure 5 (Exon Expression).

In each of these figures, the different cancer types are represented by a different colour (TCGA Liver = 0, Cervical = 1, Colon = 2). The feature distributions of all three cancers are represented in the tree’s starting node. As long as we move down each branch the algorithm tries then to best separate the different distributions using the feature described underneath each of the node graphs. The circles generated alongside the distributions represent the number of elements correctly classified after following a certain node, the bigger the number of elements the bigger the size of the circle.

In order to produce these graphs, I made use of the dtreeviz.trees library created by Terence Parr and Prince Grover. I decided to use this library since it enabled me to visualise the features distributions in each branch of the tree. This can be particularly important in a biological ambit when trying to analyse the differences between classes and in observing how an algorithm makes its classification decisions.

Evaluation
Table 3 provides a summary of the features used at the top (first two levels) of the three different trees. After careful research, looking into online available databases, a series of relevant annotations have been added for each of the features (Table 3). In the case of cg27427318 and chr10:81374338–81375201 it was not possible to find any relevant information.
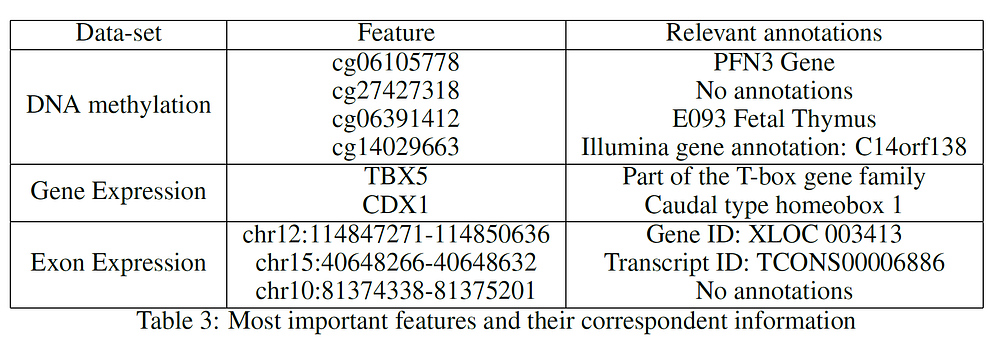
Some of the most interesting results that have been inferred from the analysed features are:
- PFN3 has been identified as the closest gene to cg06105778. According to a study carried out by Li Zou, Zhijie Ding et al. in 2010, Profilins (Pfns) could potentially be classified as a tumour-suppressor protein in breast cancer [4].
- According to “Prostate Cancer in a Male with Holt-Oram Syndrome: First Clinical Association of the TBX5 Mutation” by Noel J. Aherne, Guhan Rangaswamy, et al., the TBX5 gene is “is thought to upregulate tumour cell proliferation and metastasis when mutated” [5]. Another study by Yu J, Ma X et al. demonstrated instead that patients affected by colon cancer with TBX5 have much lower survival rates [6].
- Research carried out by Alexa Hryniuk, Stephanie Grainger, et al. highlighted that “loss of Cdx1 led to a significant increase in the incidence of tumour in the distal colon” [7].
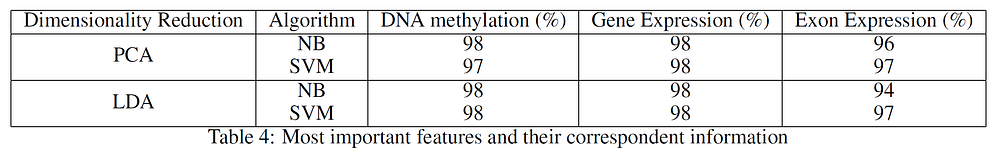
Using just the features listed in Table 3 from the respective data-sets, I finally decided to use PCA and Linear Discriminant Analysis (LDA) to reduce the data to just two dimensions and perform Naive Bayes (NB) and Support Vector Machines (SVM) classification to see how much variance of the data had been covered. The results are available in Table 4, which shows that using just the most important features from the datasets led to excellent classification results (thanks to the reduced noise). In all the considered cases, between 83% and 99% of the original data variance was preserved.
Conclusion
Overall this project lead to really good results. As further development, it would be interesting to try alternative Feature Selection techniques such as Recursive Feature Selection (RFS) or SVM (as explained in this my other post) to see if other types of genes/chromosomes can be identified. Another possible improvement to this analysis could be to use datasets containing data from healthy subjects as well to cross-validate the obtained results.
I would like to thank Professor Adam Prugel-Bennett for giving me the opportunity to carry out this project.
Contacts
If you want to keep updated with my latest articles and projects follow me on Medium and subscribe to my mailing list. These are some of my contacts details:
Bibliography
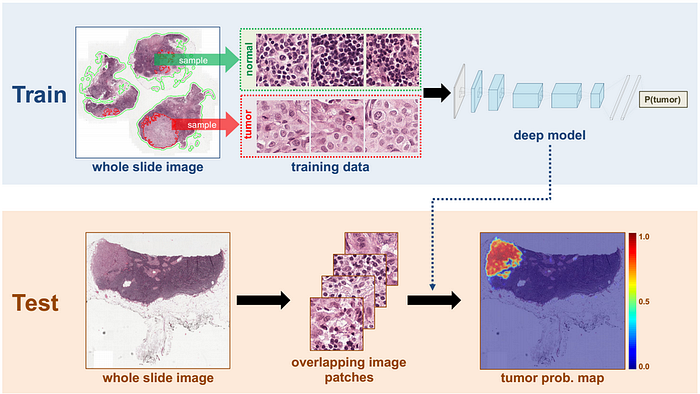
[1] Viridiana Romero Martinez. Detecting breast cancer in histopathological images using Deep Learning. Accessed at: https://medium.com/datadriveninvestor/detecting-breast-cancer-in-histopathological-images-using-deeplearning-a66552aef98, April 2019.
[2] Hu Zilonga, Tang Jinshan, Et al. Deep learning for image-based cancer detection and diagnosis, A survey. Accessed at: https://www.sciencedirect.com/science/article/abs/pii/S0031320318301845, May 2019.
[3] Luczak MW, Jagodzi´nski PP. The role of DNA methylation in cancer development. Accessed at: https://www.ncbi.nlm.nih.gov/pubmed/16977793, May 2019.
[4] Li Zou, Zhijie Ding, and Partha Roy. Profilin-1 overexpression inhibits proliferation of MDA-MB-231 breast cancer cells partly through p27kip1 upregulation Accessed at: https://www.ncbi.nlm.nih.gov/pmc/articles/PMC2872929/pdf/nihms-202017.pdf, May 2019.
[5] Noel J. Aherne, Guhan Rangaswamy, and Pierre Thirion. Prostate Cancer in a Male with Holt-Oram Syndrome: First Clinical Association of the TBX5 Mutation Accessed at: https://www.hindawi.com/journals/criu/2013/405343/, May 2019.
[6] Yu J, Ma X, et al. Epigenetic inactivation of T-box transcription factor 5, a novel tumour suppressor gene, is associated with colon cancer. Accessed at: https://www.ncbi.nlm.nih.gov/pubmed/20802524, May 2019.
[7] Alexa Hryniuk, Stephanie Grainger, et al. Cdx1 and Cdx2 Function as Tumor Suppressors. Accessed at: https://www.ncbi.nlm.nih.gov/pmc/articles/PMC4246091/, May 2019.
Thanks to Ludovic Benistant.
Bio: Pier Paolo Ippolito is a Data Scientist and MSc in Artificial Intelligence graduate from the University of Southampton. He has a strong interest in AI advancements and machine learning applications (such as finance and medicine). Connect with him on Linkedin.
Original. Reposted with permission.
Related:
- Detecting Breast Cancer with Deep Learning
- The Long Tail of Medical Data
- Classifying Heart Disease Using K-Nearest Neighbors