Technology
What Does 1GB of Mobile Data Cost in Every Country?


What Does 1GB of Mobile Data Cost in Every Country?
Billions of people around the world rely on their mobile phones every day.
Even in a saturated market, mobile networks have continued to expand their reach. In the last five years alone, almost one billion additional people have gained access to mobile data services.
Despite the growing prevalence of these networks worldwide, the cost of gaining access can vary greatly from country to country—particularly when it comes to the price of mobile data.
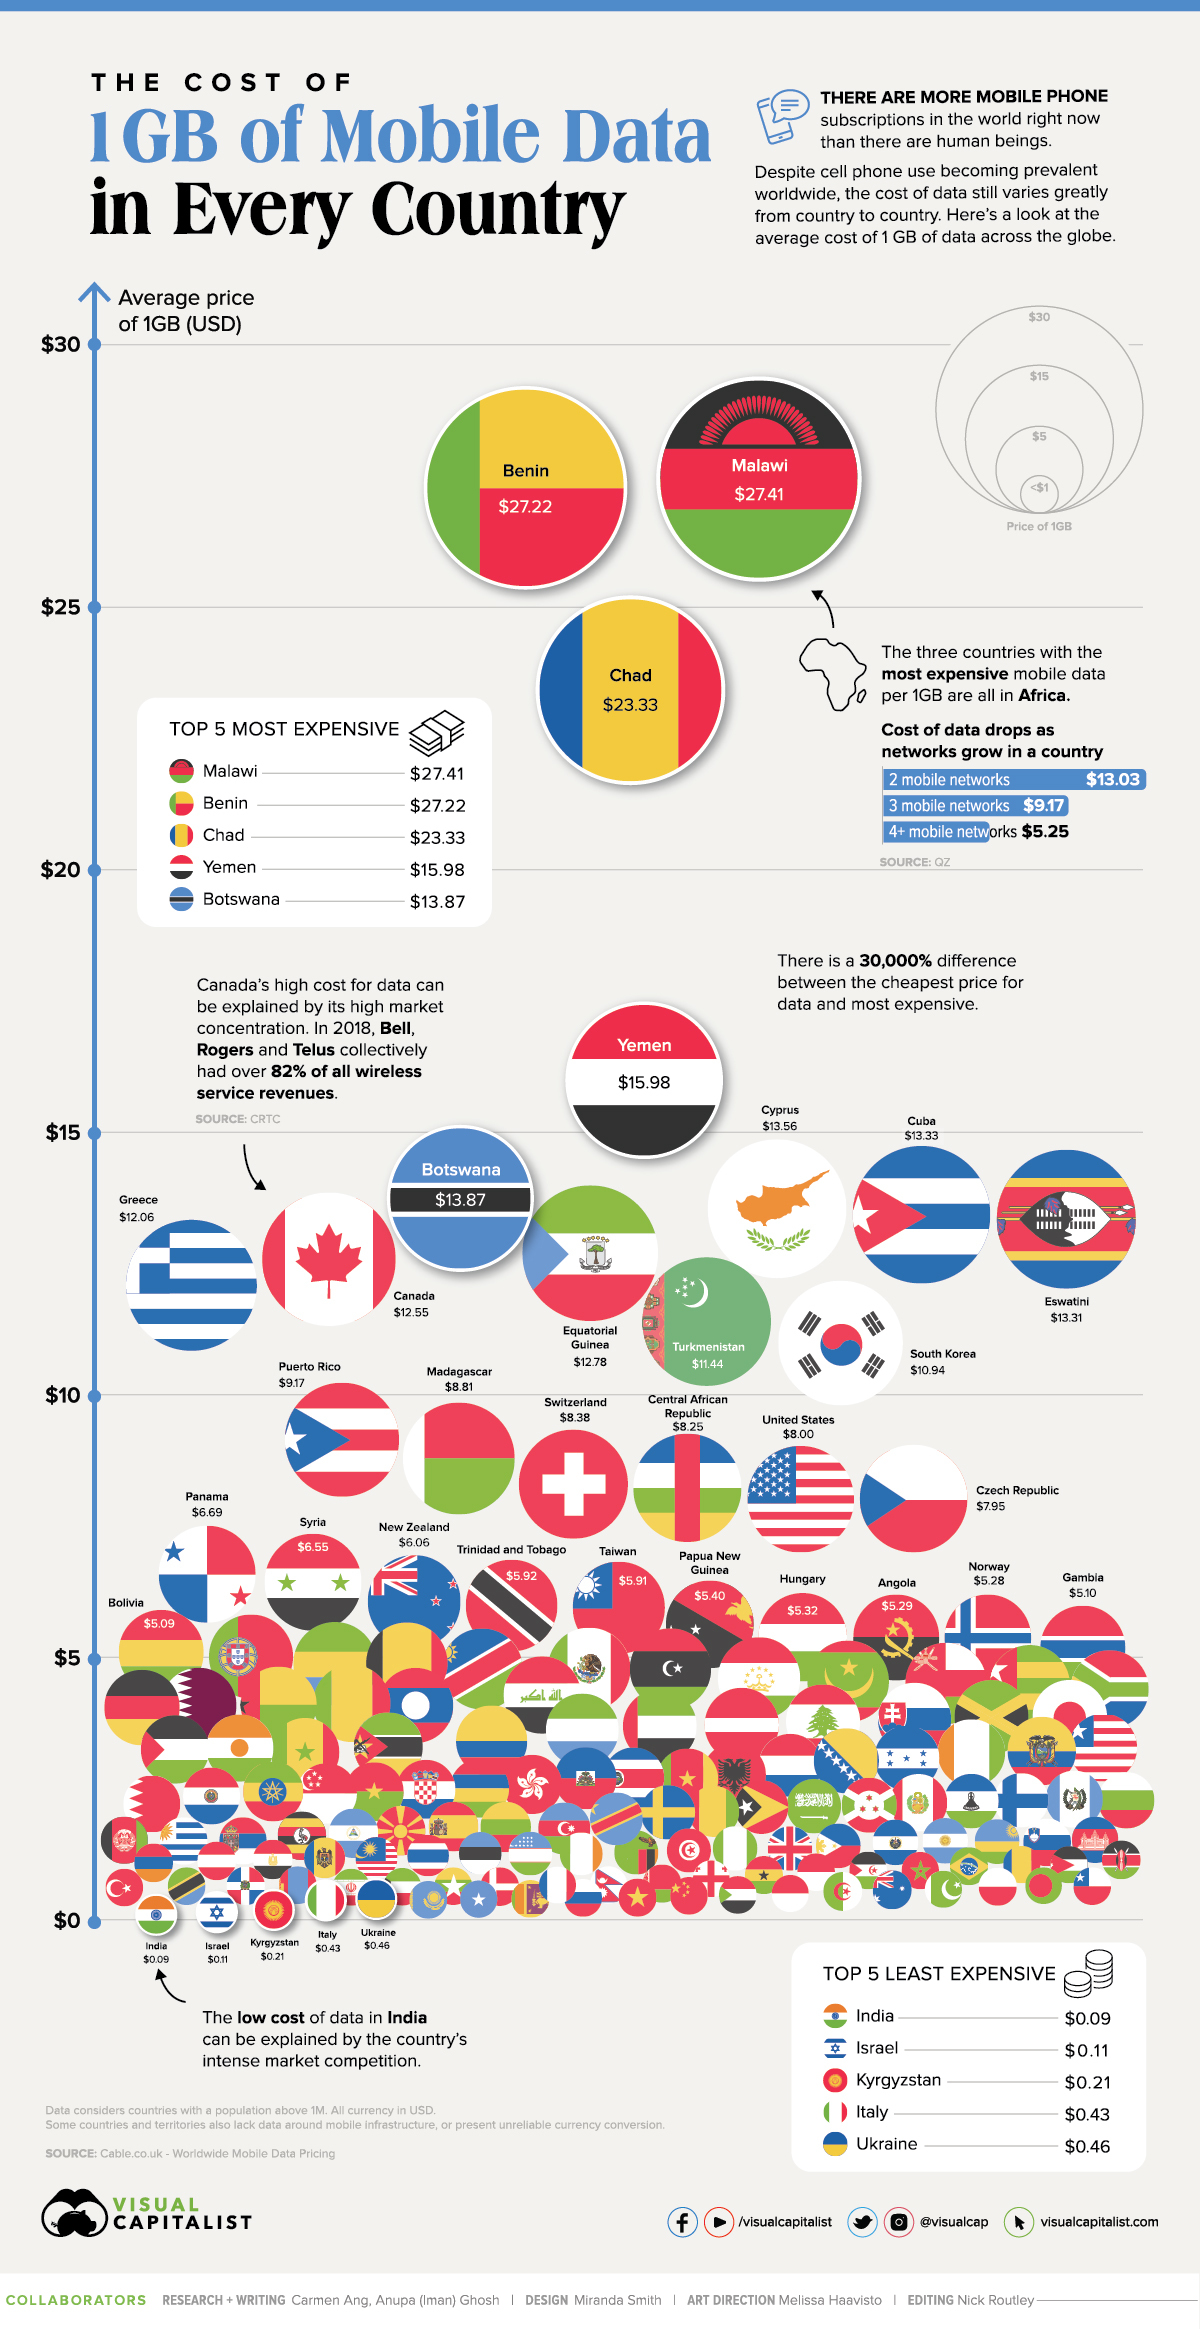
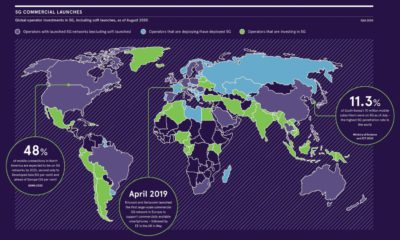
Today’s chart uses figures from Cable.co.uk to showcase the average cost of one gigabyte (GB) of mobile data in 155 different countries and jurisdictions. Despite the vast global reach of the mobile economy, it’s clear it still has a long way to go to reach true accessibility.
Discrepancies in Mobile Data Costs
Researchers have identified several key elements that help explain the cost variation for mobile data between countries:
- Existing infrastructure (or lack thereof): This might seem counterintuitive, but most mobile networks rely on a fixed-line connection. As a result, countries with existing infrastructure are able to offer mobile plans with more data, at a cheaper price. This is the case for India and Italy. Countries with minimal or no infrastructure rely on more costly connection alternatives like satellites, and the cost typically gets passed down to the consumer.
- Reliance on mobile data: When mobile data is the primary source of internet in a particular region, adoption can become nearly universal. This high demand typically leads to an increase in competing providers, which in turn lowers the cost. Kyrgyzstan is a good example of this.
- Low data consumption: Countries with poor infrastructure tend to use less data. With mobile plans that offer smaller data limits, the overall average cost per GB tends to skew higher. Countries like Malawi and Benin are examples of this phenomenon.
- Average income of consumer: Relatively wealthy nations tend to charge more for mobile services since the population can generally afford to pay more, and the cost of operating a network is higher. This is apparent in countries like Canada or Germany.
The Cheapest Countries for 1 GB of Data
Even among the cheapest countries for mobile data, the cost variation is significant. Here’s a look at the top five cheapest countries for 1 GB of data:
| Overall Rank | Country | Average price of 1GB (USD) |
|---|---|---|
| 1 | 🇮🇳 India | 9¢ |
| 2 | 🇮🇱 Israel | 11¢ |
| 3 | 🇰🇬 Kyrgyzstan | 21¢ |
| 4 | 🇮🇹 Italy | 43¢ |
| 5 | 🇺🇦 Ukraine | 46¢ |
India ranks the cheapest at $0.09 per GB, a 65% decrease in price compared to the country’s average cost in 2019.
Why is data so cheap in India? A significant factor is the country’s intense market competition, driven by Reliance Jio—a telecom company owned by Reliance Industries, one of the largest conglomerates in India. Reliance Jio launched in 2016, offering customers free trial periods and plans for less than a $1 a month. This forced other providers to drop their pricing, driving down the overall cost of data in the region.
Because these prices are likely unsustainable for the long term, India’s cheaper-than-usual prices may soon come to an end.
Another country worth highlighting is Kyrgyzstan, which ranks as the third cheapest at $0.21 per GB, ahead of Italy and Ukraine. This ranking is surprising, given the country’s minimal fixed-line infrastructure and large rural population. Researchers suspect the low cost is a result of Kyrgyzstan’s heavy reliance on mobile data as the population’s primary source of internet.
The Most Expensive Countries for 1 GB of Data
On the other end of the spectrum, here are the top five most expensive countries for one gigabyte of mobile data:
| Overall Rank | Country | Average price of 1GB (USD) |
|---|---|---|
| 155 | 🇲🇼 Malawi | $27.41 |
| 154 | 🇧🇯 Benin | $27.22 |
| 153 | 🇹🇩 Chad | $23.33 |
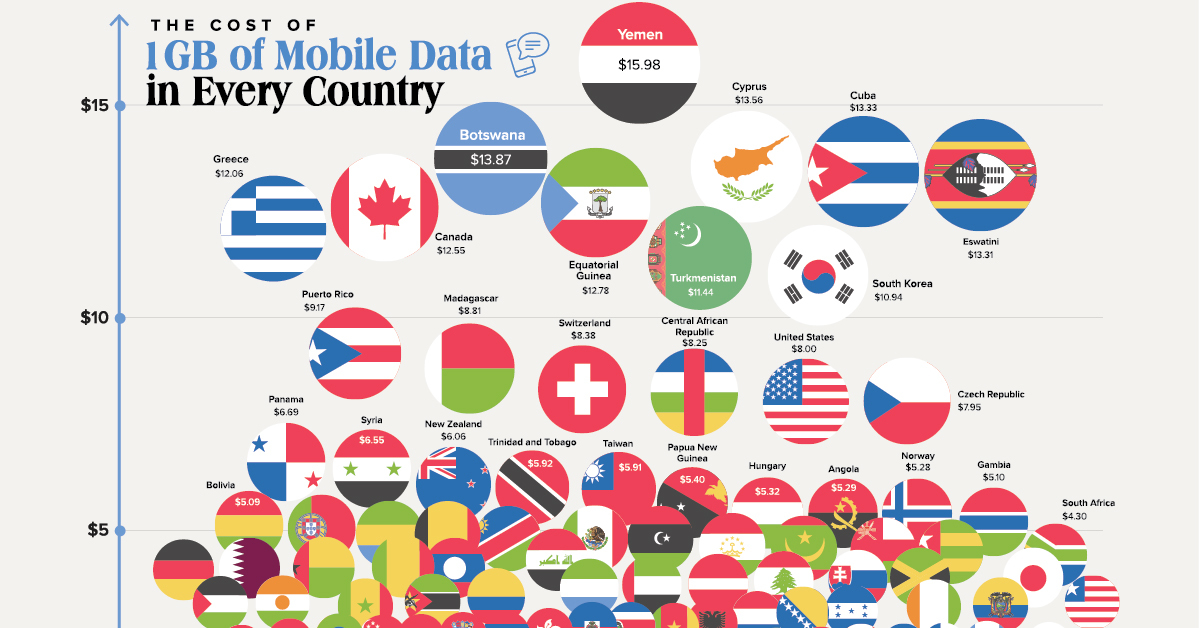
| 152 | 🇾🇪 Yemen | $15.98 |
| 151 | 🇧🇼 Botswana | $13.87 |
A striking trend worth noting is that four out of five of the most expensive countries for mobile data are in Sub-Saharan Africa (SSA).
A significant factor behind the high cost of data in SSA is its lack of infrastructure. With overburdened networks, the data bundles offered in the region are generally smaller. This drives up the average cost per GB when compared to countries with unlimited packages.
Another element that contributes to SSA’s high costs is its lack of market competition. In countries with multiple competing networks, such as Nigeria, the cost of data skews lower.
The Full Breakdown
The below table has a full list of all 155 countries and jurisdictions included in the data set. It helps demonstrate the stark contrast in the cost of mobile data between the most expensive and cheapest countries globally.
| Rank | Country | Average price of 1GB (USD) |
|---|---|---|
| 1 | India | 9¢ |
| 2 | Israel | 11¢ |
| 3 | Kyrgyzstan | 21¢ |
| 4 | Italy | 43¢ |
| 5 | Ukraine | 46¢ |
| 6 | Kazakhstan | 46¢ |
| 7 | Somalia | 50¢ |
| 8 | Sri Lanka | 51¢ |
| 9 | Russian Federation | 52¢ |
| 10 | Vietnam | 57¢ |
| 11 | China | 61¢ |
| 12 | Sudan | 63¢ |
| 13 | Indonesia | 64¢ |
| 14 | Algeria | 65¢ |
| 15 | Australia | 68¢ |
| 16 | Pakistan | 69¢ |
| 17 | Poland | 70¢ |
| 18 | Bangladesh | 70¢ |
| 19 | Chile | 71¢ |
| 20 | Turkey | 72¢ |
| 21 | Tanzania | 73¢ |
| 22 | Dominican Republic | 74¢ |
| 23 | Mongolia | 74¢ |
| 24 | Iran | 75¢ |
| 25 | Kuwait | 77¢ |
| 26 | Myanmar | 78¢ |
| 27 | Denmark | 80¢ |
| 28 | France | 81¢ |
| 29 | Nepal | 86¢ |
| 30 | Belarus | 89¢ |
| 31 | Georgia | 93¢ |
| 32 | Ghana | 94¢ |
| 33 | Monaco | 98¢ |
| 34 | Western Sahara | 99¢ |
| 35 | Morocco | 99¢ |
| 36 | Brazil | $1.01 |
| 37 | Romania | $1.03 |
| 38 | Jordan | $1.03 |
| 39 | Kenya | $1.05 |
| 40 | Armenia | $1.05 |
| 41 | Austria | $1.08 |
| 42 | Egypt | $1.09 |
| 43 | Moldova | $1.12 |
| 44 | Malaysia | $1.12 |
| 45 | Thailand | $1.23 |
| 46 | Estonia | $1.27 |
| 47 | Uzbekistan | $1.34 |
| 48 | Ireland | $1.36 |
| 49 | Zambia | $1.36 |
| 50 | Tunisia | $1.37 |
| 51 | Nigeria | $1.39 |
| 52 | United Kingdom | $1.39 |
| 53 | Philippines | $1.42 |
| 54 | El Salvador | $1.45 |
| 55 | Argentina | $1.45 |
| 56 | Rwanda | $1.48 |
| 57 | Slovenia | $1.48 |
| 58 | Cambodia | $1.50 |
| 59 | Afghanistan | $1.55 |
| 60 | Uruguay | $1.58 |
| 61 | Serbia | $1.60 |
| 62 | Uganda | $1.62 |
| 63 | Nicaragua | $1.71 |
| 64 | Macedonia | $1.75 |
| 65 | Spain | $1.81 |
| 66 | Lithuania | $1.85 |
| 67 | Azerbaijan | $1.86 |
| 68 | Congo | $1.94 |
| 69 | Sweden | $2.07 |
| 70 | Guinea | $2.08 |
| 71 | Timor-Leste | $2.08 |
| 72 | Saudi Arabia | $2.12 |
| 73 | Burundi | $2.12 |
| 74 | Peru | $2.13 |
| 75 | Lesotho | $2.13 |
| 76 | Finland | $2.14 |
| 77 | Guatemala | $2.17 |
| 78 | Bulgaria | $2.22 |
| 79 | Bahrain | $2.27 |
| 80 | Paraguay | $2.30 |
| 81 | Ethiopia | $2.44 |
| 82 | Singapore | $2.47 |
| 83 | Burkina Faso | $2.47 |
| 84 | Croatia | $2.48 |
| 85 | Mauritius | $2.48 |
| 86 | Hong Kong | $2.55 |
| 87 | Haiti | $2.74 |
| 88 | Costa Rica | $2.74 |
| 89 | Cameroon | $2.75 |
| 90 | Albania | $2.83 |
| 91 | Netherlands | $2.98 |
| 92 | Bosnia and Herzegovina | $3.04 |
| 93 | Honduras | $3.12 |
| 94 | Côte d'Ivoire | $3.20 |
| 95 | Ecuador | $3.24 |
| 96 | Liberia | $3.25 |
| 97 | Palestine | $3.26 |
| 98 | Niger | $3.30 |
| 99 | Senegal | $3.30 |
| 100 | Mozambique | $3.33 |
| 101 | Colombia | $3.46 |
| 102 | Sierra Leone | $3.69 |
| 103 | United Arab Emirates | $3.78 |
| 104 | Latvia | $3.79 |
| 105 | Lebanon | $3.82 |
| 106 | Slovakia | $3.84 |
| 107 | Jamaica | $3.88 |
| 108 | Japan | $3.91 |
| 109 | Germany | $4.06 |
| 110 | Qatar | $4.12 |
| 111 | Guinea-Bissau | $4.12 |
| 112 | Mali | $4.12 |
| 113 | Lao PDR | $4.16 |
| 114 | Iraq | $4.20 |
| 115 | South Africa | $4.30 |
| 116 | Togo | $4.50 |
| 117 | Oman | $4.58 |
| 118 | Mauritania | $4.63 |
| 119 | Tajikistan | $4.65 |
| 120 | Libya | $4.73 |
| 121 | Mexico | $4.77 |
| 122 | Namibia | $4.78 |
| 123 | Belgium | $4.88 |
| 124 | Gabon | $4.89 |
| 125 | Portugal | $4.97 |
| 126 | Bolivia | $5.09 |
| 127 | Gambia | $5.10 |
| 128 | Norway | $5.28 |
| 129 | Angola | $5.29 |
| 130 | Hungary | $5.32 |
| 131 | Papua New Guinea | $5.40 |
| 132 | Taiwan | $5.91 |
| 133 | Trinidad and Tobago | $5.92 |
| 134 | New Zealand | $6.06 |
| 135 | Syria | $6.55 |
| 136 | Panama | $6.69 |
| 137 | Czech Republic | $7.95 |
| 138 | United States | $8.00 |
| 139 | Central African Republic | $8.25 |
| 140 | Switzerland | $8.38 |
| 141 | Madagascar | $8.81 |
| 142 | Puerto Rico | $9.17 |
| 143 | South Korea | $10.94 |
| 144 | Turkmenistan | $11.44 |
| 145 | Greece | $12.06 |
| 146 | Canada | $12.55 |
| 147 | Equatorial Guinea | $12.78 |
| 148 | Eswatini | $13.31 |
| 149 | Cuba | $13.33 |
| 150 | Cyprus | $13.56 |
| 151 | Botswana | $13.87 |
| 152 | Yemen | $15.98 |
| 153 | Chad | $23.33 |
| 154 | Benin | $27.22 |
| 155 | Malawi | $27.41 |
Interestingly, the highest average cost is 30,000% more than the cheapest average price.
The Technology Gap
Will we reach a point of equal accessibility across the globe, or will the technology gap between countries continue to widen?
With 5G networks on the rise, just seven countries are expected to make up the majority of 5G related investments. Time will tell what this means for adoption worldwide.
Editor’s Note: The methodology used by Cable.co.uk represents a region’s national average, based on both pre-paid and post-paid plans. While the data correctly represents each region’s average cost on 1 GB based on the chosen methodology, Cable.co.uk acknowledges that it may not reflect the way most people in a country consume data.


Technology
Ranked: Semiconductor Companies by Industry Revenue Share
Nvidia is coming for Intel’s crown. Samsung is losing ground. AI is transforming the space. We break down revenue for semiconductor companies.


Semiconductor Companies by Industry Revenue Share
This was originally posted on our Voronoi app. Download the app for free on Apple or Android and discover incredible data-driven charts from a variety of trusted sources.
Did you know that some computer chips are now retailing for the price of a new BMW?
As computers invade nearly every sphere of life, so too have the chips that power them, raising the revenues of the businesses dedicated to designing them.
But how did various chipmakers measure against each other last year?
We rank the biggest semiconductor companies by their percentage share of the industry’s revenues in 2023, using data from Omdia research.
Which Chip Company Made the Most Money in 2023?
Market leader and industry-defining veteran Intel still holds the crown for the most revenue in the sector, crossing $50 billion in 2023, or 10% of the broader industry’s topline.
All is not well at Intel, however, with the company’s stock price down over 20% year-to-date after it revealed billion-dollar losses in its foundry business.
| Rank | Company | 2023 Revenue | % of Industry Revenue |
|---|---|---|---|
| 1 | Intel | $51B | 9.4% |
| 2 | NVIDIA | $49B | 9.0% |
| 3 | Samsung Electronics | $44B | 8.1% |
| 4 | Qualcomm | $31B | 5.7% |
| 5 | Broadcom | $28B | 5.2% |
| 6 | SK Hynix | $24B | 4.4% |
| 7 | AMD | $22B | 4.1% |
| 8 | Apple | $19B | 3.4% |
| 9 | Infineon Tech | $17B | 3.2% |
| 10 | STMicroelectronics | $17B | 3.2% |
| 11 | Texas Instruments | $17B | 3.1% |
| 12 | Micron Technology | $16B | 2.9% |
| 13 | MediaTek | $14B | 2.6% |
| 14 | NXP | $13B | 2.4% |
| 15 | Analog Devices | $12B | 2.2% |
| 16 | Renesas Electronics Corporation | $11B | 1.9% |
| 17 | Sony Semiconductor Solutions Corporation | $10B | 1.9% |
| 18 | Microchip Technology | $8B | 1.5% |
| 19 | Onsemi | $8B | 1.4% |
| 20 | KIOXIA Corporation | $7B | 1.3% |
| N/A | Others | $126B | 23.2% |
| N/A | Total | $545B | 100% |
Note: Figures are rounded. Totals and percentages may not sum to 100.
Meanwhile, Nvidia is very close to overtaking Intel, after declaring $49 billion of topline revenue for 2023. This is more than double its 2022 revenue ($21 billion), increasing its share of industry revenues to 9%.
Nvidia’s meteoric rise has gotten a huge thumbs-up from investors. It became a trillion dollar stock last year, and broke the single-day gain record for market capitalization this year.
Other chipmakers haven’t been as successful. Out of the top 20 semiconductor companies by revenue, 12 did not match their 2022 revenues, including big names like Intel, Samsung, and AMD.
The Many Different Types of Chipmakers
All of these companies may belong to the same industry, but they don’t focus on the same niche.
According to Investopedia, there are four major types of chips, depending on their functionality: microprocessors, memory chips, standard chips, and complex systems on a chip.
Nvidia’s core business was once GPUs for computers (graphics processing units), but in recent years this has drastically shifted towards microprocessors for analytics and AI.
These specialized chips seem to be where the majority of growth is occurring within the sector. For example, companies that are largely in the memory segment—Samsung, SK Hynix, and Micron Technology—saw peak revenues in the mid-2010s.

-
 Money2 weeks ago
Visualizing the Growth of $100, by Asset Class (1970-2023)
-

 Money1 week ago
Where Does One U.S. Tax Dollar Go?
-

 Green2 weeks ago
Ranked: Top Countries by Total Forest Loss Since 2001
-

 Real Estate2 weeks ago
Visualizing America’s Shortage of Affordable Homes
-

 Maps2 weeks ago
Mapped: Average Wages Across Europe
-

 Mining2 weeks ago
Charted: The Value Gap Between the Gold Price and Gold Miners
-

 Demographics2 weeks ago
Visualizing the Size of the Global Senior Population
-

 Automotive2 weeks ago
Tesla Is Once Again the World’s Best-Selling EV Company