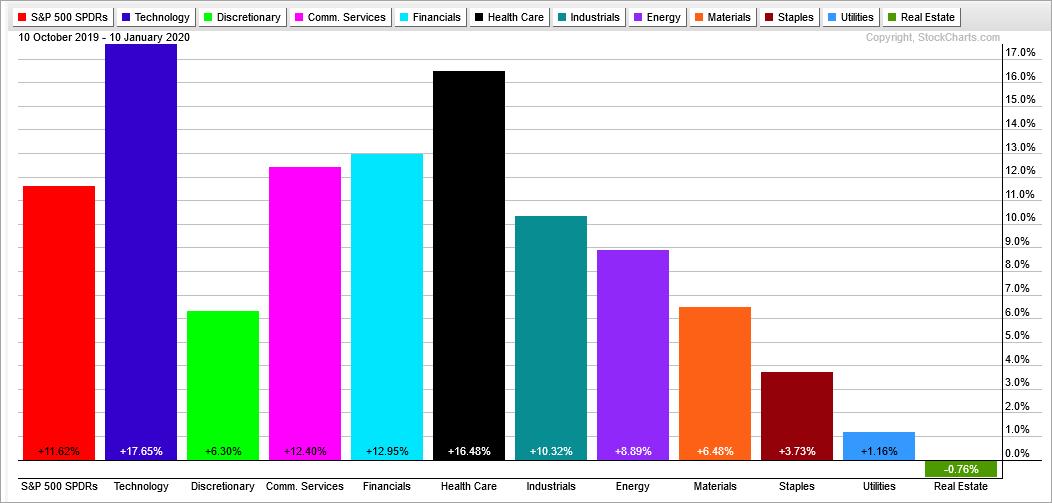
 Ten of the eleven sector SPDRs are positive over the last three months. The Real Estate SPDR (XLRE) is the only sector sporting a loss (~.75%), but I am not concerned with relative weakness because the price chart looks bullish overall. Note that XLRE was the leading sector in early September with the biggest year-to-date gain at the time. It basically moved from leader to laggard over the last three months. Can it move back to leader? Let's check the chart.
Despite relative and absolute weakness since mid October, the price chart shows promise as XLRE bids to end its correction. The ETF advanced some 35% from late December to late October, and hit a new high in the process. This was a massive move and the ETF was entitled to a rest at some point. That point came in the fourth quarter as the stock fell back to the rising 200-day SMA. I still think the long-term trend is up because the 200-day largely held and the PPO(20,200,0) remains positive. This means the 20-day EMA is above the 200-day EMA.
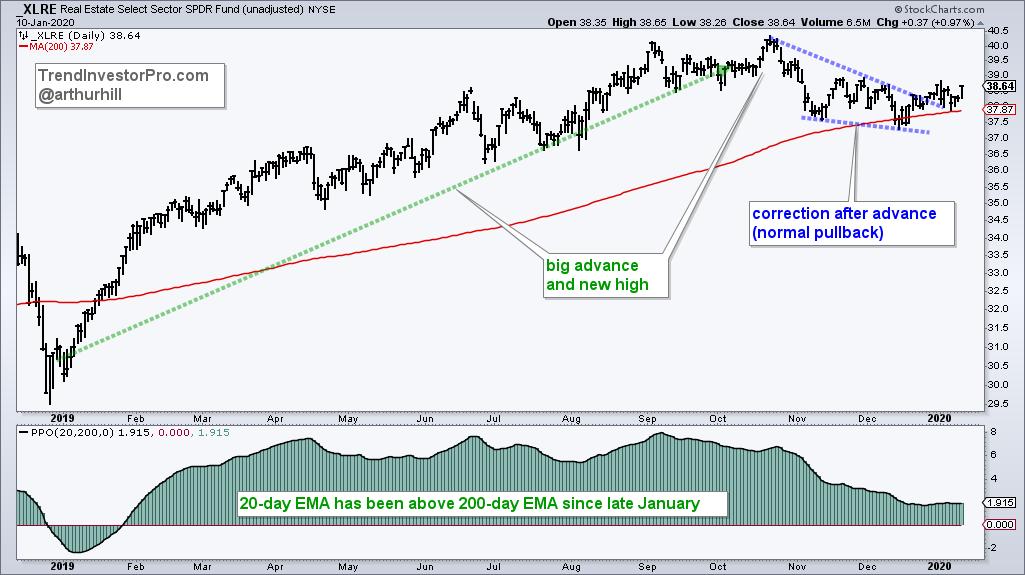
Now let's look at the pattern at work. A falling wedge formed from October to December. These patterns are typical for corrections after advances. The ETF broke above the wedge line in late December and this breakout is largely holding over the last two weeks. This breakout signals an end to the corrective period and a resumption of the bigger uptrend. As such, a move towards, and above, the October high is expected. I would re-evaluate this bullish thesis on a close below 37.50.
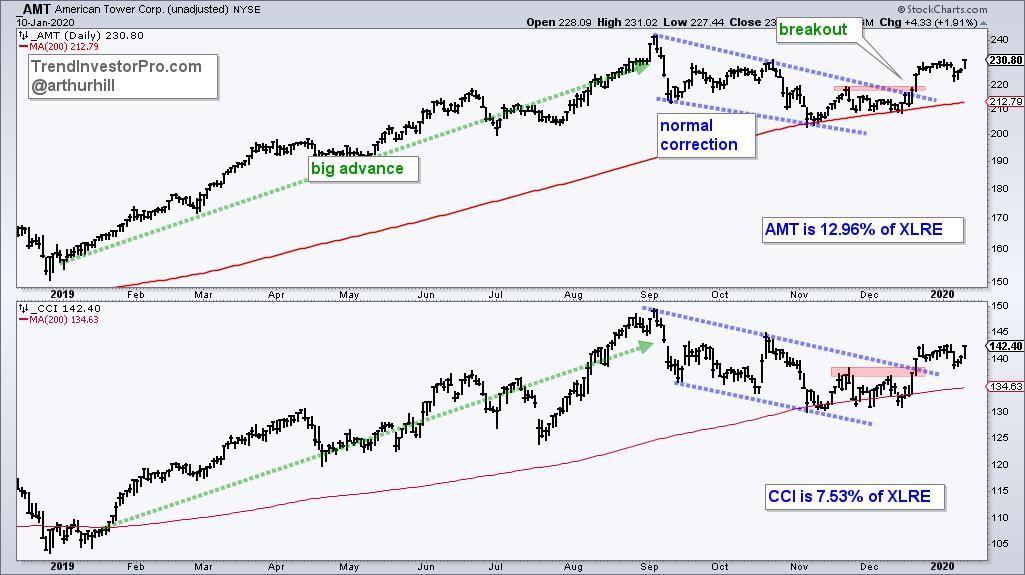
The sector SPDRs are often dominated by a few large-caps and XLRE is not an exception. The two largest stocks, American Tower (AMT) and Crown Castle (CCI) account for over 20% of the ETF. Unsurprisingly, these two cell tower REITs have similar patterns at work. Both hit new highs in early September after big advances, corrected into November and broke out in December. These breakouts bode well for the stocks and for XLRE.
Looking to reduce the noise, cut the hyperbole and focus on what really matters? Check out TrendInvestorPro.com, the home of objective, systematic and thoughtful analysis. Subscribe today and get immediate access to: Weekly Ranking and Analysis for 60 Core ETFs, ETF ChartBook, Market Timing Report, Weekend Video and Saturday Stock Setups. Click here to take your analysis to the next level.
--------------------------
A Challenge for 2020 | Arthur Hill, CMT | Next Level Charting
------------------------------
Choose a Strategy, Develop a Plan and Follow a Process
Arthur Hill, CMT
Chief Technical Strategist, TrendInvestorPro.com
Author, Define the Trend and Trade the Trend
Want to stay up to date with Arthur's latest market insights?
– Follow @ArthurHill on Twitter
– Subscribe to Art's Charts
