Markets
How the World’s Biggest Companies Have Changed in Just 10 Years
How the World’s Biggest Companies Have Changed in Just 10 Years
The Chart of the Week is a weekly Visual Capitalist feature on Fridays.
At first glance, the business world may seem quite static. The biggest companies today – ones like Apple, Walmart, or Exxon Mobil – will likely also be some of the biggest companies tomorrow. Fast forward a week, a month, or a year, and odds are that they will still be at the top of the food chain.
But fast forward any further, and those odds change considerably. In a decade, there just has to be one bad strategic decision, a missed trend, or a colossal managerial mistake, and you have the next Kodak, Blockbuster, or Sears.
A Changing List
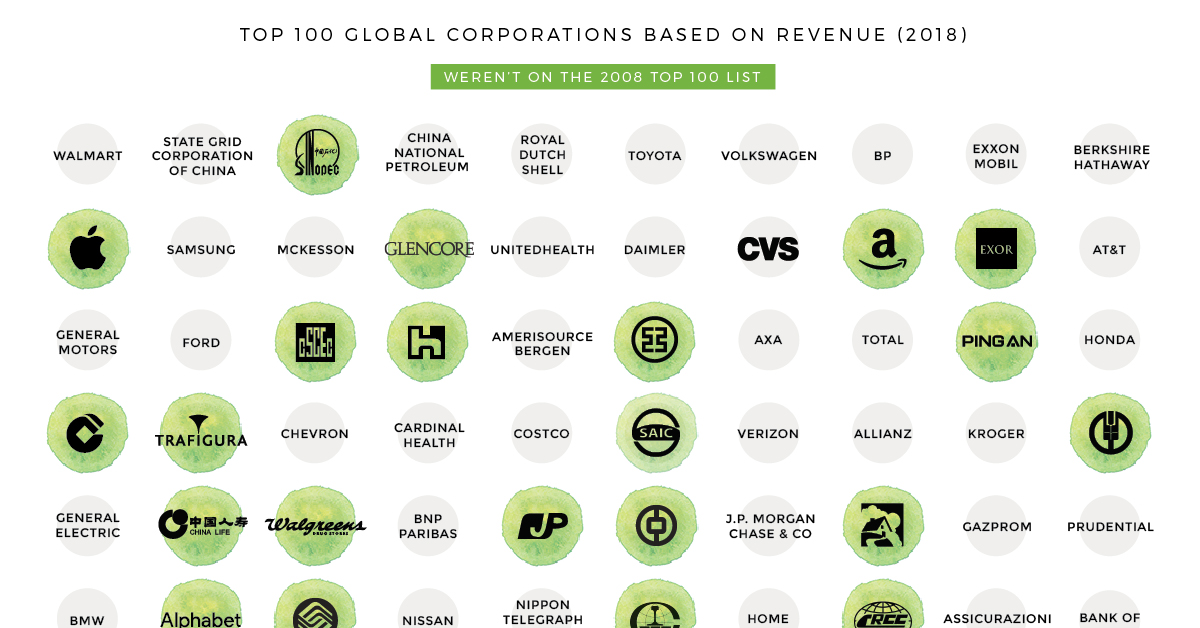
Every year, Fortune publishes a ranking of the world’s top companies by revenue. We compared the 100 highest revenue companies in both 2008 and 2018 to see how much things change in ten years – and the results are pretty astounding.
The most fundamental finding: 43 of the 100 companies on top of today’s list were not there ten years ago. Some of the “new” entries, like Amazon or Huawei, are to be expected – but other companies like Microsoft or Apple are more surprising.
In 2008, for example, Apple was ranked just #337 in global revenue, and today it comes in 11th place.
A Closer Look at the Top 10
The full graphic looks at the Top 100, but let’s zoom in just to the very top.
Here were the top 10 companies in 2008:
| Rank (2008) | Company | Country | Revenue |
|---|---|---|---|
| #1 | Walmart | USA | $378.8 billion |
| #2 | Exxon Mobil | USA | $372.8 billion |
| #3 | Royal Dutch Shell | Netherlands | $355.8 billion |
| #4 | BP | UK | $291.4 billion |
| #5 | Toyota Motor | Japan | $230.2 billion |
| #6 | Chevron | USA | $210.8 billion |
| #7 | ING Group | Netherlands | $201.5 billion |
| #8 | Total | France | $187.3 billion |
| #9 | General Motors | USA | $182.3 billion |
| #10 | ConocoPhillips | USA | $178.6 billion |
Ten years ago, oil prices were sky-high and the list was dominated with energy names like Total, Chevron, and ConocoPhillips. Amazingly, ING Group was the only financial company to make the list in 2008, but it has since fallen to #171 globally.
Let’s jump to the 2018 list:
| Rank (2018) | Company | Country | Revenue |
|---|---|---|---|
| #1 | Walmart | USA | $500.3 billion |
| #2 | State Grid | China | $348.9 billion |
| #3 | Sinopec Group | China | $327.0 billion |
| #4 | China National Petroleum | China | $326.0 billion |
| #5 | Royal Dutch Shell | Netherlands | $311.9 billion |
| #6 | Toyota Motor | Japan | $265.2 billion |
| #7 | Volkswagen | Germany | $260.0 billion |
| #8 | BP | UK | $244.6 billion |
| #9 | Exxon Mobil | USA | $244.4 billion |
| #10 | Berkshire Hathaway | USA | $242.1 billion |
While the modern list has just as many energy names, half of them are now Chinese companies like State Grid or Sinopec Group. Meanwhile, the staying power – at least in terms of revenue – of companies like Walmart, Toyota, Royal Dutch Shell, and BP is quite impressive.


Markets
U.S. Debt Interest Payments Reach $1 Trillion
U.S. debt interest payments have surged past the $1 trillion dollar mark, amid high interest rates and an ever-expanding debt burden.


U.S. Debt Interest Payments Reach $1 Trillion
This was originally posted on our Voronoi app. Download the app for free on iOS or Android and discover incredible data-driven charts from a variety of trusted sources.
The cost of paying for America’s national debt crossed the $1 trillion dollar mark in 2023, driven by high interest rates and a record $34 trillion mountain of debt.
Over the last decade, U.S. debt interest payments have more than doubled amid vast government spending during the pandemic crisis. As debt payments continue to soar, the Congressional Budget Office (CBO) reported that debt servicing costs surpassed defense spending for the first time ever this year.
This graphic shows the sharp rise in U.S. debt payments, based on data from the Federal Reserve.
A $1 Trillion Interest Bill, and Growing
Below, we show how U.S. debt interest payments have risen at a faster pace than at another time in modern history:
| Date | Interest Payments | U.S. National Debt |
|---|---|---|
| 2023 | $1.0T | $34.0T |
| 2022 | $830B | $31.4T |
| 2021 | $612B | $29.6T |
| 2020 | $518B | $27.7T |
| 2019 | $564B | $23.2T |
| 2018 | $571B | $22.0T |
| 2017 | $493B | $20.5T |
| 2016 | $460B | $20.0T |
| 2015 | $435B | $18.9T |
| 2014 | $442B | $18.1T |
| 2013 | $425B | $17.2T |
| 2012 | $417B | $16.4T |
| 2011 | $433B | $15.2T |
| 2010 | $400B | $14.0T |
| 2009 | $354B | $12.3T |
| 2008 | $380B | $10.7T |
| 2007 | $414B | $9.2T |
| 2006 | $387B | $8.7T |
| 2005 | $355B | $8.2T |
| 2004 | $318B | $7.6T |
| 2003 | $294B | $7.0T |
| 2002 | $298B | $6.4T |
| 2001 | $318B | $5.9T |
| 2000 | $353B | $5.7T |
| 1999 | $353B | $5.8T |
| 1998 | $360B | $5.6T |
| 1997 | $368B | $5.5T |
| 1996 | $362B | $5.3T |
| 1995 | $357B | $5.0T |
| 1994 | $334B | $4.8T |
| 1993 | $311B | $4.5T |
| 1992 | $306B | $4.2T |
| 1991 | $308B | $3.8T |
| 1990 | $298B | $3.4T |
| 1989 | $275B | $3.0T |
| 1988 | $254B | $2.7T |
| 1987 | $240B | $2.4T |
| 1986 | $225B | $2.2T |
| 1985 | $219B | $1.9T |
| 1984 | $205B | $1.7T |
| 1983 | $176B | $1.4T |
| 1982 | $157B | $1.2T |
| 1981 | $142B | $1.0T |
| 1980 | $113B | $930.2B |
| 1979 | $96B | $845.1B |
| 1978 | $84B | $789.2B |
| 1977 | $69B | $718.9B |
| 1976 | $61B | $653.5B |
| 1975 | $55B | $576.6B |
| 1974 | $50B | $492.7B |
| 1973 | $45B | $469.1B |
| 1972 | $39B | $448.5B |
| 1971 | $36B | $424.1B |
| 1970 | $35B | $389.2B |
| 1969 | $30B | $368.2B |
| 1968 | $25B | $358.0B |
| 1967 | $23B | $344.7B |
| 1966 | $21B | $329.3B |
Interest payments represent seasonally adjusted annual rate at the end of Q4.
At current rates, the U.S. national debt is growing by a remarkable $1 trillion about every 100 days, equal to roughly $3.6 trillion per year.
As the national debt has ballooned, debt payments even exceeded Medicaid outlays in 2023—one of the government’s largest expenditures. On average, the U.S. spent more than $2 billion per day on interest costs last year. Going further, the U.S. government is projected to spend a historic $12.4 trillion on interest payments over the next decade, averaging about $37,100 per American.
Exacerbating matters is that the U.S. is running a steep deficit, which stood at $1.1 trillion for the first six months of fiscal 2024. This has accelerated due to the 43% increase in debt servicing costs along with a $31 billion dollar increase in defense spending from a year earlier. Additionally, a $30 billion increase in funding for the Federal Deposit Insurance Corporation in light of the regional banking crisis last year was a major contributor to the deficit increase.
Overall, the CBO forecasts that roughly 75% of the federal deficit’s increase will be due to interest costs by 2034.

-

 Travel1 week ago
Airline Incidents: How Do Boeing and Airbus Compare?
-

 Markets2 weeks ago
Visualizing America’s Shortage of Affordable Homes
-

 Green2 weeks ago
Ranked: Top Countries by Total Forest Loss Since 2001
-

 Money2 weeks ago
Where Does One U.S. Tax Dollar Go?
-

 Misc2 weeks ago
Almost Every EV Stock is Down After Q1 2024
-

 AI2 weeks ago
The Stock Performance of U.S. Chipmakers So Far in 2024
-

 Markets2 weeks ago
Charted: Big Four Market Share by S&P 500 Audits
-

 Real Estate2 weeks ago
Ranked: The Most Valuable Housing Markets in America