What Caused Short Haul Traffic Decline in the US? - the $34b Question

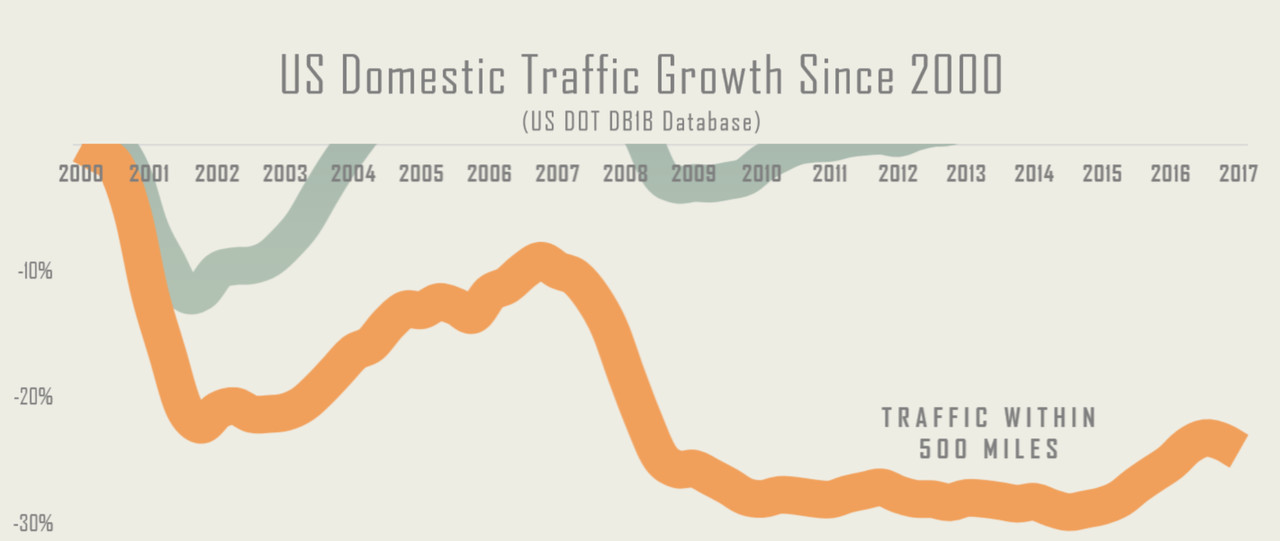
The short-haul U.S. domestic market is shrinking. As the total market has grown almost 30% since 2000, short-haul traffic under 500 miles has declined by the same amount, almost 30%.
After posting the above chart on LinkedIn, several theories by industry colleagues were proposed as to why this discrepancy exists in the U.S. passenger market. Since no single chart can address each of the theories, this article hopes to address each, and to better understand why short-haul traffic in the U.S. is so terribly lagging the rest of the industry.
The U.S. airline industry lost over $770 million in short haul quarterly revenues from reduced short haul traffic in Q1 2017, $33.7 billion since 2000.
Of the many theories posed as to why the short-haul market has suffered so greatly, they can be distilled into three common ideas:
- Airline consolidation has led to a drop in short-haul service
- Pricing has increased disproportionately on short-haul segments
- Increased security requirements and "hassle factor" have made alternative surface transportation favorable to flying on short sectors.
We will look at each of these theories individually; providing further analysis to grasp why short-haul traffic is in decline. First, however, we will look at short-haul traffic within the domestic U.S. in greater detail to better understand the full picture.
Detailing The Decline in Traffic Loss

Breaking down the elements of traffic below 500 miles into 100 mile increments, it becomes apparent that the magnitude of decline is quite varied. Markets below 100 miles have seen a 41% drop in traffic, but also represent the smallest amount of flying. This sector almost entirely consists of inter-island flying in Hawaii, Alaska, and off Cape Cod.
As the sectors become longer, a clear trend emerges showing the drop in traffic since 2000 has affected shorter stage lengths more than the longer. It is important to point out that the impactfulness of this is not due to the amount of flying at these stage lengths, rather the change in traffic. Shorter stage lengths should be expected to have less traffic than medium stage lengths, due to the available alternatives of surface travel. What is significant is that, even with these lower levels of absolute traffic, the relative change has still been higher; a bit of a compounding effect. Something happened since 2000 that disproportionately affected the shortest stage lengths, a clear indication that the impact of September 11th and the resultant security measures have at least had some effect.
Worthy of note as well, is that while the 401-500sm segment is smaller in absolute traffic than the 301-400sm sector, it saw an increase in traffic of just under 2% over the 17 years. While this is growth, it still greatly lags the almost 30% growth of the entire domestic market.

Looking at the geographic breakdown of the traffic loss, we can start to assess the impact consolidation may have had. Clearly, consolidation has had some impact with markets such as STL and CLE showing prominently, however it cannot explain the majority of traffic loss. Markets such as LGA, HNL, DAL, and LAX have all had greater short-haul traffic loss, without being obvious candidates for hub consolidation following the mergers. HNL stands as an outlier, with no opportunity for surface transportation alternatives or consolidation, however the exit of Aloha from the passenger market achieved a type of consolidation effect from the perspective of the traveling public. Hawaiian inter-island traffic has a distinctiveness I plan to examine more closely in future analysis, as the market exhibits fascinating characteristics given it's isolation from the rest of the industry.
A peculiar point to mention is how many markets dominated by Southwest Airlines make this list. At least 9 of the top 20 short-haul traffic losers are in cities where the majority of traffic is flown on Southwest; a surprising result considering Southwest has only seen consolidation out of ATL, MCO, and to a lesser extent, BWI following the purchase of Airtran. We will also follow these breadcrumbs further in future analysis.
To balance out the chart of short-haul market losers, it is appropriate to consider there have been some markets which added short-haul traffic, however the amount of traffic growth has been dwarfed by the losses. Of interest is the growth out of JFK as well as SFO. Virgin America's entrance to the SFO market seems to have been the driving force behind the traffic increase, while Jetblue can claim the short-haul wins from JFK. LGB was an arguably disused airport in 2000, owing much of its growth to the market growing into it's natural size, however CLT's appearance is interesting. The world's hub most dominantly dedicated to connecting traffic, CLT would have been a candidate for traffic contraction following the American / US Airways merger, yet we see a boost in short-haul traffic from this North Carolinian metropolitan area that ranks only 22nd in population according to the US Census estimate in 2016.

While the absolute number of short-haul traffic has declined over the past 17 years, the means by which the traffic moves has not. Remaining very stable during the period, only 10% of passengers flying short-haul markets are willing to connect, while 90% will board a non-stop flight. This comes as no surprise since the time spent during any connection will further push the balance of flying versus ground transportation in the favor of a car. What we can also draw from this is that short-haul traffic is very dependent upon short-haul seats. Without non-stop markets, potential air passengers will choose to drive. Knowing this, a look at whether a reduction in short-haul non-stop seats has influenced the drop in traffic becomes appropriate. To do this, I've decided to look at a single, yet large example of a short-haul market with declining traffic: the Dallas to Houston market.
Dallas and Houston - An Anecdotal Look at a (once) Large Short-Haul Market
At 240 miles, the Dallas to Houston market falls squarely into the range where we are seeing such loss in traffic. Since the two metropolitan areas have the 4th and 5th largest populations in North America, it becomes an interesting proxy for short-haul traffic loss across the country.

The traffic loss between Dallas and Houston exceeds its expected magnitude based on the stage length, with a loss of almost 60% of traffic since 2000. This reduction in air travel demand is staggering when you consider Dallas and Houston populations grew by 39% and 45% respectively during the same period. Smaller than only New York, Los Angeles, and Chicago, Dallas and Houston together represent 4% of the population of the United States, however cannot sustain current levels of air traffic between each other. American, Southwest, and United have all reduced capacity on the market by reducing seats and flights at similar levels. The capacity reduction has lagged the traffic drop strongly suggesting capacity is reacting to demand, rather than the opposite. This counters the idea that traffic has responded to airlines' reduction in capacity, rather than the airlines responding to declines in traffic; a very apparent conclusion when you consider the extremely high yields on short-haul traffic. This theory holds true when looking beyond Dallas and Houston to the overall domestic market.

Another theory put forward was that fare increases have made the short-haul traffic unviable for passengers willing to consider a car. When looking at the Dallas to Houston market this does seem to have some effect. Passenger numbers have clearly dropped while fares have risen, however the timing of each offers some clues. As traffic dropped immediately following 9/11, so did fares, yet traffic did not respond. Fares stayed constant without any reaction from traffic, at which point the market became inelastic. Dallas to Houston has essentially turned into a business-only market, with fares climbing to the level an executive would be willing to pay to complete a needed business trip.

While rising fares seem to have had an impact on lower traffic on the Dallas to Houston market, it has not been the case across the broader domestic market. As shown in the chart to the right, average fares on other short-haul markets have slightly declined, yet the traffic loss has continued. As such, the conclusion is that while fare increases can impact an individual market's traffic, it is not the culprit nationwide.
The Airport "Hassle Factor" and its Impact on Short Haul Traffic
Finally, we take a look at the third theory that new security procedures and airport "hassle" factor have had a negative impact on short-haul traffic, upsetting the value equation for passengers who are choosing between flying or driving. This is probably the most difficult to correlate, however by answering the other possible reasons we can reasonably determine the impact of hassle.

Anyone who lives in the Houston or Dallas area (such as yours truly) understands the idea of urban sprawl. It is nearly impossible to find your destination within the city without the use of a car, regardless of whether you arrived via airplane or not. This adds an incremental commute on either end of a trip from an airport to an outer-core place of business, which could be avoided by avoiding the airport entirely and driving directly.

Using the large Dallas suburb of Plano as an example in the chart to the left, you can start to see the tenuous balance of the drive or fly decision. Assuming a 45 minute commute from the ultimate origin to the security line, an hour before departure, on hour flight, and a 45 minute commute from gate to ultimate destination, a potential airline customer will see a total air-related travel time of 3 hours and 30 minutes. This 3 hours and 30 minutes could be compared to driving direct, which would place the customer about 30 minutes outside of Houston (give or take traffic). By adding in an extra hour of "hassle", the balance of time shifts in favor of the car. When you consider the flexibility offered of having one's own car, along with the lower costs associated with driving versus flying then renting a car or taking a taxi, it starts to become apparent why traffic between these two cities is only 40% of what it once was. The air market has been relegated to passengers who would like to make a day trip without having to drive the 8 hours, and those who are not very sensitive to price to do so; in effect, the business traveler.
With almost $34 billion in lost revenues from lost short haul traffic, is it any wonder the airlines were forced to overhaul their business models through bankruptcy?
As such, the additional hassle of air travel seems to have had a devastating (albeit not exclusive) effect on short haul air travel. The U.S. airline industry has lost over $770 million in short haul quarterly revenues from reduced traffic in Q1 2017 alone. Over the past 17 years, this adds up to a $33.7 billion (with a "B") reduction in revenues from passengers flying short-haul sectors below 500 miles. Is it any wonder almost all airlines were forced to recreate their business model through the many bankruptcies?
While not all of this can be blamed on additional security measures and hassle, we can isolate all other potential causes to the markets in which they affect. Fares may not have increased on most short-haul markets, however on the few that it did, the decrease in traffic seemed to accelerate. Some markets consolidated to add to the reduction in seats and thereby non-stop options for short-haul passengers, however even without consolidation effects, we still see a drastic decrease in traffic.
One thing is abundantly clear: something fundamental changed shortly after 2000 in the short-haul market. While it is impossible to quantitatively attribute this fundamental change to additional security and airport hassle, the lack of other viable explanations makes it difficult to deny.
Sources:
All traffic charts were sourced from DOT DB1B Data
Population density information was extracted from the U.S. Census Bureau 2016 estimates
Plano driving time range map was created at FreeMapTools.com
One of America's Most Honored Weather Scientists
6yJust came across your article. Ironically, I read it while on vacation in SAT...and, my wife and I drove from ICT. Why? The hassle factor. I used to nearly always drive from ICT to OMA, STL, DSM, DFW and DEN. Now, I drive. To me, the hassle factor is hardly just the TSA. It is rude employees, ridiculous fares ($800 r/t ICT to DEN), and being cramped so tight that using a laptop (i.e., generating productive time) is impossible. So, this businessperson now drives for anything less than about ten hours; business or personal.
Chief Technology Officer
6yGreat article, very thought provoking. You're emphasis on consolidation as a cause of decline in short haul markets sounds as if consolidation reduced demand, when I believe you meant that consolidation caused passenger travel patterns to change. This however contradicts the notion that the entirety of the $34B is "lost" and is instead simply shifted. To gain insight into this you cold look at the distribution of lag (or lack there of) between capacity reduction and demand reduction.
Airport Planner
6yWell this is certainly something to ponder and is a very interesting read. I may try to do a similar analysis of NY to Washington DC to see how it compares to DFW > HOU (if you don't mind). I agree with you that the "hassle factor" of TSA is a hinderance to short haul and it's interesting that in 2014/2015 the traffic within 500 mi starts to increase, which could correlate to the expansion of PreCheck. Based on your research (granted I know it may be limited), do you think these regional startups will survive filling some of these short haul routes?
Aviation Planning Executive at HNTB
6yGreat article. If you remove stage length > 400nm the drop off in short haul is even more pronounced. I vote it's the hassle factor. I travel JAX-ATL frequently (350 mile drive) and air/ground is almost equivalent....so I drive it >90% of the time.
In the narrow case of the Houston-Dallas market, I wonder if the expiration of the Wright Amendment was a factor. I don't have statistics, but there was undoubtedly some Dallas O&D traffic that had been connecting through Houston and is not able to fly directly from Love Field.