Invoking Azure ML Web Services from Excel, Using Power Query
This post is authored by Amita Gajewar, Senior Data Scientist at Microsoft.
Problem Statement
Microsoft Azure Machine Learning Studio lets data scientists build machine learning models for a variety of problems that require predictive analytics capabilities. The Studio publishes these models as web services which can then be invoked via REST APIs, i.e. to send it data and get back predictions.
For business analysts who spend a lot of time manipulating and visualizing data in spreadsheets, it would very useful to be able to invoke an Azure ML web service from right within that environment, by passing in appropriate parameters and have the results populated back into the spreadsheet. To go one step further, they would be able to process and format the returned results, before displaying them in tables or charts.
In this post, we explain how to accomplish this using Power Query and macros within Excel.
Power Query provides a method to query, combine and refine data across a wide variety of sources including databases, the web, Hadoop and more. For illustration purposes, I create a Power Query to invoke an Azure ML web service that forecasts various financial metrics (e.g., revenue, EPS, etc.) for the 30 Dow Jones companies. This web service accepts two input parameters - the desired Company Name and Financial Metric. It then uses the historical quarterly data available for that company for a given financial metric, builds time-series based models, and generates forecasts for the upcoming four quarters. It then returns the actuals (i.e. historically observed values), forecasts, and confidence intervals for the specified financial metric of a given company.
Step 1: Input Parameters to the Azure ML Web Service
As a first step, let's accept input parameters from the user that we will pass in to the Azure ML web service. One of the simplest ways this can be achieved is by designating certain Excel cells as input cells. In the figure below, I specify these input parameters as "Microsoft" and "TotalRevenue", as seen in cells B4 and C4. The button next to these cells, labelled "Forecast Financial Metrics", has an associated macro that will invoke the appropriate Power Query, which in turn will invoke an Azure ML web service. I will explain the code for this in step 4 below, after first explaining how to write the Power Query.
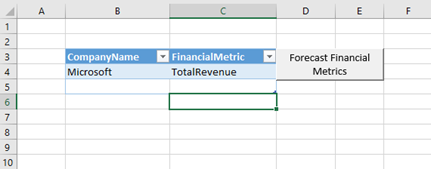
Figure 1: Input parameters to the Azure ML web service.
Step 2: Use Power Query to Invoke the Azure ML Web Service
Now, I will walk you through the code snippets of the Power Query that I created in the same Excel spreadsheet. You will need to use an advanced editor to write your own custom script. To write this custom Power Query I have used the Power Query M formula language. The documentation for M formula language can be found here.
A) The code snippet that reads the input parameters, CompanyName and FinancialMetric, is below:
Source = Excel.CurrentWorkbook(){[Name="Table1"]}[Content],
Company = Text.From(Source{0}[CompanyName]),
Metric = Text.From(Source{0}[FinancialMetric]),
B) Let's format these parameters as needed by the Azure ML Web Service and invoke it. Below is the sample code snippet where I create a variable, PostContents, that contains the formatted input. You can format the input using simple string/text operations supported by M. Once the inputs are formatted correctly, I invoke the Azure ML web service by using Power Query M function Web.Contents(). As part of the input arguments to this function, I provide the URL of the Azure ML web service, Content (formatted input), Headers, and Authorization (api-key corresponding to the web service). The Web.Contents() function invokes the specified web service, and I store the returned results in the variable GetMoneyForecast. Since I want to format these results into an Excel table, I use M Query functions such as Json.Document() and Record.ToTable() to store the results in a Table format.
PostContents1="{""Inputs"":{""SelectCompanyAndMetric"":{""ColumnNames"":[""Company"",""Metric""],""Values"":[[",
PostContents2 = Text.Combine({"""", Company, """,""", Metric, """"}),
PostContents3 = "]]}},""GlobalParameters"":{}}",
PostContents = Text.Combine({PostContents1, PostContents2, PostContents3}),
GetMoneyForecast= Web.Contents("<AML web service url>",
[Content=Text.ToBinary(PostContents), Headers=[#"Content-Type"="application/json", #"Authorization"="<apikey>"]]),
jsonStr = Json.Document(GetMoneyForecast),
Results = Record.ToTable(jsonStr),
C) As a next step, let's format the results returned by the web service. In this example, I perform some post processing on the Results object to get the values (returned by the Azure ML web service) and corresponding column names. Further, I use methods like Table.TranformColumnTypes() and Table.Sort() so that the data types are appropriately assigned and to ensure that data is displayed in chronological/sorted order (i.e. by the date column).
Value = Results{0}[Value],
..
..
ColumnNames = value[ColumnNames],
Values = value[Values],
Table = Table.FromRows(Values, ColumnNames),
ChangedType = Table.TransformColumnTypes(Table, {{"isForecast", type number}, {"lowerBound", type number}, {"upperBound", type number}, {"data", type number}, {"date", type text}}),
SortedTable = Table.Sort(ChangedType, {{"date", Order.Ascending}}),
ReorderedColumns = Table.ReorderColumns(SortedTable, {"company", "metric", "date", "isForecast", "lowerBound", "upperBound", "data"}),
The output that I received has a column isForecast that indicates if the value in the data column is actual or forecasted value. Here is the code snippet of some more column operations I perform, so that my final table contains two new columns, ActualData and ForecastedData, depending upon whether the isForecast flag has a value of one or zero. Another useful operation is to add an index column using the Table.AddIndexColumn() function.
InsertedCustom = Table.AddColumn(ReorderedColumns, "ActualData", each if [isForecast] = 0 then [data] else ""),
InsertedCustom1 = Table.AddColumn(InsertedCustom, "ForecastedData", each if ([isForecast] = 1) then [data] else ""),
RemovedColumns = Table.RemoveColumns(InsertedCustom1, {"isForecast", "data"}),
ReorderedColumns1 = Table.ReorderColumns(RemovedColumns, {"company", "metric", "date", "ActualData", "ForecastedData", "lowerBound", "upperBound"}),
ChangedType1 = Table.TransformColumnTypes(ReorderedColumns1, {{"ActualData", type number}, {"ForecastedData", type number}}),
The snapshot of the final output is shown in Figure 2 below. Note that for sharing the snapshot below, I have scaled the revenue numbers and omitted data for the years 2001 to 2013.
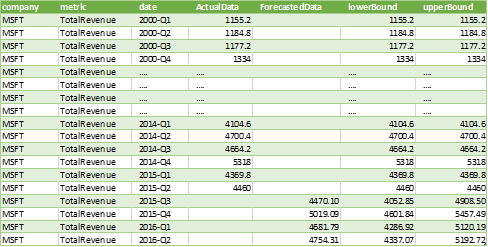
Figure 2: Output of the Azure ML web service.
Step 3: Format the Results into a Chart
Once you have formatted the output into a desired schema, you can also include an Excel chart that picks up the data from those cells and plots them accordingly, as shown in Figure 3 below (Note: The data is scaled for display purposes). In addition to an Excel chart, you can also utilize the capability of Power Pivot to display and explore this data using Power View. Refer to this article on how Power Query and Power Pivot can be used together.
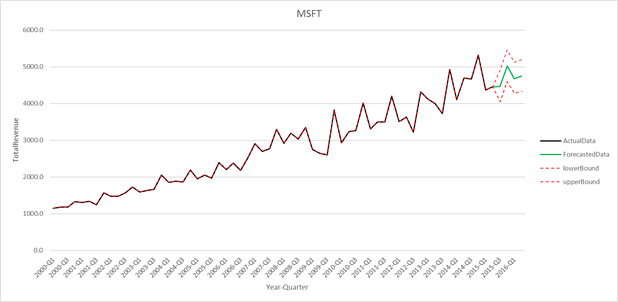
Figure 3: Excel chart representing the output of the Azure ML web service.
Step 4: Adding a Macro to Invoke Power Query
In the final step of this process, I will explain how to provide an interface to the user so that Power Query can be invoked by clicking a button in the Excel spreadsheet (as shown in Figure 1 above).
To achieve this, I add a button to the Excel spreadsheet and attach a macro to it. Using Microsoft Visual Basic for Applications, we can create a module that invokes the Power Query that has been created. Below is the sample code of the macro UpdateMoneyForecastQuery that I created. This essentially refreshes the connection to the MoneyForecastQuery whenever a user clicks on the Forecast Financial Metrics button shown in Figure 1. This in turn triggers the execution of the query with the latest input parameters as specified by the user, and refreshes both the Excel table (Figure 2) and chart (Figure 3) with latest results returned by the Azure ML web service.
Public Sub UpdateMoneyForecastQuery()
Dim cn As WorkbookConnection
For Each cn In ThisWorkbook.Connections
If cn = "Power Query - MoneyForecastQuery" Then cn.Refresh
Next cn
End Sub
Conclusion
Given the widespread usage of Excel, the ability to query an Azure ML web service and manipulate its results from within an Excel spreadsheet can prove to be a very handy feature for business analysts and other users who are interested in incorporating predictive analytics into their work. Such users can now consume the output of Azure ML without having to learn how to use Azure ML Studio. This capability also helps data scientists to deliver forecasting capabilities to their users without the need to have users' data permanently stored in the cloud.
Amita
Resources
- Power Query M Reference: https://msdn.microsoft.com/en-us/library/mt211003.aspx.
- Data Analysis Expressions (DAX) Reference: https://msdn.microsoft.com/en-us/library/gg413422.aspx.
- Introduction to Microsoft Power Query for Excel: https://support.office.com/en-us/article/Introduction-to-Microsoft-Power-Query-for-Excel-6e92e2f4-2079-4e1f-bad5-89f6269cd605.
- Power View – Overview and Learning: https://support.office.com/en-us/article/Power-View-Overview-and-Learning-5380e429-3ee0-4be2-97b7-64d7930020b6.
- Power Pivot – Overview and Learning: https://support.office.com/en-us/article/Power-Pivot-Overview-and-Learning-f9001958-7901-4caa-ad80-028a6d2432ed?ui=en-US&rs=en-US&ad=US.
- Getting Started with Azure Machine Learning Studio: https://azure.microsoft.com/en-us/resources/videos/getting-started-with-ml-studio/.
- Deploy an Azure Machine Learning web service: /en-us/azure/machine-learning/machine-learning-publish-a-machine-learning-web-service.
- Azure Machine Learning Documentation: /en-us/azure/machine-learning/.