


Introduction
In many countries, the political elite is mainly conceived of rather wealthy and educated middle-aged to senior men of the dominant ethnicity. National parliaments are arenas that fit this description. According to Norris, ‘legislatures worldwide include more of the affluent than the less well-off, more men than women, more middle-aged than young, and more white-collar professionals than blue-collar workers’ (Reference Norris1997: 6). Substantiating Norris’ claim, research on the social composition of parliaments has examined aspects of gender (Wängnerud, 2009), economic standing (see Carnes, Reference Carnes2013) and, more recently, the issue of ethnicity (e.g. Hughes, Reference Hughes2011). However, quite absent from this literature is a discussion of age representation, despite the fact that similar normative claims for the representation of younger cohorts can be made as for the representation of women, social classes, or minority groups.
There are good reasons, both from a normative and from a policy point of view, to argue that the young cohorts of the population should be represented in elected assemblies. Normatively, the dominant presence of the elderly in legislatures cannot be justified on the basis of their ‘natural superiority of talent’ (Phillips, Reference Phillips1995: 65). When it comes to policy, various age cohorts may have contrasting views on welfare spending (i.e. middle-aged citizens may favor lower taxes, whereas younger ones might favor high spending on education and welfare). From a policy perspective the composition of parliaments matters, as well. For instance, Murray highlights that ‘the narrow social composition of legislatures suggests either that certain groups within society are less capable of representing others, or that something has gone awry in the recruitment process’ (Reference Murray2014: 520). In fact, in relation to the political sphere, young citizens have been described as an ‘excluded majority’ [Inter-Parliamentary Union (IPU), 2014], with an insufficient legislative presence. Yet, as recently noted by Tremmel et al. (2015), the literature on representation has rarely examined the standing of younger age groups in parliaments.
If the representation of different age groups in parliament matters, then it is important to determine why some parliaments have younger representatives than others. This article aims to explore this variance across countries. Focusing on institutions, we hypothesize that proportional representation (PR), lower candidate age requirements, and age quotas should influence the presence of young deputies in parliament. We test the three factors’ influence in a multivariate framework with a data set comprising around one hundred countries/ elections. After controlling for a host of possible covariates we find that two of the three variables behave as expected. PR systems increase the share of young deputies. The same applies to candidate age requirements: allowing younger candidates the right to run produces, on average, a higher share of the young in parliament. In contrast, age quotas do not have any influence on the share of young deputies as they are too low and too selectively applied to bolster the legislative presence of youths.
This article proceeds as follows: we first discuss age representation and its normative repercussions. Second, we review the scarce literature on age representation and discuss this study’s focus. Third, we explain the variables, data, and methods. We then present the results of our quantitative study. Finally, we summarize our findings, discuss their implications and offer some suggestions for future research.
Young parliamentarians: an important category
It is true that age cannot be compared with other characteristics such as gender or minority status. Gender and ethnicity are features that are (most often) stable across an individual’s life span, but age is not: individuals inevitably become older and therefore leave the category of being young. Yet, this does not make this topic less important. On the contrary, the study of the representation of young adults is important not the least because they are likely to have different policy preferences than the elderly. Ideology and policy preferences change with age. For example, younger cohorts might favor investments in education and hold pro-globalization attitudes. In contrast, the elderly may support higher pensions (Metz, Reference Metz2002) and might want to preserve traditional customs, as well as being wary of global integration (Shin, Reference Söderlund, Wass and Blais2001). For instance, European youths are more supportive of policy proposals related to same-sex marriages, in comparison to older people (McEvoy, Reference McEvoy2016).
Traditionally, parties have seen seasoned politicians as suitable candidates for office, whereas they have perceived younger ones as rather unexperienced, invoking the notion that competence among politicians may come with age. Indeed, Plato argued more than two thousand years ago that the philosophical maturity of leaders was not achieved until the age of 50 (McKee and Barber, Reference McKee and Barber2001), an assertion, we believe does no longer hold in the 21st century. With ever increasing education, globalization and the digitalization of the world, all of which are pushed by the younger cohorts of the population, there is a sufficiently large pool of young candidates suitable and competent to run for office in basically all countries.
From a normative perspective, the presence of outgroups in elected assemblies such as the young is important (Childs, Reference Childs2004).Footnote 1 For one, the magnitude of their presence in the legislature shapes the degree to which they are able to be spokespersons for other young individuals. Equally important, young parliamentarians might differ from older parliamentarians in terms of agenda setting and the introduction of topics relevant to youths. In addition, a high presence of the young could change political discourses both inside and outside parliaments (Celis et al., Reference Celis, Childs, Kantola and Krook2008). For example, research on the parliamentary presence of ethnic minorities highlights that representation of these groups helps foster their emancipation in other areas of society (Banducci et al., Reference Banducci, Donovan and Karp2004). We assume that the same could be true for the young. In other words, the presence of young deputies in legislatures may strengthen the representational links of these groups; it might foster positive attitudes among youths toward government and it could increase government responsiveness toward demands from disadvantaged groups.
Yet, as of 2017, adults aged 35 years and below are underrepresented in parliaments, with only 10% representation in legislatures across the globe, on average. To highlight this underrepresentation, Figure 1 shows that the age group 18–35 comprises more than three times as many individuals, globally, than the age group 60 and above. However, in many parliaments the latter age group is two, three, four, or even five times more represented than young adults. The patterns of age representation in parliament in our study also reflect these discrepancies. In our sample of around one hundred countries the mean age in the voting population is 43.6 years (see Appendix 1 for mean and median figures on age representation). This is in contrast to the age distribution among parliamentarians in our data set, with a mean age of 50.2 years. In particular, in low-income countries with a demographic distribution skewed toward youths, the gap between the average age of parliamentarians and the average age of the voting population is very large. For instance, in India, the mean age in the voting age population is below 39 years. However, the average age of members in the lower house of the Indian Parliament, the Lok Sabha, is almost 55 years.
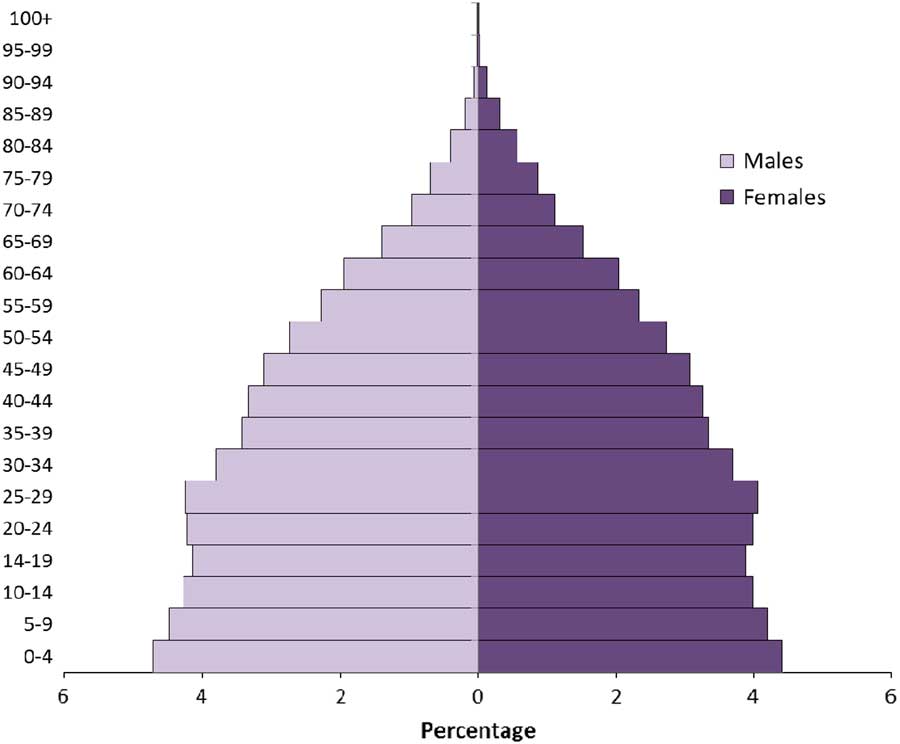
Figure 1 Distribution of the world’s population by age and sex, 2015. Source: United Nations, Department of Economic and Social Affairs, Population Division (2015).
Adequate representation of the young: a topic that needs more attention
Age is an important topic in the political behavior literature and dozens of studies have analyzed the lack of political participation of adults in their 20s and early 30s (see Melo and Stockemer, Reference Melo and Stockemer2014). For example, Bhatti et al. (Reference Bhatti, Hansen and Wass2012) report that, in Finland, voter turnout among young voters is 20 or 30 percentage points lower than among the middle-aged and elderly. Similarly, research in industrialized societies shows that young adults are more skeptical of the way democracy works and feel turned off by politicians and parties (Blais and Rubenson, Reference Blais and Rubenson2013). This, in turn, increases political apathy.
In fact, the literature points more and more to a vicious cycle between declining political sophistication of the young, their lack of (conventional) political participation and their lack of representation (Figure 2 parsimoniously illustrates of how the three features of this process reinforce one another) (Henn and Foard, Reference Henn and Foard2012). Because of societal tendencies, including changes in political socialization, a lack of civic education in school and maturation at a later age (just to name a few factors), young voters are less and less interested in conventional politics and participate less and less in the political process (Milner, Reference Milner2010). This increasing political apathy renders the voice of young adults less important because parties and candidates gain relatively little from catering to the interest of a group which largely refrains from voting. As rational players, parties are hesitant to put issues important to the young, such as education spending, on the political agenda, because there is not enough demand for these issues. The same reluctance applies to the nomination of candidates: since youths tend to abstain from voting to a larger extent than the middle-aged or elderly, there is less of an incentive for parties to specifically nominate younger candidates. Hence, they do not supply a sufficiently high number of candidates to allow for the adequate representation of the young. Completing this vicious cycle, youths can be expected to become even more indifferent to the representative system as they realize that their agenda is neglected and that candidates bear little resemblance to themselves.Footnote 2
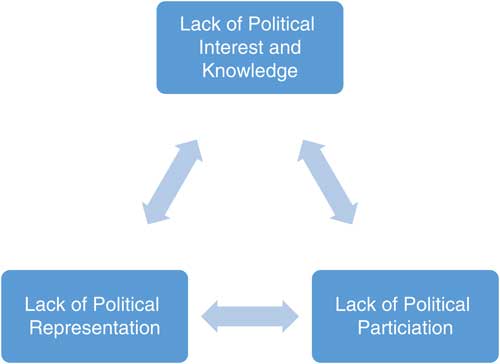
Figure 2 The vicious cycle of political apathy of the young.
One way to break this vicious cycle is to increase young individuals’ political representation. Granting the young adequate representation could allow younger cohorts to bring their topics of importance to the political agenda, which, in turn, could entice young adults to participate in the political process. This becomes the more important, considering that the share of young individuals is increasingly growing in low-income societies [United Nations Development Programme (UNDP), Reference Tremmel, Mason, Haakenstad and Dimitrijoski2013]. Aware of the negative repercussions of the vicious circle described above, political actors and international organizations have recently started to put the unequal representation between age groups on the political agenda. For example, several high-level reports issued by the United Nations have called attention to the lack of participation and representation in politics of young adults around the world and have warned of the growing apathy among the young (see UNDP, Reference Tremmel, Mason, Haakenstad and Dimitrijoski2013, 2014).
More concretely, a handful of countries have enacted policies to counter traditional recruitment mechanisms to political posts that tend to benefit the middle-aged and the elderly. For instance, Rwanda and Uganda have created reservation schemes for ‘youths’, where a quota ensures a certain percentage of the seats in parliament for candidates under a certain age (see Tremmel et al., 2015). More indirectly, some parties have pushed the installation of youth wings within their political structures. In addition, some countries – albeit few – have witnessed the emergence of so-called youth parties, such as the UK Youth Party or the Youth Party of India that are composed of young adults and that fight for the demands of the younger generations (Hooghe et al., Reference Hooghe, Stolle and Stouthuysen2004).Footnote 3
The academic literature has also started to pay some attention to either the vicious cycle of political apathy of the young, or the topic of political representation, more particularly. However, this body of research is still limited. Aside from single-nation studies on related topics that note in passing that the middle-aged and the elderly are overrepresented in national parliaments, there is less than a dozen studies on the representation of various age cohorts (e.g. Norris and Franklin, Reference Norris and Franklin1997; Kissau et al., Reference Kissau, Lutz and Rosset2012; Joshi, Reference Joshi2013; IPU, 2014). We can divide existing works into three types of analyses: first, without providing any solid proof for this claim, introductory handbooks to the study of government frequently state that legislators are normally middle-aged to senior (e.g. Blondel, Reference Blondel1995: 257). Second, several case studies either explicitly or implicitly mention that there is an overrepresentation of middle-aged and senior individuals among legislators in a set of industrialized countries (see Norris, Reference Norris1997), or in specific countries, including France (Murray, Reference Murray2008), Sweden (Burness, Reference Burness2000), or Switzerland (Kissau et al., Reference Kissau, Lutz and Rosset2012). In more detail, these studies all confirm that the age group between 50 and 60 constitutes the largest share of elected legislators.
Third, a handful of comparative studies explicitly discuss the representation of various age cohorts in parliament. For example, Narud and Valen (Reference Narud and Valen2000) compare age representation in the legislatures in the Nordic countries, confirming the overrepresentation of individuals in their fifties and sixties. Broadening the number of countries to 70, a report published by the IPU in 2014 confirms this finding. According to the IPU two-thirds of the 70 single and lower houses of parliament examined have 2% or fewer young parliamentarians (defined at age 30 or younger). Even more pronounced, the same report finds that all upper houses have less than 6% young adults in their ranks, with three quarters electing no young person at all.
Theory
In this study, we focus on the effect of formal political institutions on youth representation in national legislatures. Institutions are central to the political representation literature. For example, more than 30 years of research on women’s representation have confirmed that the two institutional factors – quota provisions and the electoral system type – are strong predictors of cross-country variation in women’s representation (see Wängnerud, 2009). In terms of quotas, there is strong support that legislative quotas and, to a lesser extent, voluntary party quotas are effective means to boost the share of women in parliament (Krook, Reference Krook2009). In terms of the electoral system type, PR generally increases the representation of women by several percentage points (Matland, Reference Matland2005).
In this article, we argue that what applies to women’s representation should also largely apply to younger individuals: both women and youths are marginalized in politics, a professional field which tends to be dominated by middle-aged to senior men. The mechanisms that relate institutions to women’s representation should also be similar. In this article, we focus on three institutional factors to explain why some countries should elect a higher share of youths than others; (1) the electoral system, (2) candidate age requirements, and (3) quotas.
Electoral system
Our first hypothesis is that PR systems, compared to majoritarian systems, should decrease the age of parliamentarians. There are at least five theoretical arguments to substantiate this expectation. First, single-member majoritarian systems create a zero-sum game for parties. Each district is like a separate election. In order to win, every party faces strong incentives to put forward the candidate that, on average, can garner the most votes. In most districts, middle-aged to senior men of the dominant ethnicity with high education fulfill this profile best (Henig and Henig, Reference Henig and Henig2001). In contrast, the same zero-sum mentality does not exist in PR systems, as parties have an incentive to diversify their slates to appeal to as many constituencies as possible. Party gatekeepers must also think in terms of appeal: in order to attract the young electorate and entice young adults to vote it is beneficial if parties have somebody in their age group on their electoral slate to whom youths can relate to. Hence, adding young candidates to the list can be beneficial for parties in a PR system (see Matland, Reference Matland2005).
Second, PR systems are party centered. This means that party elites can push forward certain types of candidates such as the young (Norris, Reference Norris2006). In contrast, majoritarian systems are candidate centered. Such systems disfavor young candidates in two ways: (1) in order to win the primary of a major party, candidates need a political record, name recognition, as well as financial and organizational resources to campaign (Ashe and Stewart, Reference Ashe and Stewart2012), qualities that senior and more experienced candidates rather than young ones are likely to have. In addition, there are normally no primaries in PR systems: this, in turn, eliminates one hurdle that young individuals must overcome to gain candidate status.
Third, the incumbency advantage – which is more pronounced in first past the post systems – is likely to hurt young individuals. For example, in single-member district countries, such as the United States, with a retention rate of 90% from one election to the next, there are few seats open for young candidates (Ashworth and Bueno de Mesquita, Reference Ashworth and Bueno de Mesquita2008). In contrast, turnover rates are higher in PR systems; this increases the chances of outgroups or underrepresented groups such as the young to access candidate lists (Matland and Studlar, Reference Matland and Studlar1996). Fourth, the mechanical effects of PR and plurality are different. PR normally tends to generate multiparty systems, whereas plurality favors two-party systems. Multiparty systems could indirectly benefit young individuals (Joshi, Reference Joshi2013). Because the barriers to gain representation are lower, progressive parties such as Green parties can gain sizeable representation in PR countries (e.g. in Germany and the Nordic countries). In terms of policy, these progressive parties push post-materialist values such as environmental protection, gender equality, or direct democracy. In terms of political appeal, these parties are not only most popular among young voters but they also represent a new generation of representatives: members of parliament (MPs) that are younger, less traditional, and more geared toward issues interesting to young voters, such as the abolishment of the draft or decreasing the minimum voting age (Siaroff, Reference Shin2000).
Fifth, and this is related to the third argument, PR systems are more prone to a contagion effect; that is, if one party starts to nominate greater numbers of young candidates other parties are likely to follow suit. In other words, under PR a party can likely respond positively to calls to nominate young contestants in greater numbers (Fawcett, Reference Fawcett2002). For one, it does not have to convince incumbents or other senior parties to step aside, as there might still be space on the party list to also nominate young politicians (Joshi, Reference Joshi2013). In addition, the gains for diversifying the electoral slate might be larger under PR. Adding just a few young candidates to the list could give the party a younger and more dynamic output. The same would not necessarily happen in first past the post systems, even if a party was to nominate several young candidates (Matland and Studlar, Reference Matland and Studlar1996).
There is also some empirical evidence in favor of the proposition that PR fosters the higher percentages of young individuals in parliament. Focusing on the representation of distinct age groups in 14 Asian countries, Joshi (Reference Joshi2013) finds that PR fosters the representation of young adults. In a more restricted study, where he concentrates on characteristics of MPs in Bangladesh, Bhutan, India, Nepal, Pakistan, and Sri Lanka, Joshi (Reference Joshi2015) confirms that PR positively affects the descriptive parliamentary representation of young adults.Footnote 4 Building on Joshi, we hypothesize that PR systems should trigger some higher representation of young adults.
Age of candidacy law
As a second institutional factor, we hypothesize that the minimum age candidates must have to stand for office should influence the composition of parliaments. While the voting age is 18 in most countries, the candidacy age requirements differ from 18 years, for countries such as Germany, to 35 for Tajikistan. It is likely that formal age limits at 25, 30, or 35 years should hinder young politicians’ access to parliament both directly and indirectly: directly since such rules hinder the youngest candidates from running and indirectly since it sends the signals to potential candidates that politics is not a business for young people (UNDP, Reference Tremmel, Mason, Haakenstad and Dimitrijoski2013). In addition, having different requirements for voting and to run for office might send the message to young individuals that politics is not their domain: being only allowed to vote, but not to apply for elected office, implies that they are not full political citizens, yet (IPU, 2014).
Age quotas
The women’s representation literature nearly unanimously agrees that legislative gender quotas increase the share of elected women (Krook, Reference Krook2009). Guaranteeing women a set percentage of the seats in parliament or on electoral lists, quotas are an efficient means to boost the representation of female representatives. The same rationale should apply for the representation of the young. If there are reserved seats or legal provisions in a country forcing parties to nominate young candidates, the younger cohorts of the population should be more highly represented and the national parliament, in general, should have a higher share of young MPs (Krook and O’Brien, Reference Krook and O’Brien2010). According to recent publications (UNDP, Reference Tremmel, Mason, Haakenstad and Dimitrijoski2013; IPU, 2014; Quota Project, 2016) there are four countries with reserved seats for youths in the parliament and seven countries with political parties using youth quotas.Footnote 5 Yet, because few countries and parties have adopted age quotas and the quota provision is below 10% in all cases, we think – contrary to the electoral system type and candidate age requirements – that quotas should play no, or only a limited, role in accounting for variation in youth representation across countries.
Control variables
While it is the main goal of this article to evaluate the relationship between institutions and age representation in parliament, we still have to control for other possibly relevant factors which might also account for why some parliaments are younger than others. The control variables are regime type, development, corruption, mean age of the voting age population, and the share of Muslims in the population. We mainly derive the rationale for inclusion of these variables from the women’s representation literature and apply it to age representation.
Regime type
In theory, a democratic state ought to strive to include individuals of all genders, backgrounds, religions, and ages into positions of power. In practice, this ideal is questioned when it comes to women’s representation. For instance, Paxton et al. (Reference Paxton, Hughes and Painter2010) find that democracy levels have a positive influence on the share of elected women in parliament. When it comes to the representation of various age groups, there is one study by Golosov (Reference Golosov2014) focusing on Russia, which confirms that a country’s striving toward greater authoritarianism hurts young individuals’ access to parliaments. In this study, we control for whether democratic systems are more responsive than non-democracies to claims for a more balanced representation in terms of age.
Development
According to the influential post-materialism thesis, economic development is accompanied by changing values in the citizenry. In particular, the transformation from industrial – to post-industrial – or service sector societies should trigger a change in dominant values. Whereas in agrarian and, to a lesser degree, in industrial societies, traditional, and materialist values ought to prevail, service sector societies are characterized by post-materialist values, where people are more likely to favor gender equality, environmental protection, and participation in decision making (Inglehart and Norris, Reference Inglehart and Norris2003). This post-materialist shift tends to result in a higher demand of having newcomers in elected office and should therefore be beneficial to the representation of outgroups such as minorities, women, and the youth. This applies even more so, considering that young individuals are pushing these changes. Consequently, we assume that higher levels of economic development should be conducive to younger parliaments.
Corruption
We believe that young candidates may face obstacles in becoming elected in highly corrupt contexts. Besides formal political institutions there are also informal procedures which might influence the representation of various groups in parliament. One of these might be corruption: corruption ‘indicates the presence of “shadowy arrangements” that benefit the already privileged’ (Sundström and Wängnerud, Reference Siaroff2016: 355). Rather than the young, these privileged are senior individuals, who are often the agents of these corrupt networks. In Bjarnegård’s words, the existence of corruption or clientelism should benefit candidates that are within the dominant norm: ‘Only those with access to networks, those with connections within the local or national elite, those with resources to finance corrupt behavior, and those who are already influential in society are in positions to be considered assets in clientelist networks and are the only ones who will be trusted with the sensitive nature of the exchange’ (Reference Bjarnegård2013: 37). For this reason, we believe that the middle-aged and the elderly should be overrepresented in parliaments where corruption is widespread.
Share of Muslims in the population
In particular in its traditional form, Islam as a religion is characterized by a traditional life style, patriarchy, and hierarchical power structures (Weiffen, Reference Wass2004). To support this claim, research shows that a strict and traditional interpretation of Islam prevents outgroups such as women, religious minorities, and the young to advance in politics (Blaydes and Linzer, Reference Blaydes and Linzer2008). For example, Norris (Reference Norris1999) indicates that societies with a high share of Muslims in the population tend to have a poor record of including women in their legislatures. We believe that the political elite in Muslim dominant countries may also be more reluctant than others to welcome young cohorts in their parliaments: this should apply even more so considering that recruitments to elite positions are frequently made by seniority.
Mean age in the voting age population
The age distribution within the voting age population may be an important predictor of the share of young deputies in parliament. If voters are seeking representatives that reflect their own interests, they may choose candidates that are roughly their age (Henn and Foard, Reference Henn and Foard2012). For the individual level, this would imply that adults in the 20s and 30s should be more inclined to vote for candidates who are roughly their age, either by selecting certain candidates or supporting parties with more young candidates on their party lists. For the macro-level, this would then entail that voting age populations that are younger ought to have parliaments with a larger share of youths, on average.
Operationalization of variables
Dependent variable
In contrast to other measures of group representation, such as women’s representation, the operationalization of different age categories or young parliamentarians is somewhat tricky. This applies even more so, considering that previous studies operationalize age groups in different ways. Joshi (Reference Joshi2013), for instance, discusses that the meaning of age varies across cultures: what is ‘youth’ may differ in say Japan compared to Nigeria. After careful consideration, Joshi opts for a rather broad operationalization and includes in the category of the ‘young generation’ all individuals of 40 years and below. Similarly, the descriptive report on age representation by the IPU (2014: 2) notes that the group ‘young parliamentarians’ can include people below 30, 35, 40, or even 45 years of age. In the end, the IPU considers ‘“young” anybody under the age of 45’ (IPU, 2014: 2). More restricted, Norris and Franklin (Reference Norris and Franklin1997) talk about ‘the younger generation’ as people of 35 years of age and below.
We operationalize age representation in the two most common ways (see IPU, 2014; Joshi, Reference Joshi2015): that is, by the percentage of deputies aged 35 years and below and 40 years of age and below at the time of the election, respectively.Footnote 6 We opt for these two operationalizations for three reasons. First, the operationalization 35 years and below at the time of election is the most common operationalization found in the literature (e.g. see Joshi, Reference Joshi2013, Reference Joshi2015). Political parties themselves frequently define being young by the 35-year threshold (Krabbe, Reference Krabbe2013). For example, membership in many European parties’ youth wings, including the two largest youth wings of Germany, the German Christian Union, and the German Social Democratic Party, is capped at 35. The political behavior literature frequently also defines being young as 35 years and below (Flanagan et al., Reference Flanagan, Finlay, Gallay and Kim2012; Melo and Stockemer, Reference Melo and Stockemer2014). Second, the second operationalization, defining young as aged 40 and below at the day of elections covers almost all Members of the European Parliament until 45 years by the time their term ends. To highlight, somebody, who is 39 or 40 at the beginning of a parliamentary term, is likely to be 43, 44, or even 45 at the end of a term. Third, it would make little sense analytically to adopt a more restrictive definition of young. For instance, if we were to define young legislators as persons aged 30 years and below, many countries would not have any young deputies and others only 1 or 2%.
To calculate our two measures for young parliamentarians, we engage in a two-step process (see Appendix 1). First, we retrieve the age of MPs from her or his personal bibliography, which we normally find on the parliamentary website (or through the parliamentary information service) of any given country included in this analysis. For a smaller number of countries the data are collected from the website Every Politician.Footnote 7 For Ireland and Japan we use data sets compiled by other researchers.Footnote 8 We then count the number of deputies of 35 or 40 years and below at the day of the election and divide this number by the total number of deputies. While we strive to include as many countries as possible in our analysis, we are limited by data accessibility and retrieve age data for 107 countries (i.e. 12 countries in Africa, 16 in the Americas, 29 in Asia, 42 in Europe, and 8 in Oceania). In cases where there is a bicameral parliament, we focus on the lower house. We collect data from the most recent legislatures; that is, our data denotes the share of youths at the time of election in the respective country, covering the time period 2012–17. For some univariate statistics of the dependent variable, please see Table 1.
Table 1 Summary statistics of the dependent variable and the independent variables
PR=proportional representation.
Independent variables
To measure the electoral system type, we use two dummy variables, one for PR electoral systems and another one for mixed electoral systems. In more detail, we code all electoral systems where the district magnitude (M) is larger than 1 as PR systems, systems where M = 1 as plurality systems and systems with two parallel tiers as mixed systems. The category of PR electoral systems also includes countries with a mixed member-proportional electoral system as the vote distribution in this type of system follows the logic of PR. The reference category is plurality or majoritarian systems. We collect the data for electoral system types from the website of the International Institute for Democracy and Electoral Assistance (IDEA) (2014) as well as national websites for a small number of additional countries. The variable gauging the age of candidacy law in a country measures the minimum age to be eligible for being elected to the national parliament (the lower house where applicable). The data are collected from the IPU (2017). The third institutional control variable, age quotas, is a dummy variable coded 1 for countries with either legal age quotas, or in which at least one party has implemented age quota provisions and 0 otherwise. The data are taken from the UNDP (Reference Tremmel, Mason, Haakenstad and Dimitrijoski2013), the IPU (2014), and the Quota Project (2016).
Control variables
We operationalize regime type by two dummy variables (i.e. one for hybrid regimes and one for autocracy, with democracies serving as the reference category). To distinguish these three regime types, we use Polity IV data (Marshall et al., Reference Marshall, Jaggers and Gurr2011). Following Polity’s recommendations, we code a country that has a democracy ranking of 6 or higher as a democracy, countries with a ranking between −5 and +5 as a hybrid regime and countries with a ranking of −6 or lower as an autocracy. We gauge development by the GDP per capita in a country. Because we cannot necessarily assume a linear relationship between increases in material wealth and decreases in the share of young in the parliament, we log transform the GDP variable. The data source is the United Nations Data (2014). We operationalize corruption, our next indicator, by the 2014 Control of Corruption Indicator from the Worldwide Governance Indicators project, run by the World Bank. The indicator ranges from −2.5 to +2.5 and captures perceptions of the extent to which public power is exercised for private gain, including both petty and grand forms of corruption, as well as ‘capture’ of the state by elites and private interests (World Bank, Reference White2014). We measure the second last variable, by the share of Muslims in a country, which we collect from Central Intelligence Agency (2014) World Factbook as well as figures from national authorities from a limited number of cases. The final variable measures the mean age in the voting age population. We calculate this measure ourselves with the help of United Nations Data (2017) that lists population data per country and age.
Methods
Our sample to gauge the influence of institutions on the share of youths in parliaments consists of 107 countries (i.e. all countries for which data on the age of parliamentarians, as well as the covariates are available).Footnote 9 We use these data for three types of analysis. First, we present the data in the univariate realm to give the reader an idea of the distribution of dependent and independent variables (see Table 1). Second, we provide some bivariate statistics on the relationship between any of the three independent institutional variables on our two dependent variables, the share of parliamentarians aged 35 and below, as well as the share of parliamentarians aged 40 and below. Third and most importantly, we gauge the effect of our institutional variables on the share of young deputies in a multivariate framework via four ordinary least squares regression analyses. On the left-hand side of each model is any of our two dependent variables, the percentage of parliamentarians aged 35 and below, as well as aged 40 years and below, respectively. On the right-hand side are the two dummy variables for proportional and mixed systems, the candidate age requirement variable, the dummy for age quotas, as well as the five theoretically informed control variables. For both dependent variables we run two models, one model comprising all countries we have data for and one model only comprising democracies. We conduct these two additional models featuring only democracies because elected assemblies are foremost meaningful and (powerful) in a country that allows free and fair elections. These additional specifications or robustness checks comprise 74 democracies each.
Before modeling, we conduct three types of diagnostics. First, Figures 3 and 4 indicate that the dependent variables are more or less normally distributed, albeit more so for the variable gauging the percentage of deputies aged 40 and below than for the variable measuring the percentage of deputies aged 35 years and below. Hence, we do not transform the two dependent variables. Second, and because Figure 3 already points out that the variable deputies aged 35 and below has some outliers on the upper end of its distribution, we graph the two dependent variables in a boxplot. The boxplot confirms that there are three outliers in the variable measuring the share of MPs aged 35 years and below (i.e. data points that are 1.5 interquartile ranges above the third quartile). These three countries are Seychelles, Serbia, and Sweden. To test whether these outliers influence the results, we run models 1 and 2 without these outliers (see Footnote 10). Third, we test for heteroscedasticity via a Breusch–Pagan test in all models. The χ 2 test provides a significant value indicating that the variances across observations is heteroscedastic or unequal. We eliminate this violation of the general linear regression model with the help of Huber White robust standard errors, which down weight influential points (i.e. observations with a large variance) in our four equations (White, Reference Weiffen1980).
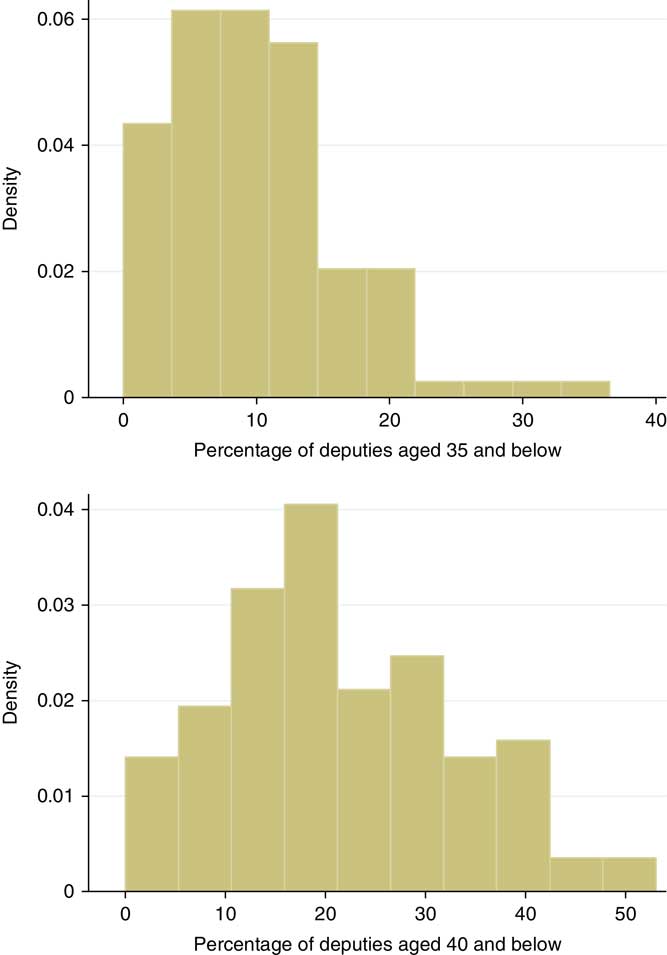
Figure 3 Histogram of the two dependent variables, the percentage of young deputies under 35 and the percentage of young deputies under 40.
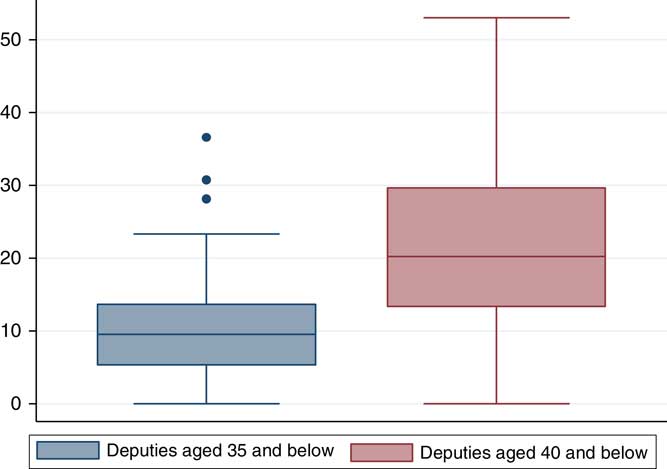
Figure 4 Boxplots featuring the share of members of parliament (MPs) aged 35 years and below as well as the share of MPs aged 40 years and below.
Results
Our results confirm that young individuals are underrepresented. Deputies aged 35 years and lower comprise a mere share of 10% of the deputies in national parliaments and deputies aged 40 years and lower a share of roughly 20% (see Table 1). We should also keep in mind that these numbers refer to the day the parliament is elected: at the end of a parliamentary term (normally 4 or 5 years down the road), the share of young deputies is much lower. The bivariate statistics corroborate two of our three hypotheses. First, we find that PR increases the share of young deputies whichever of the two dependent variables are used. In absolute terms, PR systems have 5 percentage points more young deputies aged 35 and under and 7 percentage points more deputies aged 40 and under than plurality systems (see Tables 2 and 3). For mixed systems we find similar percentages than for PR. Second, we also find that candidate age requirements strongly influence the numerical strength of young deputies in parliament. The fitted lines in Figures 5 and 6 are statistically significant and indicate a several percentage points gap in youth representation between countries having the legal age to run for office set at 18 years and countries where the age requirement to run for office is 25, 30, or 35 years. In contrast, age quotas do not seem to matter. In both Tables 4 and 5, youth representation in quota countries and non-quota countries is very similar and not statistically different from 0.
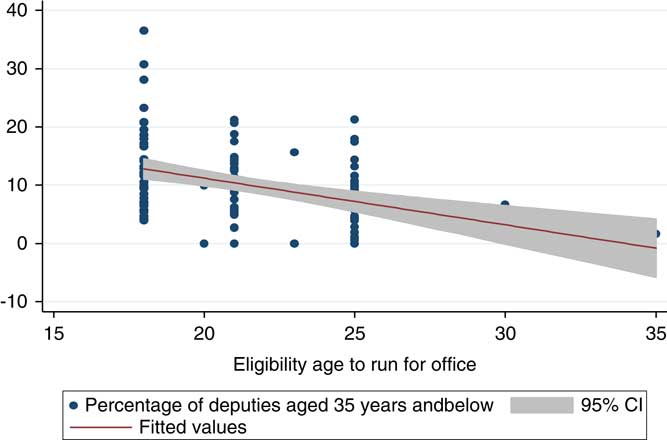
Figure 5 Scatterplot displaying the relationship between the legal age limit to run for office and the percentage of deputies aged 35 and below.
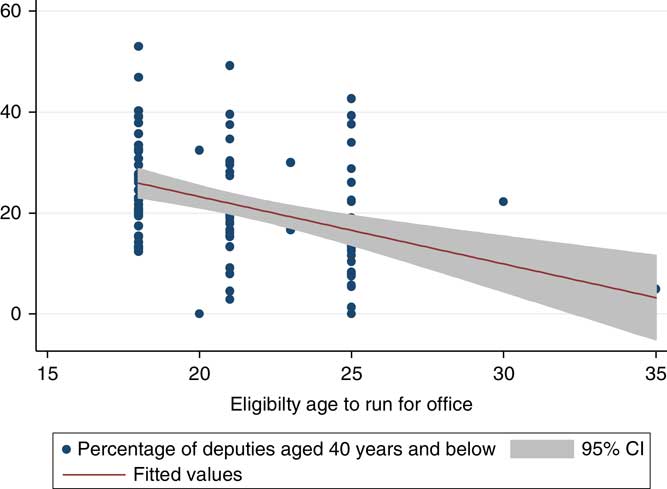
Figure 6 Scatterplot displaying the relationship between the legal age limit to run for office and the proportion of deputies aged 40 and below.
Table 2 Representation of youths (the share MPs aged 35 years and below) by electoral system type (percentage)
PR=proportional representation; MPs=members of parliament.
Table 3 Representation of youths (the share MPs aged 40 years and below) by electoral system type (percentage)
PR=proportional representation; MPs=members of parliament.
Table 4 Representation of youths (the share of members of parliament aged 35 and below) by age quotas (percentage)
Table 5 Representation of youths (the share members of parliament aged 40 and below) by age quotas (percentage)
Table 6 Determinants of youths in parliament: results of the multivariate regression analysesFootnote a , Footnote b

DV=dependent variables; MPs=members of parliament; PR=proportional representation; RMSE=root-mean-square error.
The models display the unstandardized coefficients. Standard errors in parentheses.
*P<0.10, **P<0.05, ***P<0.001 (two-tailed).
a We run all four models without the variable mean age in the voting population. This increases our N to 105 observations. In this slightly larger sample, the statistical significance and magnitude of the model coefficients do not change, thus confirming the results from models 1–4.
b We run models 1 and 2 without the three outliers Seychelles, Serbia, and Sweden, and the results do not really change from the main models.
The multivariate analysis confirms the bivariate results. First, we find that electoral systems are more malleable than other factors such as development to affect recruitment to legislatures (Matland, Reference Matland2005). The effect of having a PR electoral system is positive and statistically significant in all models. In detail, and holding everything else constant, the model suggests that countries with a PR electoral system have approximately 5 percentage points more young deputies than countries with plurality systems. Given an average of 10% young deputies aged 35 years and below in our global sample of legislatures and an average of 20% MPs aged 40 and below, these differences are rather large. It is also worth noting that, in terms of coefficient strength, mixed systems behave very similarly to proportional systems. The second statistically significant and substantively relevant factor is age of candidacy laws: corroborating our expectation, the models predict that for every year above 18 that young politicians are restricted from running for national elected office, the percentage of young deputies that are 35 years and below or 40 years and below decreases by 1 percentage point or more (depending on the model). Again, this is rather substantial. In contrast, age quotas do not have any positive impact. They are too selectively applied and when applied they are mere tokens; they do not have any meaningful positive influence on the representation of the young. Finally, we find that there is a small positive influence between older populations and a higher percentage of young deputies. As such, models 1–4 predict that per every year a population ages on average, the share of young deputies, however, defined, increases by 0.5%. While at first sight this finding is surprising, at second sight, it could make more sense. For example, the Finnish National Election Study 2003 (Finnish Social Science Data Archive, 2017) highlights that rather than supporting older candidates, voters are more likely to vote for candidates that are much younger than themselves. Empirically, the group that has the highest chance to vote for younger individuals are older generations. If the elderly follow this trajectory, then the finding that older populations trigger a slightly higher number of young deputies could make sense.
This study further underlines the influence of institutions in the representational literature. First, this analysis is a plea for PR. Previous research has shown that PR entices more individuals to cast their ballot in elections (Grofman and Selb, Reference Grofman and Selb2011). The proportional translation of votes into seats makes votes count and gives voters more options than plurality systems (Söderlund et al., Reference Reynolds2011). The mechanisms of PR also seem to have positive repercussions for representation. PR entices parties to diversify their electoral slates and to include women and minorities, and as we show, also a higher share of young politicians. As such, PR renders it easier for parties to add young candidates on their lists and it provides an incentive for political actors to nominate younger deputies. The increase in parliamentary parties triggered by PR also allows smaller parties such as Green Parties, which advocate concerns for the young, to gain representation. Second, this study highlights that candidacy age laws are important. If we want young people to get involved in the political process, including as deputies in parliament, we ought to give them the right to run for office early on. Giving young individuals at least the chance to run for office at 18 not only increases their representation, it further tells younger generations that politics is not only a domain for the elderly, but also a domain where young people can get involved.
Conclusions
Explicitly focusing on institutions, our study is one of the first to analytically assess the representation of age groups in parliaments in a comparative large N perspective. Our finding is that institutions matter for the presence of youths in national parliaments. PR and mixed systems increase the political representation of young deputies by 5–7 percentage points, on average, and for every year candidate age requirements are lowered, the share of young deputies aged 35 and lower or aged 40 and lower increases by 1 percentage point or more. The third factor – age quotas – do not appear to have the same positive effect. The current age quota provisions in our global sample of countries are generally too low (2, 3, or 5%) and only very selectively applied.
While our research provides some solid results, we acknowledge that the set-up of this study has limitations. Ideally, we would like to look at the age representation in countries over time. However, for most countries there is no historical data on the age of MPs available. Parliamentary offices and national statistical agencies do not yet collect data on the age of representatives in the same way they do for gender. Therefore, we are a bit restricted in making causal claims. What we find is that at a specific point in time (the years 2012–17), the two institutional factors, PR and being allowed to run for office at a young age (i.e. 18 years), increases the representation of youths. We are not able to establish what occurs to the representation of young deputies if a country would switch to PR or if it would lower its age limit to stand for office. Nevertheless, we see our study as a step forward in our understanding of the representation of young adults (or the lack thereof).
We can derive two policy implications from our study. First, if countries with candidate age requirements of 21, 24 or even higher were to lower this threshold to 18, the share of young legislators in parliament would likely increase. Second, and even more importantly, age quotas are still in their infancy; if more countries would implement legislated age quotas, ideally at an adequate level, the share of young deputies would certainly increase. To get some more robust findings on the intricacies of youth representation and the vicious cycle of youths’ absenteeism in politics, more generally, we hope that our study will serve as an incentive for others – both academics and policy agencies – to collect more data on youth representation. In particular, we hope that our work inspires more studies to take the normative repercussions of equal representation of social groups seriously. If we want inclusive parliaments it is important to have the voices of the young heard. Second, we hope that our study encourages more work on the profile and electoral chances of young candidates. What is the socio-economic profile of young parliamentarians? For what type of elections do young candidates get elected in higher numbers? Third, more work is necessary that adopts an intersectionality perspective (see Crenshaw, Reference Crenshaw1989). What is the ratio between young women and young men? How do young individuals that belong to ethnic minorities fare in parliaments? While we have asked some important questions that future research hopefully will address, we nevertheless hope that this study pushes the still limited literature on the representation of youths in parliament forward.
Supplementary material
To view supplementary material for this article, please visit https://doi.org/10.1017/S1755773918000048


