
This article was prepared by Sebastian Lambert, CEO of FinancesOnline and our company’s guru on SaaS growth hacking and lead generation strategies. All strategies discussed below are based on both extensive research and Sebastian’s years of experience with the SaaS and B2B market.
 This article was prepared by
The CEO just handed you down the revenue goal and you have to hit the goal by year-end. Your confidence aside, is there a more systematic way to ensure you meet your target month to month and sustain growth?
We all know that lead generation is the key to growing your business. But you have to know how many leads you need, not just in each month, but per stage in your sales funnel so that you and the sales and marketing teams would be more aligned with your objective. To do this you need to reverse engineer your revenue goals and break them down by the number of leads per sales stage. In this article, we’ll walk you through the steps on how to do this.
With this process, you’ll have more control over your sales funnel and, perhaps, avoid the common problem of 60% of forecasted deals not closing that many sales managers face today.
Likewise, you will avoid scrambling for more leads at the tail-end of the year, since the sales funnel shows how far behind you are right off the first quarter. This graph from Going.io indicates that sales reps often scramble for leads in the last two quarters, perhaps the only time they realize how much they’re off the mark and their profit compromised.
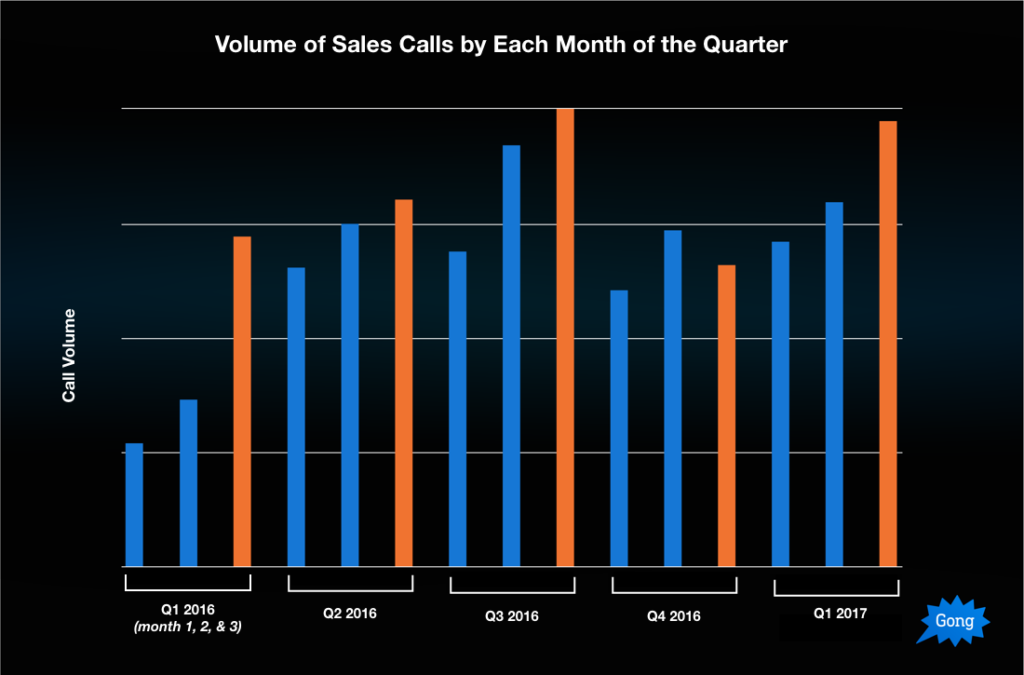
Source: Gong.io
For this exercise, we need the following elements to illustrate how to reverse engineer your revenue goals.
- Your revenue target
- A clear sales funnel
- Average sales per lead
- Conversion rate per sales stage
You’ll also need to use a reliable CRM software to map a sales funnel and visualize the reverse process. For this, we recommend you turn to one of the most popular CRM apps, HubSpot, which has all the tools to help you reverse engineer your revenue goals and, more importantly, HubSpot is available for free. You can easily sign up for HubSpot CRM here.
You can also check out Sebastian Lambert’s list of top 20 CRM solutions of 2024 and pick something that works for your specific needs.
So, let’s get to it. Here are the steps on how to reverse engineer your revenue goals to ensure you hit the sales target every month.
1. Sales funnel bottom up
The first step is to have a clear sales funnel. If you already have one you can skip this step.
Sales funnels typically have seven stages, but for our purpose we’ll condense the stages to six:
- Engagement. Leads from your campaigns come in.
- Marketing qualified leads (MQL). Marketing shortlists promising leads based on key metrics and passes them to sales.
- Sales qualified leads (SQL). Sales shortlists MQL leads and comes up with a list of prospects.
- Discovery. Sales engages prospects for initial meeting or discussion.
- Proposal. Sales sends offer, negotiate for a deal.
- Won. Sales closes deal.
Likewise, you should outline specific activities that must be met in each stage prior to moving the deal to the next stage. For example, a Discovery lead is only moved to Proposal once the sales rep has actually sent a draft contract.
Similarly, your MQL leads should have distinct metrics from your SQL leads, lest you may be duplicating the process. TechnologyAdvice gives a clear picture of MQL vs. SQL.
Once the funnel is set you can now populate each stage with your current leads based on the activities or requirements met.
It is highly recommended that you use a CRM tool with a visual pipeline like HubSpot CRM, as you’ll need to view this pipeline from different perspectives to reverse calculate the number of leads and deals per stage.

You can customize the sales stages and conversion rate in HubSpot CRM.
2. Calculate the conversion rate for each stage
How do you know the conversion rate per stage?
The simplest way is to take the number of conversions divided by the total number of leads per stage. For example, if out of 100 MQL leads you move 10 to SQL, your MQL conversion rate is:
10/100 = 10%.
However, this formula treats all leads as equal. In fact, some leads convert better than others.
A more accurate approach, albeit one that involves insights on your prospects, is to use predictive analytics or lead scoring. This method considers variable metrics, such as, lead source, lead profiles, season, historical data, demographics and other positive and negative attributes that affect the probability of leads to convert.
Some of the factors to consider in lead scoring are:
- Decision-making authority
- Engagement level
- Intent to buy
- Demographics
- Budget
For each factor, you must have a value range and assign the one that best describes the lead (ex. 1-10 with 10 being the most promising). You can extrapolate the value to derive a rate (ex. 6 is 60%), then get the average rate of all leads in a stage. That’s your mean conversion rate for that stage.
It’d be tedious to do this if you’re working on hundreds of leads. That’s why automating lead scoring is one of the great benefits of CRM and marketing software.
For instance, in HubSpot Marketing you can set up predictive lead scoring, which aggregates the positive and negative attributes to score a lead. Likewise, once you set up the attributes, you avoid the likelihood of manual errors that can screw up your conversion rate.

Simply add the positive and negative attributes to start automating lead scoring in HubSpot Marketing.
If you start using lead score automation with your market insight and historical data, your conversion rate will become more accurate.
3. Forecast no. of leads per stage
It’s time to reverse engineer the entire sales funnel based on top management’s revenue goal. Remember, you’re not only calculating the total number of leads you need each month but how much lead you need per stage.
This makes it easy to set a quota for each stage aligned with the overall revenue goal. Likewise, it’s easy to focus on the stage you’re falling behind, so you make the necessary steps.
This is important, as you may have a high conversion rate at the Discovery stage, but low at the SQL stage. That means your sales team is performing great but it’s underutilized. A quick solution is to generate more MQLs to increase SQLs and, ultimately, more conversions at the bottom of the funnel.
Before you start to reverse engineer, you should have a clear picture of your average sales price. A simple way to do this is to total all your sales per lead in one sales year and divide the sum by the total number of leads in the same period.
At this point, you can now work backward using your revenue goal as a starting point. Let’s bring up our example revenue target above of $1,000,000 and let’s say your average sales per lead (the revenue you earn per lead) is $10,000.
Starting at the bottom of the funnel, Won, we simply divide your target revenue by the average sales per lead, so you need 100 Won leads.
- Management goal: $1,000,000
- Ave. sales per lead: $10,000
- No. of Won deals needed: $1,000,000/$10,000 = 100
Then work our way up to find out how many leads you need per stage. To do this, simply divide the stage’s no. of leads by its conversion rate and the dividend is the number of leads of the previous stage (since we’re working upward this is the next stage).
For example, to calculate the number of leads in the Proposal to Won stage, we divide the number of Won deals (100) by the conversion rate in Won stage (20%). The dividend is 500, which is the number of Proposal to Won leads we need.
- No. of Won deals needed: $1,000,000 / $10,000 = 100
- Conversion rate Proposal to Won: 20%
- No. of Proposal to Won leads: 100 / 20% = 500
Following this formula, we can now calculate the number of leads per stage as we move upward.
- No. of Proposal to Won leads: 100 / 20% = 500
- Conversion rate Discovery to Proposal: 25%
- No. of Discovery to Proposal leads: 500 / 25% = 2000
- Conversion rate SQL to Discovery: 30%
- No. of SQL to Discovery leads: 2000 / 30% = 6,667
- Conversion rate MQL to SQL: 70%
- No. of MQL to SQL leads: 6,667 / 70% = 9,524
- Conversion rate Engaged to MQL: 10%
- No. of Engaged to MQL leads: 9.524 / 10% = 95,240 total no. of leads
There you go, you need a total of 95,240 leads to reach your revenue target of $1,000,000 in a sales year. You also have a clear picture of how many leads you need per stage. Of course, this is just on paper. And in the area of sales forecasting, you can be properly guided by sales templates, examples, and formulas.
In reality, you’ll perform better or worse, depending on other factors. But you’ll profit from this framework by giving you a quick look on how far or near you are from your objective month to month, a handy tool that tells you when to celebrate early or buckle down for more work.
Are you ready to reverse engineer your revenue goal and find out how many leads you need per stage to sustain growth? You can start by signing up for HubSpot CRM free tool here and follow the three simple steps above. Reverse engineering is but one of the many innovative ways of learning how to grow your business. You can always explore any of the proven methods to nurture leads and increase your sales.


Leave a comment!