Have we all underestimated the severity of socioeconomic differences in electoral participation?
Opinion polls routinely overestimate voter turnout, since participants misreport their own voting record, and because politically engaged voters are also more likely to respond to surveys. Using unique linked survey and register-based data from Finland that allows them to measure the effects of these biases, Hannu Lahtinen, Pekka Martikainen, Mikko Mattila, Hanna Wass, and Lauri Rapeli demonstrate that these two factors also lead to an underestimation of socioeconomic differences in turnout. The results imply that social inequality in political participation is a greater social challenge than previously thought.

Picture: By Hanna Wass / ©Hanna Wass
Post-election surveys constitute the main source of our knowledge about the individual-level determinants of electoral participation. Despite their prominence, throughout the history of political surveys, scholars have been worried about the overestimation of voter turnout. This overestimation stems from two sources. The first one is social desirability: some respondents may say they voted when they, in fact, did not. The second source of overestimation is the self-selection: those individuals who are more likely to vote are also more likely to participate in surveys.
Although the contribution of these two biases to survey-based estimates of turnout is well known, we know less about how these biases affect turnout estimates for specific population groups. Some previous studies have assessed the extent of social desirability bias, but the extent of the non-response (self selection) bias has been more difficult to evaluate. In our recent study published in Public Opinion Quarterly, we had a rare opportunity to evaluate both forms of bias simultaneously using a survey linked to Finnish administrative registers on voting. In addition to conventional survey questions, these linked data contained information on sociodemographic factors and electoral participation for both respondents and non-respondents. The information was available for those non-respondents who lived in electoral wards using electronic voting eligibility administration in the Finnish 2015 parliamentary elections (24.2% of the entire individual-level electorate). The validation and match to registers was done by statistics officials using personal identity codes used in almost all administrative settings in Finland, which is known to provide exceptionally reliable linkage.
Overall, the self-reported turnout in our survey was 89%, validated turnout among respondents was 86% and validated turnout of the full baseline sample was 74% (respondents, refusals and those never contacted). Therefore, mismeasurement related to self-selection was far more serious concern than social desirability bias. These figures are higher than the official turnout rate of 70.1% because we only included individuals who were at least 25 years old in our analyses to ensure accurate measurement of socioeconomic position in our next analysis. The position of younger individuals is unlikely to be well established yet.
After assessing the mismeasurement of overall turnout, it is time to focus on the main aim of our study, namely to assess the potential mismeasurement of socioeconomic differences in voter turnout – that is to say, mismeasurement of participation related to an individual’s education, occupational social class and income. Differences in voting based on these factors demonstrate social inequalities in parliamentary representation rather straightforwardly. Therefore, accurate estimation of socioeconomic turnout differences is of special relevance.
Figure 1. Estimated turnout (percentage) by education, social class and income using different measurement strategies
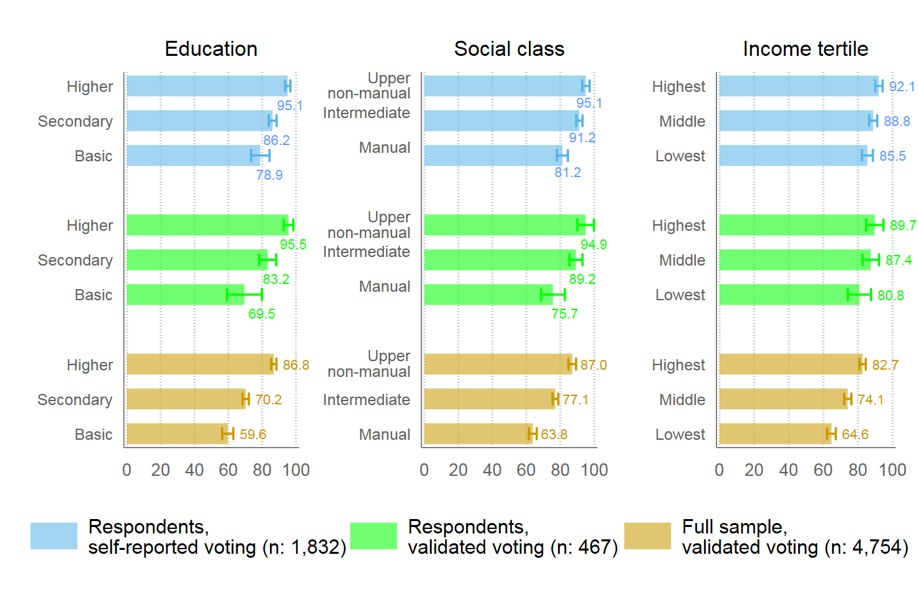
Notes: 95% confidence intervals shown. Predicted probabilities from logit models, adjusted for three cubic splines for age. Figure originally published in Hannu Lahtinen. 2019. ‘Socioeconomic Differences in Electoral Participation: Insights from the Finnish Administrative Registers’. Doctoral dissertation, University of Helsinki (p.43).
Figure 1 summarises the main result of the study. In this figure, socioeconomic differences in turnout are estimated with three different strategies. Blue bars are the conventional survey estimates calculated from the survey data only; green bars present validated voting among survey respondents, and brown bars validated voting among the overall baseline sample of all eligible voters, as explained above. The results show that these register-based estimates of differences in the voting probabilities are at least two-thirds larger than conventional self-reported differences among the survey respondents. This discrepancy is even more dramatic if we take the lower register-based estimate of overall turnout into account in assessing the strengths of these differences. One vote counts more when turnout is lower. Therefore, the risk ratio may be substantially the most relevant statistic, as it directly reflects the discrepancy in political voice between different socioeconomic groups. Figure 1 shows that the conventional survey estimates of increased likelihood, or relative risk, of voting by the highest social group relative to the lowest groups were 1.21 (=95.1/78.9) for education, 1.17 (=95.1/81.2) for social class, and 1.08 (=92.1/85.5) for income. By contrast, the excess risks estimated from the register-based data were at least twice as high: 1.46 (=86.8/59.6) for education, 1.36 (=87.0/63.8) for social class and 1.28 (=82.7/64.6) for income.
We did not directly analyse the causes of these differences. However, one possible explanation for this pattern may be that some factors that predict both responding to a survey and voting, such as high levels of political interest and strong feelings of civic duty, also correlate with a more advantaged socioeconomic position. Thus, differences in political interest or in the sense of civic duty can be smaller between middle-class respondents and non-respondents than between working-class respondents and non-respondents.
Interestingly, these results contradict some previous studies that assess only the consequences of social desirability bias, which have concluded that the bias is larger for those in more advantaged positions. However, a recent study from Denmark using a similar design as ours also produced similar findings as our study from Finland. Thus, the result that surveys underestimate socioeconomic differences in turnout, is replicated in two different country-contexts. Overall, these findings imply that socioeconomic inequality in electoral participation – and hence, in political voice – is a more pressing social problem than previously understood.
This post represents the views of the authors and not those of Democratic Audit. It draws on their article ‘Do Surveys Overestimate or Underestimate Socioeconomic Differences in Voter Turnout? Evidence from Administrative Registers‘, published in Public Opinion Quarterly, 83(2): 363–385.
About the authors
Hannu Lahtinen is a postdoctoral researcher in the Faculty of Social Sciences at the University of Helsinki.
Pekka Martikainen is a professor of demography in the Faculty of Social Sciences at the University of Helsinki; visiting professor at the Karolinska Institutet at Stockholm University, Stockholm; and research affiliate at the Max Planck Institute for Demographic Research, Rostock.
Mikko Mattila is a professor of political science in the Faculty of Social Sciences at the University of Helsinki.
Hanna Wass is an acting professor of political science in the Faculty of Social Sciences at the University of Helsinki.
Lauri Rapeli is the research director in the Social Science Research Institute at Åbo Akademi University, Turku, Finland.
Similar Posts
Subscribe
If you enjoyed this article, subscribe to receive more just like it.


 Democratic Audit's core funding is provided by the Joseph Rowntree Charitable Trust. Additional funding is provided by the London School of Economics.