

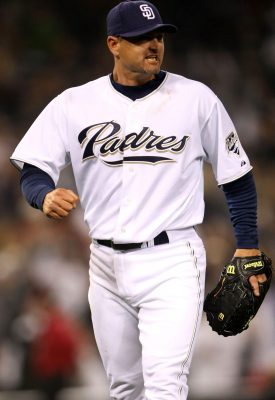
Trevor Hoffman was elected into Major League Baseball’s Hall of Fame on Wednesday night, continuing the trend that should baffle fans and experts alike.
The Baseball Writers’ Association of America elected Chipper Jones, Vladimir Guerrero, Jim Thome and Trevor Hoffman into the Baseball Hall of Fame on Wednesday night, and the latter didn’t enter without fascinating controversy.Not controversy surrounding performance-enhancing drugs, politics, or off-the-field antics, but the controversy involving the save statistic and the unfortunate case of Billy Wagner.
Hoffman, who held the title as baseballs all-time saves leader (601) when he retired in 2010, received 79.9 percent of the vote after missing by just five votes last year. Wagner, who ranks sixth on that same list, garnered just 11.1 percent of the vote.
Sure, that’s up from the 10.2 percent he received in 2017 and the 10.5 percent in 2016, but with Mariano Rivera expected to hit the ballot in 2019, we may never see Wagner come close to registering enough votes to be enshrined in Cooperstown.
To believe Wagner’s case isn’t a tragedy is flat-out fallacious. His 1,196 career strikeouts as a reliever are the fourth-most in the history of baseball and also fourth on the list Hall Of Fame relief pitchers (including current candidates). Wagner’s career ERA of 2.31 is also more than a half-run lower than Hoffman’s (2.87) while his 0.998 career WHIP and his strikeout rate of 33.2 percent lead all relievers (min. 80% of games as RP and 800 innings) in major league baseball history.
Despite these blinding advantages Wagner has on all other relievers to take the rubber throughout baseball history, the left-hander finished with 179 fewer saves than Hoffman. Still, to this day, the save statistic is a number many use to judge closers.
Wagner’s case shows us that baseball still has ways to go when dealing with relief pitchers. Especially closers, who are unfortunately still on a fine line in terms of evaluation. His 422 saves are not enough for old-school voters and his 27.7 WAR is not enough for new-school voters. Yet, we turn a blind eye to what categories we should use to evaluate relievers, not just closers.
Before we dig into exactly how we need to look at relievers and closers when deciding whether or not they’re Hall of Fame eligible, we have to understand a few aspects.
First off, we cannot fault the voting process for how overlooked Wagner has been compared to Hoffman. Getting 75 percent of any group to agree on something — let alone topics involving sports — is a laborious task. To claim that The Baseball Writers’ Association of America is preventing a particular player from being elected isn’t accurate.
A majority of the writers cast a vote for that certain player. The standard for enshrinement into Cooperstown is high, and there aren’t many problems with the system. The only one slightly holding Wagner back, to a degree, is the 10-player voting limit.
Secondly, this is no knock on Trevor Hoffman’s legacy. He was discharged into a role that required him to come out in the ninth inning during save situations and slam the door shut. And he did it better than most, as his 88.8 percent save rate ranked second to only Mariano Rivera (89.1) among relievers with at least 400 saves.
Wagner is third on that same list with an 85.9 rate. So, is this a more accurate way to measure relievers? Not necessarily. Save percentage stems from saves and we’re way beyond favoring one reliever over another because a manager used one more often than the other in save situations. That’s why better arms are used earlier in games these days and that’s why Cleveland Indians’ reliever Andrew Miller is considered by many to be the most dominant reliever in the game — above many closers.
So, can WAR be used to draw a more definitive perception of Hall-of-Fame worthiness? Although its shortcomings aren’t near the level of the save statistic, WAR has its faults when it comes to evaluating relievers from other eras.
Hoyt Wilhelm, Rollie Fingers, and Rich Gossage (three of the six primary relievers in the Hall) had stretches of their career in which they piled up relief workloads we haven’t seen since and probably will never see again. Among Wilhelm (eight), Fingers (eight) and Gossage (four) are 20 seasons in which they registered 100 innings of relief. Since 2010, no reliever has posted 100 innings of relief.
Dennis Eckersley is another “reliever” in the Hall of Fame, but his WAR total is influenced highly by his workload as a starter. From 1975-86 (359 starts), he totaled a 45.7 WAR. From 1987, when he moved to the bullpen, he totaled a 16.8 WAR. That’s just 26.8 percent of his career WAR of 62.5. Eckersley innings pitched unquestionably enhanced his career WAR, as it also did for Wilhelm, Fingers, and Gossage.
So, Eckersley’s JAWS (career WAR averaged with their seven-year peak) of 50.6 beats out Mariano Rivera’s career JAWS of 43. Yet, Rivera was far more effective as a closer and truly garnered much more value than Eckersley (as a reliever) — not to mention that Rivera is the clear-cut greatest reliever of all-time.
Other advanced metrics fall short in accurately evaluating relief pitchers’ Hall of Fame case. More specifically, comparing the modern reliever to the “fireman” we saw in the mid-to-late 1900’s. Win Probability Added (WPA) is also skewed because a pitcher who pitches in more high-leverage spots has a much better chance of compiling a high-grade WPA. That doesn’t necessarily tell us who was the more dominant reliever, as old-school relievers would be exposed to more situations.
Is there any method aside from record, saves, save conversion rate, ERA, WAR and WPA we can use? Thankfully, yes. There are quite a few that are seldom used in conventional conversations that make “cases” for each candidate.
We start at ERA+. This stat, unlike traditional ERA, measures against the league average and adjusts for ballpark factors. Consider it a more accurate method of measuring run prevention.
Wagner’s career ERA+ of 187 is way ahead of the second man on the list of Hall of Fame and Hall of Fame-eligible relievers in 2018 (Hoyt Wilhelm, 147). Trevor Hoffman (141) is third on the list that Mariano Rivera (205) will take over next year.
Another category Wagner was second-to-none in on the ballot this year was strikeout rate. Among Hall of Fame and Hall of Fame-eligible relievers, his 33.2 K% topped the list while Hoffman’s strikeout rate of 25.8 percent comes in at second. No Hall of Fame reliever or any pitcher in baseball history (min. 800 IP) is better at not allowing the ball in play than Billy Wagner was.
Let’s put it all together using Fielding Independent Pitching, which estimates a pitcher’s ERA based on strikeouts, walks, hit by pitches, and home runs allowed while factoring in league average luck on balls in play and defense.
Wagner’s career FIP of 2.73 is the best mark of all-time (among relief pitchers with at least 800 innings pitched and 80 percent coming in relief). Ahead of the career marks of Hoffman (3.08), Rivera (2.76) and every Hall of Fame reliever.
Lastly, there is an adjustment to Win Probability Added one could use to compare WPA between players, no matter the era. It does this by offsetting leverage and measuring how much value a player added to their team regardless of the leverage (WPA/LI). FanGraphs determines this to be a more accurate representation of player’s talent level than WPA.
Unsurprisingly, Rivera leads relievers (min. 800 IP) with WPA/LI of 33.619, while Billy Wagner comes in at number five and Hoffman sits at number four. Here is a complete list of the stats determined to be a more accurate representation of Hall of Fame worthiness for relievers (listed are relievers in Cooperstown or on the ballot next season):
| Rk | Player | WPA/LI ▼ |
SV | FIP | K% | ERA+ |
|---|---|---|---|---|---|---|
| 1 | Mariano Rivera | 33.619 | 652 | 2.76 | 23.0% | 205 |
| 2 | Hoyt Wilhelm | 27.003 | 228 | 3.06 | 17.6% | 147 |
| 3 | Dennis Eckersley | 25.699 | 390 | 3.41 | 17.7% | 116 |
| 4 | Trevor Hoffman | 19.331 | 601 | 3.08 | 25.8% | 141 |
| 5 | Billy Wagner | 17.875 | 422 | 2.73 | 33.2% | 187 |
| 6 | Rollie Fingers | 15.167 | 341 | 2.96 | 18.7% | 120 |
| 7 | Rich Gossage | 14.891 | 310 | 3.18 | 20.0% | 126 |
| 8 | Bruce Sutter | 11.861 | 300 | 2.94 | 20.3% | 136 |
| 9 | Octavio Dotel | 8.216 | 109 | 3.70 | 28.4% | 119 |
| 10 | Darren Oliver | 0.430 | 7 | 4.53 | 15.1% | 104 |
By inducting Hoffman into Cooperstown, we are opening the doors for the modern reliever. Yes, this is a step in the right direction. We are leveling the playing field and now have a better understanding of the context of the “fireman,” the modern closers and even the modern “super relievers.”
But don’t think there isn’t work to be done. Look at the numbers that do help us understand the context and ask yourself why Billy Wagner received 11.1 percent of the vote in his third year on the ballot while Hoffman earned 79.9 percent en route to enshrinement.
If you made it to this part of this column, you should be scratching your head. It’s not that Hoffman didn’t provide Hall-of-Fame value, it’s that Wagner is living in Hoffman’s shadow because he racked 126 fewer saves despite providing comparable value.
Yes, with all this information at our disposal, too many voters are still using saves to assess the value of relievers. When it comes to specialized positions, we need to adjust even the advanced metrics we use to value them — especially since the position has gone through immense change across the sport’s history.
It’s time to change with the position and how we’ve handled relievers over the year. We must not only remain flexible in seeking other ways to evaluate them, but also put to work what justifies immortality. Wagner’s dominance in comparison to his peers on the ballot is difficult to overlook and we must no longer concede to the narrow-minded view many have on relievers.


