


Abstract
Nationally Determined Contributions (NDCs), submitted by Parties to the United Nations Framework Convention on Climate Change before and after the 21st Conference of Parties, summarize domestic objectives for greenhouse gas (GHG) emissions reductions for the 2025–2030 time horizon. In the absence, for now, of detailed guidelines for the format of NDCs, ancillary data are needed to interpret some NDCs and project GHG emissions in 2030. Here, we provide an analysis of uncertainty sources and their impacts on 2030 global GHG emissions based on the sole and full achievement of the NDCs. We estimate that NDCs project into 56.8–66.5 Gt CO2eq yr−1 emissions in 2030 (90% confidence interval), which is higher than previous estimates, and with a larger uncertainty range. Despite these uncertainties, NDCs robustly shift GHG emissions towards emerging and developing countries and reduce international inequalities in per capita GHG emissions. Finally, we stress that current NDCs imply larger emissions reduction rates after 2030 than during the 2010–2030 period if long-term temperature goals are to be fulfilled. Our results highlight four requirements for the forthcoming 'climate regime': a clearer framework regarding future NDCs' design, an increasing participation of emerging and developing countries in the global mitigation effort, an ambitious update mechanism in order to avoid hardly feasible decarbonization rates after 2030 and an anticipation of steep decreases in global emissions after 2030.
Export citation and abstract BibTeX RIS

Original content from this work may be used under the terms of the Creative Commons Attribution 3.0 licence.
Any further distribution of this work must maintain attribution to the author(s) and the title of the work, journal citation and DOI.
Corrections were made to this article on 24 January 2018. Extra Python input files were added to the supplementary data.
1. Introduction
Parties to the United Nations Framework Convention on Climate Change (UNFCCC) have submitted their intentions for mitigating climate change in the run-up to the 21st Conference of Parties (COP21) that was held in Paris in December 2015. Their Intended Nationally Determined Contributions (INDCs), which cover a range of targets and actions for reducing GHG emissions, have become Nationally Determined Contributions (NDCs) for the Parties that have ratified the Paris Agreement. With a few exceptions, NDCs are generally very close to INDCs for the overarching targets that we consider here and, although they may evolve in future negotiations [1], they reflect the current level of commitment of Parties and represent a legitimate source of information for projecting GHG emissions in 2030.
A number of analyses, including by the UNFCCC secretariat [2], the UNEP Gap Report [3, updated for COP23 in 4], Fawcett et al [5], Rogelj et al [6], den Elzen et al [7], Vandyck et al [8] and Rogelj et al [9] have inferred the 2030 global emissions from INDCs or NDCs. The UNFCCC based its analysis on the content of INDCs, but considered additional information from the IPCC AR5 database and other national data for emissions not covered by INDCs. Their calculations result in global emission levels of 56.2 (52.0–59.3) Gt CO2eq yr−1 in 2030; their uncertainty ranges indicate 20%–80% percentiles. The four studies by Fawcett et al, den Elzen et al, Vandyck et al, and Rogelj et al [9] share similar methodologies relying on scenarios from integrated assessment model(s) (IAMs) in which the targets expressed in the INDCs/NDCs are implemented. These studies assess 2030 emission levels accounting for current policies and additional targets expressed in the INDCs/NDCs. Economic growth is exogenous to their models and follows either domestic forecasts or a given Shared Socioeconomic Pathway (SSP) scenario [10]. The UNEP Gap Report results from an iterative process with yearly updates since 2010. It draws from the content of the INDCs/NDCs, other documents submitted by countries to the UNFCCC (such as national inventories), estimates from country-specific studies, and ten global analyses (those cited above, and another six not peer-reviewed). Global emission levels in 2030 are predicted to be 55.2 (51.9–56.2) Gt CO2eq yr−1 accounting for unconditional NDCs only and 52.8 (49.5–54.2) Gt CO2eq yr−1 for conditional NDCs (uncertainty ranges correspond to 10%–90% percentiles). The UNEP report highlights the 'gap' between emissions levels resulting from the aggregation of NDCs and those required to achieve the ambitioned temperature target 'well below 2 °C'. Rogelj et al [6] adopt a similar 10%–90% uncertainty range as the 2017 UNEP Gap Report and go one step further to estimate temperature change projections for 2100 assuming some continuation of the mitigation effort after 2030.
While the UNEP Gap Report represents a useful meta-analysis of available studies, it also involves some degree of expert judgment. Indeed, interpreting the NDCs is not straightforward. Their format and content vary tremendously and some external information is required for their interpretation. These issues were discussed ahead of COP21 during a workshop organized in Paris by the authors [11]. When available, the uncertainty analysis in individual studies is often semi-quantitative and likely to be dependent on the model used. The UNEP Gap Report derives uncertainties from its meta-analysis, but does not perform a systematic treatment of uncertainties, neither for global emissions, nor for individual countries. Overall, the drivers for uncertainties and their respective contribution to the total uncertainty are unclear. Rogelj et al [9] provide a quantitative analysis of uncertainty sources, resulting in an extended 2030 emission range of 47–63 GtCO2eq yr−1 (minimum–maximum range), but leave aside several crucial drivers such as emissions from land use, land use change and forestry (LULUCF), and use a restricted set of socio-economic scenarios. Furthermore, the emission levels for individual countries are not easily traceable to model outputs, although some studies treat some countries more in-depth [5, 7, 8].
Here, we chose a different methodology from previous analyses. We deliberately step aside from IAMs and take NDCs at face value. We treat countries individually whenever possible and only apply a generic treatment to countries that published insufficient information. For countries that have expressed their target partly as a reduction in the carbon intensity of their economy without providing a gross domestic product (GDP) binding scenario, we consider 20 GDP growth scenarios stemming from different quantifications of the five SSP [12–15]. We explicitly flag further assumptions made in the study and apportion the total uncertainty among the various drivers. To our knowledge, this study is the first systematic uncertainty analysis of global GHG emissions implied by NDCs. While our approach has intrinsic limitations, it also has advantages in terms of simplicity, flexibility and transparency. Unlike previous studies [2–9], we do not attempt to project 2030 GHG emissions under current policies, we are only interested in interpreting the absolute level of GHG emissions implied literally by the NDCs. It is conceivable that current economic trends and/or current policies result in smaller emissions than implied by the NDCs for some countries and we expect the ambition level of NDCs to be revised upwards in such cases. Conversely, some other countries may experience higher emissions than predicted.
By monitoring GHG emissions against our model, it will be possible to assess which NDCs are over- or underachieved. Our approach also allows updating the projected emissions when new data become available or when new NDCs are submitted as part of the revision process of the Paris Agreement. This will be facilitated by the release of our Python code as supplementary material to this article available at stacks.iop.org/ERL/13/014022/mmedia.
2. Methods
2.1. Emission datasets
We first consider a dataset of emissions for reference years used in the NDCs. For consistency with work from the Intergovernmental Panel on Climate Change (IPCC), we rely on published emission inventories [16, table S2]. Historical emissions data come from three distinct databases: the Emissions Database for Global Atmospheric Research (EDGAR) for emissions of CO2 except from LULUCF, CH4, N2O, HFC, PFC, and SF6 [17], and the BLUE (bookkeeping of land use emissions) model [18 and personal communication] for CO2 emissions from LULUCF. For the United States, Canada and Russia, whose NDCs are expressed in 'net-net emissions', we also consider their CO2 LULUCF balance (emissions + sinks) reported to the UNFCCC. Since the UNFCCC accounting for LULUCF balance differs from that used in Earth system models [19], we only consider half of these supplemental carbon sinks as anthropogenic (table S4). Uncertainties in historical emissions, including in Chinese emissions [20, 21], are not accounted for. Rather, in the light of the recent study by Liu et al considering specific emission factors for Chinese coal types [22], we use average values between Chinese emissions data from EDGAR and those of Liu et al This results in Chinese CO2 emissions about 5% smaller than EDGAR over the 1990–2010 period (table S3). We discuss the impact of this correction on our results in the supplementary material (section 10 and figure S6). Combining these datasets, we estimate 2010 GHG emissions to be 50.6 Gt CO2eq yr−1 accounting for an anthropogenic carbon sink due to LULUCF. We are not able to derive a strict uncertainty range for this quantity as neither EDGAR nor BLUE provides an uncertainty analysis for their data. Our estimate is within the range of other estimates: 50.9 GtCO2eq yr−1 for EDGAR [23]; 47.6 Gt CO2eq yr−1 for the Climate Action Tracker [24] and 49.3 Gt CO2eq yr−1 for PRIMAP [25]. While reassuring, this does not mean much as most studies rely on identical or similar sources for emissions. Uncertainties in historical emissions at the country level are also difficult to assess and not considered in this study.
2.2. GDP datasets
We consider 20 GDP scenarios, illustrating the five Shared Socioeconomic Pathways (SSP) [10] for four quantifications (the marker quantification by OECD [13], and three alternative quantifications by CEPII [12], IIASA [14], and PIK [15]). SSP scenarios aim at facilitating the integrated analysis of future climate impacts, vulnerabilities, adaptation, and mitigation [10] and represent a framework to examine possible future states of the world. Because the GDP scenarios diverge after 2005, we correct them on the basis of the historical 2005–2015 data from the World Bank World Development Indicators database (release from 15 September 2017). We propagate the difference between the SSP and actual GDP growth rates until 2030 with a transition from a purely historical GDP driven trajectory to a purely SSP driven trajectory (see supplementary material section 4). This generally results in smaller GDP levels in 2030 than assumed in the SSP scenarios because actual growth rates are lower in the historical data over 2005–2015 than assumed in the SSP scenarios. A noticeable exception is the CEPII scenarios, which show a late rise in GDP growth for some countries, including China (see supplementary material section 5). Figures S1(a)–(b) illustrate the 20 economic GDP scenarios before and after correction, respectively, for China. Note that we only use the GDP quantifications of the SSP, not the emissions quantifications (currently not available at the country level). However, we compare our projected emissions with those projected by IAMs for the SSP scenarios for their five usual meta-regions.
2.3. Interpretation of NDCs
Countries used different formats to express their mitigation effort in their NDC [26]. A first set of countries put forward an absolute target, whereby GHG emissions levels for the target year are provided or can be readily inferred from the data provided (reduction with respect to a reference year or a business as usual (BAU) scenario which is explicited in the NDC, emission value in target year). A second set of countries express their target relative to a BAU scenario that is not explicited in the NDC or in terms of a reduction in the carbon intensity of GDP without providing a forecast of the GDP. A third set of countries only provide sectoral indications that do not per se allow to infer an emission reduction target (table S1). Furthermore, China has indicated a CO2 emission peaking date target before 2030. China and India also provide additionnal targets in terms of share of non-fossil fuels, of the total primary energy supply for China and of the power generation capacity for India.
We use the latest updated versions of NDCs, as of November 2017. We treat one by one all 103 Parties (among which the European Union represents 28 countries) for which the NDC contains enough information to compute GHG emissions levels for the target year. We lump the remaining 64 countries in several groups for which additional assumptions are required. We present results for the 23 largest emitting countries (representing 80% of 2010 global GHG emissions), but the results for all countries are presented in a file and code provided as supplementary material. The countries other than the 23 largest emitters are separated in four groups (table S1): Other Annex 1, Other Emerging, Other Oil exporting countries and Rest of World (representing 0.7, 1.7, 0.4 and 14.7% of 2010 global GHG emissions, respectively). A detailed description of our treatment of NDCs is provided in the supplementary material (section 1).
2.4. Treatment of the Chinese and Indian NDCs
Two of the main elements of the Chinese NDC (i.e. a reduction in the carbon intensity and a peak emission before 2030) refer specifically to CO2 emissions other than from LULUCF. We take this into account by first estimating CO2 emissions for 2030 (excluding LULUCF), which are then converted to CO2eq using a CO2eq to CO2 emissions ratio (R). Our derivation of this ratio is described in the supplementary material (section 7).
The Chinese NDC also includes a target to peak CO2 emissions before 2030. This requires the reduction rate of the carbon intensity in 2030 to exceed the growth rate in the same year. In order to account for this in our analysis, we first interpolate the GDP growth rate in 2030. We then convert the overall carbon intensity reduction target into a time profile and, if necessary, iteratively increase it until the annual rate of carbon intensity reduction in 2030 exceeds the GDP growth rate in the same year. We further describe and justify our approach in the supplementary material (section 6), including the reasons and limitations of not considering the non-fossil fuel targets for China and India (section 8). Estimated emissions for China are compared to current trends on figure S3.
2.5. Treatment of the LULUCF emissions
Our treatment of LULUCF emissions is indicated in table S4 and described in the supplementary material (section 3). We also account for the LULUCF elements of NDCs when provided.
2.6. Monte Carlo uncertainty analysis
The first part of our study focuses on an uncertainty analysis of the 2030 global GHG emission level. To determine the uncertainty range surrounding the 2030 emission level, a Monte Carlo method (N = 50 000 runs) is used for each of the 20 GDP scenarios. Uncertainty for each GDP scenario is generated by varying the following parameters: ambition level of the NDC (including the ranges mentioned in some NDCs); our set of assumption for countries with NDCs providing either only sectoral or incomplete information; emissions level for international aviation and shipping; LULUCF emissions reduction for India and the Rest of World; the choice of the intensity reduction profile (parameter λ) for China, and the CO2eq/CO2 ratio for China (parameter μ). Note that the above-mentioned ambition levels are assumed to be the same for all countries. In other words, they are perfectly correlated in our Monte Carlo simulation. This follows the idea of a virtuous circle between countries as part of the Paris Agreement. Whenever there is a range, whether it is indicated in the NDC, refers to unconditional and conditional statements in the NDC or assumed from our expert judgement, we consider variations within the range and refer in a generic way to the 'ambition level' of the NDCs. Note that when only a conditional target is provided, we assume the unconditional target to be no effort compared to BAU emissions, thus generating a range. Unless stated otherwise we assume a uniform probability distribution within the range. This implies in particular that on average half of the additional effort of going from low to high ambition level would be carried out. Finally, a 1 000 000 member ensemble is made by aggregating the 20 ensembles corresponding to the 20 GDP scenarios considered with equal weight. The uncertainty attributable to a particular driver is estimated as the ratio in the variance of the 2030 emissions caused by that driver to the total variance. Covariances between the different drivers are gathered in a residue termed 'Interactions of all drivers'. In the second part of this study, where we analyze the evolution in emissions distribution among countries, we do not consider sources of uncertainty other than that of the GDP scenarios, but use average values for all relevant uncertain parameters. Unless otherwise stated, all our confidence intervals represent 5%−95% uncertainty ranges.
3. Results and discussion
3.1. GHG emissions in 2030
The GHG emissions levels in 2030 are available at the country level in the supplementary material. We find that NDCs imply 2030 global GHG emissions of 61.7 (56.8–66.5) Gt CO2eq yr−1 (figure 1(a)). This is higher than in previous studies (see table 1 for a comparison) with the lower bound of our uncertainty range corresponding to the upper bound of most published estimates. Our uncertainty range is also larger than most of those published so far, which is essentially because we consider a range of GDP scenarios rather than a single scenario. Figure S5 displays the probability distributions of 2030 global emissions grouped by SSP narrative and by GDP data source. For the SSP2 OECD scenario, which is often used as a marker scenario, we find 2030 GHG emissions to be 61.8 (58.4–65.0) GtCO2eq yr−1. The uncertainty range is then comparable to previous estimates, but it is shifted to higher values, meaning that our mean estimate is still higher than previous estimates. It is unfortunately not possible to gain a full understanding as to where the differences in the median value come from because no single study publishes their emission estimates for all countries.
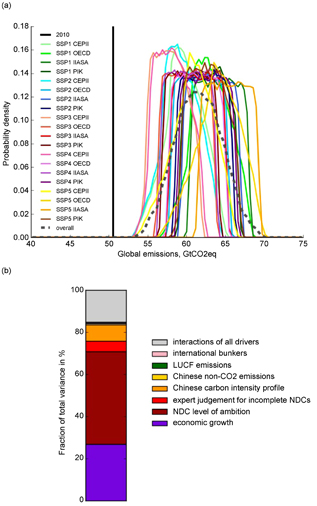
Figure 1. Global greenhouse gas emissions distributions and uncertainty analysis in 2030 based on sole and full achievement of the NDCs. (a) Probability distribution function (PDF) of global greenhouse gas emissions (Gt CO2eq yr−1) in 2030 for the 20 GDP scenarios based on the five Shared Socioeconomic Pathways (SSP) and four different data sources (CEPII, OECD, IIASA, PIK) (colored lines), overall distribution for all scenarios (dashed line) and 2010 emissions (black vertical line). See figure S5 for a decomposed version of figure 1(a), per SSP narrative and per GDP data source and figure S6 for a version without correction of the EDGAR Chinese historical emissions. (b) Fraction (%) of the total variance in 2030 global emissions explained by the various identified drivers. See figure S7 for a detailed version.
Download figure:
Standard image High-resolution imageTable 1. 2030 emission levels at the global scale and for a few large countries, as estimated by various studies cited in the present analysis. Default: emissions expressed in CO2eq including LULUCF. a: The second line is for conditional NDCs, b: CO2eq excl. LULUCF, c: EU-15 only, d: estimation for 2025. Uncertainty ranges in parentheses correspond to the following percentiles: UNFCCC 20%–80%; UNEP 10%–90%; den Elzen min-max; Rogelj et al min-max; this study 5%–95%. Fawcett et al use three groups of scenarios based on different population and GDP assumptions; we report values from the medium reference scenario, and uncertainty ranges are the low and high reference scenarios.
| UNFCCC [2] | UNEP [4] | Fawcett et al [5] | Vandyck et al [8] | den Elzen et al [7] | Rogelj et al [9] | This study (all scenarios) | This study (OECD SSP2) | |
|---|---|---|---|---|---|---|---|---|
| Globea | 56.2 (52.0−59.3) | 55.2 (51.9–56.2) 52.8 (49.5–54.2) | 52.8 (50.7–54.1) | 56 | 54.5 (53–58) 52.0 (51–56) | 52.3 (47.1–62.9) | 61.7 (56.8−66.5) | 61.8 (58.4–65) |
| United States | 4.6–4.8d | 4.0 | 4.4b | 4–4.1 | 4.3 (4.2–4.4) | 4.3 (4.2–4.4) | ||
| Europe (EU-28) | 3.2 | 2.4c | 3.3b | 3.4 | 3.3 | 3.3 | ||
| China | 14 (13.2–15.3) | 14.1 (13.3–14.2) | 15.0a | 14.0 (12.6–16.8) | 16.4 (14.5–18.2) | 16.8 (15.9–17.6) | ||
| India | 5.9 (4.8–7.9) 5.1 (4–6.2) | 5.3 (5.1−5.7) | 5.2a | 4.2 | 7.6 (5.8–9.1) | 7.0 (6.9–7.1) |
Nevertheless one likely reason for this difference in emissions is that, unlike previous studies, we do not consider the impact of current policies which are not (yet) reflected into a high-level NDC target. In particular, a large part of the difference appears to come from the Chinese CO2 emissions. We find a 5%–95% uncertainty range of 11.8–15.7 Gt CO2 yr−1 (without LULUCF) in 2030, which accounts for uncertainties in the GDP scenario and the profile of the carbon intensity reduction (see figures S2 and S7). For the SSP2 OECD scenario, the range in Chinese CO2 emissions is 13.3 to 15.0 Gt CO2 yr−1 in 2030. The peak target does or does not constrain the 2030 Chinese emissions depending on the choice of parameters in our Monte Carlo. As expected the peak target is constraining more often when the decrease in the carbon intensity is assumed to be more exponential and less linear. Overall, accounting for the peak target reduces the lower bound of the 2030 Chinese CO2 emissions by ~0.5 Gt CO2 and the upper bound by ~1.2 Gt CO2, while the average is reduced by ~0.6 Gt CO2. For all scenarios and GHG, we find 2030 emissions of 16.4 (14.5–18.2) Gt CO2eq yr−1. One reason for our larger emissions for China is the occurrence of high, long-lasting GDP growth in many of the scenarios considered (see figure S1(c) for 2030 growth rate descriptions and figure S2 for their impact on the peak constraint). For comparison, analyses based on Chinese five-year plans up to 2030 assume GDP growth decreasing from 5.5% yr−1 for 2021–2025 to 4% yr−1 for 2025–2030 and 3.5% yr−1 for 2030–2035, which corresponds to the lower bound of the SSPs scenarios, and find a peak of Chinese emissions between 2025 and 2030 at around 12.7 GtCO2 yr−1 [27, 28]. The other reason for our larger emissions is that in a number of previous estimates, the carbon intensity reduction target and/or the peaking before 2030 target are overachieved (see section 8 of the supplementary material). As Chinese emissions appear to have increased again over the past year following a stagnation for a couple of years [29], it will be important to monitor future trends to confirm whether the Chinese NDC will indeed be overachieved.
An equal part of the difference between our estimate and previous estimates comes from Indian emissions. The GHG emissions for India are projected to be 7.6 (5.8–9.1) Gt CO2eq yr−1 in 2030. It should be noted that the GDP growth projected by India in its NDC is in the higher end of the range of GDP growth of the SSP scenarios. Therefore, here the main reason for our larger estimates comes from the fact the Indian carbon intensity target is overachieved in previous studies.
The differences about Chinese and Indian estimates represent together about 70% of the difference in global 2030 emissions. The rest of the difference between our estimate and previous estimates may be due to the treatment of other countries, the level of disaggregation for small countries, the choice of global warming potentials to compute carbon dioxide equivalent emissions, the treatment of emissions related to land use, and the treatment of international aviation and maritime shipping.
Our results in terms of 2030 emissions can also be compared to the IAM quantifications of emissions trajectories for the combinations of the five SSP socioeconomic pathways and various radiative forcing pathways. Section 12 from the supplementary material presents such a comparison at the level of five world regions (see figure S9). We find that our quantification of emissions levels in 2030 corresponding to NDC for Asia is at the higher end of IAM quantifications, whereas they are at the lower end for OECD countries and in the middle of the range for other regions.
The uncertainty range for 2030 global emissions results from multiple drivers (figure 1(b)). With 44% of the total variance explained, the NDC ambition level is the most important source of uncertainty. Our set of assumptions to interpret NDCs further explains 5% of the total variance, Future economic growth is also a sizeable source of uncertainty, across SSP scenarios (7%) and especially across GDP data sources within each SSP scenario (20%) (figure S7). The relative importance of uncertainty related to economic growth is not surprising given the fact that we consider a large range of GDP values for 2030, while a number of key emerging countries have expressed their NDCs with carbon-intensity targets. However the fact that the different GDP interpretations of the SSP are leading to larger differences in global emissions than the different SSP is more unexpected, highlighting the heterogeneity of GDP projections even when following similar narratives. The choice of carbon intensity reduction profile for China explains 7.6% of the total variance. Other identified sources of uncertainty, related to LULUCF or international aviation and shipping, are small. This does not mean the corresponding emissions are not important though, since the share of international aviation and shipping in global emissions increase from 2.3% in 2010 to 3.0 to 3.7% in 2030. The total uncertainty due to LULUCF is more important than shown in the figure, as our estimate only bears on LULUCF emissions from the few countries that have provided separate targets for LULUCF in their NDC; for numerous countries this uncertainty is contained in the NDCs themselves [30]. The term 'interaction of all drivers' arises from covariances between all drivers. In terms of countries, uncertainties on 2030 emissions are largely driven by uncertainties on Chinese, Indian and Rest of World countries' emissions (figure S7).
3.2. Distribution of GHG emissions in 2030
Notwithstanding the uncertainty surrounding 2030 global emissions, NDCs announce a significant change in the distribution of emissions among countries. This evolution reflects the combination of demographic and economic dynamics with mitigation efforts across the world. As shown in figure 2(a), emissions from the United States, the European Union and LEA countries are all lower in 2030 than in 2010, whereas emissions from China, India, countries from the 'World Other' group, international transport and to a lesser extent LENA countries are larger in 2030 than in 2010, whichever GDP scenario is considered.

Figure 2. Contributions of main countries and groups of countries to 2010 and 2030 global emissions based on full and sole achievement of the NDCs. Absolute (a) and relative (b) contributions of countries and groups of countries to the global emissions in 2010 and 2030, for the five different Shared Socioeconomic Pathways (SSP) and the four different data sources (from left to right: CEPII, OECD, IIASA, PIK). LEA stands for large emitters with NDCs containing an absolute reduction with respect to a base year target (gathering Australia, Brazil, Canada, Japan, Kazakhstan, Russia and Ukraine). LENA stands for large emitters with NDCs not containing an absolute reduction with respect to a base year target (including Egypt, Indonesia, Iran, South Korea, Malaysia, Mexico, Saudi Arabia, South Africa, Taiwan, Thailand, Turkey and the United Arab Emirates).
Download figure:
Standard image High-resolution imageEmerging and developing countries will represent in 2030 a larger share of global emissions than in 2010 (figure 2(b)). In particular, the combined shares of China and India could reach up to 37%–41% in 2030, against 28% in 2010. The share of the United States, the European Union and LEA countries would decrease, from 38% in 2010, to a range from 22%−25% in 2030, depending on the GDP scenario considered.
We also analyse international inequalities in per capita GHG emissions. We find a noticeable reduction in such inequalities (see supplementary material section 13, figures S10–12).
3.3. Relation with long-term mitigation goal
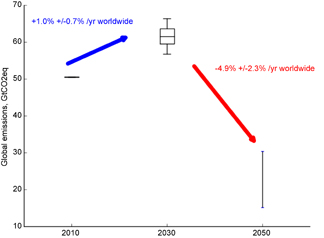
Assessing whether current NDCs put countries on track to the long-term goal of 'keeping warming well below 2 °C and do best efforts to maintain it under 1.5 °C' [1] is not a straightforward task. Indeed, it implies building scenarios until the end of the 21st century [31] and judging on how fast emissions can be reduced after 2030. A less questionable way of assessing aggregated NDCs is to compare the implied 2030 global emissions to the worldwide GHG emissions reduction target of 40%−70% in 2050 compared to 2010 reported in the IPCC Fifth Assessment Report for scenarios aiming at limiting warming to 2 °C with a >66% probability [32, 33]. These scenarios correspond to a range of permissible emissions of 15 to 30 Gt CO2eq yr−1 in 2050. As shown in figure 3, our interpretation of NDCs results in an average global emissions growth of 1.0% ± 0.7% per year between 2010 and 2030. However, this hides large regional disparities, with e.g. an average emission reduction of 5.1% per year in Brazil, and 5.1% per year emission increase in India. Connecting the NDCs' 2030 global emission level to the 2 °C compatible range in 2050 requires an average annual worldwide reduction rate in emissions of 4.9% ± 2.3%. Note that uncertainty for 2030 emissions is mainly due to economic GDP scenarios and NDCs interpretation (figure 1(b)), whereas the 2050 range results from uncertainty on achievable emissions trajectories and technology developments during the second half of the 21st century.
Figure 3. Global emissions and uncertainty ranges in 2010, 2030 and 2050. The 2030 range is determined based on full and sole achievement of the NDCs, while the 2050 range coresponds to the Intergovernmental Panel on Climate Change (IPCC) milestone if global warming is to be limited to 2 °C since pre-industrial times (i.e. 40% −70% emissions reductions in 2050 compared to 2010). The uncertainty range is shown for 2030 in the form of a box-and-whisker plot representing the fifth percentile, first quartile, median, third quartile and 95th percentile values. Arrows indicate the average rate of change in annual global emissions for the periods 2010–2030 and 2030–2050.
Download figure:
Standard image High-resolution image
4. Conclusion
We have evaluated the level of global GHG emissions in 2030 if all countries would exactly reach the target stated in their NDCs. We find a 5%−95% uncertainty range of 56.8–66.5 Gt CO2eq yr−1, and show that the main sources of uncertainty is the ranges of ambitions given in NDCs, and the uncertainty on the economic growth of countries who expressed their target in terms of intensity. We show that, despite this uncertainty, NDCs provide robust evidence of a shift in GHG emissions towards emerging and developing countries and a reduction in international inequalities in per capita GHG emissions.
These results have three main implications:
First, the large uncertainty surrounding the 2030 global GHG emissions makes a strong case for an improved common framework regarding future NDCs in upcoming negotiation cycles. In particular a growth assumption could be provided in the case of an intensity target and separate national targets for LULUCF emissions could be provided for countries relying significantly on carbon sinks.
Second, the growing share of emerging and developing countries' emissions in global emissions illustrates the importance of a universal agreement including all countries such as the Paris Agreement.
And third, the post-2030 emissions reduction challenge is emphasized: the most ambitious NDC (in terms of emissions reduction) implies an annual minimum reduction rate that should be matched on a global scale after 2030, in order to be on track by mid-century for limiting global warming to 2 °C. In particular, this result highlights how efforts needed after 2030 can be reduced if emissions for that year are contained to the lower part of the range (−4.2% yr−1 needed for 2030–2050 when at the bottom of the 2030 range, versus −5.5% yr−1 when at the top). In this framework, any action that can secure a 2030 emission level at the lower part of the range (such as conditional NDCs, e.g. funds and technology transfer between 'North' and 'South') makes the post-2030 challenge a bit less formidable. Furthermore, this result makes the case for a strong update mechanism, able to raise the NDCs ambition. Finally, even in the most ambitious scenario, a steep decrease in emissions will be needed for the period 2030–2050. Such a decrease should be prepared as of today [34], at the global, regional, national, and local levels and by all stakeholders.
We conducted this analysis at a highly disaggregated level (103 countries are treated individually) and with a minimal set of assumptions. This methodological choice implies both limitations and strengths.
On the limitation side, first, we do not account for uncertainty in historical emissions. Indeed, there is a lack of information on uncertainties in existing emission inventories at the country level. Having only a partial knowledge of 2010 emission uncertainties, we consider it more appropriate to consider a single value (although we do perform a sensitivity analysis on historical Chinese emissions in the supplementary material, section 10). Current effort to derive reliable emissions inventories at the country level should be pursued, especially in the land use sector, so that models can be better constrained and emission trends can be detected early on.
We also acknowledge that our methodology does not account for the energy component of NDCs that give targets for fossil fuel shares, and further developments should refine the method, or use its complementarity with other methods, in particular those relying on IAMs at the global or national scale, to address this limitation.
Furthermore, our methodology neglects feedbacks between emissions reductions and GDP growth: we only use the GDP quantifications of the SSP, not their emissions quantifications. While some IAMs include feedbacks from climate policies onto GDP projections, such a feedback is relatively small compared to both the cumulative economic growth until 2030 for these countries and the uncertainty on economic growth depending on the considered SSP. The effect of NDCs on welfare losses and impact on GDP has been estimated between ±1.6% for China and India, the two countries expressing their targets in terms of carbon intensity of GDP [6, 35, 36].
Finally, our approach does not account for a substantial source of uncertainty for 2030 emissions levels, namely which NDCs would be reached, overachieved or missed. It does not give elements on whether current or announced policies, which might result in smaller emissions than implied by the NDCs for some countries, are likely or not to allow reaching or overachieving the target. Therefore, it cannot be used to answer the question of what 2030 emissions are likely to be. Other types of analyses looked into this question. For instance, China presented a rather conservative intensity target in its NDC, and some analysists consider it likely to be overachieved [37]. Our analysis can thus only inform on what would emissions be if NDCs targets are taken 'at face value', i.e. if they would be exactly met. Such information can be used to highlight the need for NDCs update, and to track how updates would reduce 2030 emissions and the associated uncertainty.
Other methodologies, in particular those relying on IAMs, can address these limitations; but currently lack some of the strengths of our methodology, namely its high country resolution, its flexibility, and its transparency. To exploit these strengths, we are making the projections and the code available for other teams to reproduce, improve or update the analysis. In particular, alternative assumptions could be tested with the available code, e.g. growth assumptions different from those in SSPs since our results have shown that they are an important driver of uncertainty. Furthermore, our methodology could be extended to project cumulative emissions from today until 2030, to compare them to allowable budget for the 1.5 °C and the 2 °C targets. Doing so would require additional assumptions about the time profile of emissions to 2030, which is not directly available in NDCs, and would therefore introduce additional uncertainty. Also, our results could be compared to BAU or alternative climate policy scenarios projections at the country levels to allow further analysis, e.g. to answer the questions whether NDCs represent a significant difference relative to these projections or whether NDCs significantly change emissions distribution relative to these projections. Finally, the structure of our model makes it easy to update our results when new data or NDCs become available.
Acknowledgments
The authors would like to acknowledge grants from ADEME on the analysis of Intended Nationally Determined Contributions in relation to COP21 and the French Ministère de la Transition Ecologique et Solidaire (MTES) on climatic services.
Author contributions: HB, OB, CG and PC designed the study. HB performed the analysis. All authors contributed to writing the article.
Competing financial interests: The authors have no competing interest.