


Trying to get a sense of where the electrical market is headed next year? That may be a little trickier than usual. Electrical Wholesaling’s 2018 national forecast comes in at a rather-healthy +5%, but that number depends an awful lot on your market focus, where your company does business and some economic, demographic and political factors.
The overall U.S. economy. The overall U.S. economy is now in its ninth year of expansion. A Wall Street Journal report earlier this year said that in March, “the current economic expansion entered its 93rd month, surpassing the 92-month expansion of the 1980s, to become the third-longest in U.S. history.” Depending on when you want to peg the start of the economic expansion after the last recession and the start of the current bull market on Wall Street, we are now over 100 months into this run.
There’s an old saying on Wall Street that bull markets seldom die of old age, but more often from some unforeseen event, like a major global crisis or political event, or some unexpected turn of events in the financial markets (remember 2007?). The good times in the U.S. economy could keep on rolling right through 2018, or they could be derailed by one of these unforeseen “Black Swan” events.
The political scene. When President Trump was elected, construction economists had high hopes about the impact a major infrastructure bill could have on the construction industry, which in turn could have significant impact on the electrical market because commercial, public and residential construction combined account for more than 60% of the electrical supplies sold through electrical distributors, according to Electrical Wholesaling’s most recent Market Mix data. Now that infrastructure has taken a back seat to tax reform on Capitol Hill and the other end of Pennsylvania Ave., as it did with the attempt to repeal and replace the Affordable Care Act before that, economists have tempered their expectations. One of these construction economists, Kermit Baker, the chief economist for the American Institute of Architects (AIA), Washington, DC, had this to say when presenting AIA’s 2017-2018 Consensus Construction forecast at www.aia.org:
“Entering 2017, construction forecasters were quite optimistic about the near-term outlook for the industry. Not only was 2016 ending up with strong construction spending numbers — 6% across the entire nonresidential building sector, paced by more than 10% in the commercial categories — but 2017 was expected to be the year that federal fiscal policy would provide even more momentum for this market. Tax reform and financial deregulation were going to unleash investment capital, and the repeal and replacement of the Affordable Care Act was going to reduce financial burdens on small businesses. To top it off, a trillion-dollar infrastructure program over the coming decade would directly undergird strong construction growth for the foreseeable future.
“However, as of the mid-year 2017 update, the grounds of this euphoria are evaporating. Our economy has seen only about 2% growth (when annualized) over the first half of the year, and key elements of the Trump administration’s legislative agenda have made almost no progress.”
These factors, along with the other uncertainty in the economy, may have contributed to the wide range of forecasts in AIA’s annual Consensus Construction Forecast, which factors in forecasts from seven leading construction economists. For example, AIA’s consensus 2018 forecast for the all-important nonresidential category calls for 3.6% growth in 2018, but the forecasters weigh in all over the spectrum, with Dodge Data Analytics coming in at 5.3%; IHS coming in at 1.7%; and Associated Builders & Contractors at 1.8%.
The 2018 electrical market. When developing a 2018 sales forecast for your company, it’s helpful to consider the national economic picture and political climate along with forecasts for the overall construction market. But you need to spend the majority of time looking at key drivers affecting your segment or region of the electrical market. That’s where the rubber meets the road. As with what we saw with the forecasters that contribute to the AIA Consensus Construction Forecast, there’s also some daylight between some key national forecasts that annually measure the health of the electrical market —Electrical Wholesaling’s Market Planning Guide forecast for 5.1% growth in 2018, and Herm Isenstein’s DISC 2018 national forecast calling for 3.5% growth and a new era of slower growth several points below the industry’s historical average of 6% over the past 50 years.
Whether your company falls nearer one of these forecasts, somewhere in between, or outside this 3.5%- to-5.1% band of forecasted growth will depend largely on your company’s market focus and geographic reach. For instance, if your company is located in a fast-growing Sunbelt metro that sees regular population increases well over the national average; enjoys regular double-digit increases in building permits; and does more than the industry average of approximately 20% to 24% in residential business, you can probably expect to top EW’s 2018 forecast. On the flip side, if you are an industrially-oriented distributor whose sweet spot is in MRO business and your market isn’t expecting any significant new plant construction or renovation, you may be very happy to grab that 5% growth.
Reasons to be cheerful. As Electrical Wholesaling’s editors have analyzed the economic, employment and demographic data that have the most direct impact on the electrical market, we came away feeling pretty good about the potential for a decent year in 2018. One factor that very definitely stood out is the impressive number of construction projects with a total value of at least one billion dollars that have either broken ground over the past few months or are getting close to approval. We haven’t seen so many projects in this range in quite some time, and unlike in some recent years when large office or oil and gas projects reigned supreme, the projects underway or under consideration represent a diverse array of construction, including rail and mass transit, airports, data centers, massive downtown urban renewal projects and every sort of mixed-use project you can imagine, both in the urban core and out in the suburbs.
We have aggregated news reports of the largest of these projects into an online database for subscribers to Electrical Marketing newsletter at www.electricalmarketing.com as part of our expanded effort to provide estimates for national and local electrical sales potential and related economic indicators.
Another major driver that is near and dear to the hearts of any distributors who rely on contractors for much of their business is electrical contractor employment. On a national basis, electrical contractor employment hasn’t been this strong in at least 10 years, and the most recent trendline at press-time points to continued growth. For the first time since the 2006-2008 era, when construction employment was at its highest since the turn of the century, electrical contractor employment topped the 900,000 level. Just as a point of perspective, 800,000 electrical contractor employees on a national basis is a pretty health measure indicating a pretty healthy market. That’s why it would be significant if electrical contractor employment builds on a recent bullish move that began this July when it topped the 900,000 level, the first time it has hit that mark since 2008.
Not everyone gets turned on by data and numbers. But when it comes to electrical contractor employment, there’s one number that should attract everyone’s attention — each change of 10,000 employees equals an estimated $652 million in electrical contractor sales potential, when using Electrical Wholesaling’s sales-per-employee multiplier of $65,151 per electrical contractor employee.
One other statistic of note regarding electrical contractors for you data geeks out there may be an indication of future employment growth. When you compare the 3-month moving average for electrical contractor employment with its 12-month moving average since 2Q 2017, the 3-month moving average of around 3% growth is making a quiet move to outpace the 12-month moving average. If the current trend line holds it should cross that line in the next few months. That’s a good sign, particularly when you consider the rule of thumb for electrical contractor employment that the 3-month moving average typically leads the 12-month moving average by five or six months.
Reasons for concern. Some other measures of the electrical market that don’t look particularly pretty are some trendlines in the Value of New Construction data provided monthly by the U.S. Dept. of Commerce. When you strip out the residential data and focus on the core and most important total nonresidential construction data, the 3-month moving average moved below the 12-month moving average in June and has been decelerating since then. It also leads the 12-month moving average by five-to-six months, so the current trend is of concern. Nonresidential construction data is important to watch on a national basis, and you can get the latest monthly data in Electrical Wholesaling’s Electrostats department.
HOW TO USE THE MARKET PLANNING GUIDE
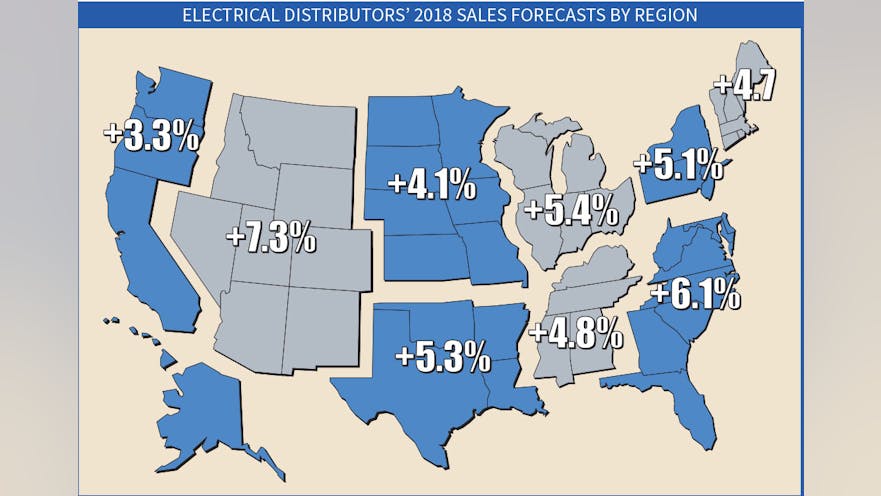
The market planning data in this issue is divided into nine regions of the United States. For each region, you’ll find sales forecasts for this year and next year, along with the three prior years’ sales. In addition to the sales forecasts, prepared by EW’s research department, you’ll also find an economic snapshot of the region and employment statistics for the typical distributors’ two largest customer groups — electrical contractors and manufacturing employees.
Methodology. Our forecasts are based upon responses to EW’s annual Market Planning Guide (MPG) survey. Each year, the magazine asks electrical distributors for their previous year’s final sales results, sales predictions for the current year, and predictions for the following year. It also asks respondents how sales for the first six months of the current year compared with the first six months of the previous year. We mailed 10,378 (both by mail and via e-mail) and received 232 usable responses for a 2.7% response rate. Respondents reported a mean sales-per-employee number of $541,100 for 2016, up from $535,332 in 2015. Regional sales-per-employee numbers are provided on slide 6. Be sure to check how your company’s productivity compares with the national and regional averages when it comes to sales-per-employee.
A note on our national sales base number. The base sales number for our national sales forecast comes from the Census of Wholesale Trade that the Commerce Department sends out every five years. Data from the most recent survey in 2012 was finally available in 2015 for the category that most closely defines our electrical market —“NAICS: 423610 - Electrical apparatus and equipment, wiring supplies, and related equipment merchant wholesalers” (specifically “Merchant wholesalers, except manufacturers’ sales branches and offices”).
The U.S. Commerce Dept. has a very broad definition of an electrical distributor, and its most recent data shows 13,789 branch locations run by electrical distributor. EW’s editors don’t believe that number is accurate because it’s more than double what EW’s editors have been able to verify for what most industry execs would consider to be distributors of electrical supplies. With such a huge branch count, the Census Dept. estimate for total industry sales isn’t realistic either, and we worked with Herm Isenstein, president, DISC Corp., Orange, CT, the electrical market’s leading economist, to develop a base sales estimate for 2012 of $86.5 billion. EW’s sales estimates for 2012 to 2016 and for the next five years (until the next Census of Wholesale Survey trade will be published again in 2020) will use this base national sales number for 2012.
EW’s editors will “bring forward” that number for an annual national sales forecast each year using the same survey methodology that Andrea Herbert, EW’s late chief editor, first developed in the 1970s for the Market Planning Guide.
DEVELOPING SALES ESTIMATES
When developing any market forecast, gathering some basic data on the size and makeup of the market is the first step. Let’s take a look at some of the ways you can crunch the numbers we’ve provided to tailor them to your business.
One of the most common uses of this resource is for developing a business plan, whether it be for internal use as your guide for next year or for a presentation to an investor or banker. You will need something that states the size of the local market, and these sales figures are a documented source you can use “as is.”
This data will also be helpful in establishing a sales forecast for your company and your region, comparing nearby or far-flung markets with an eye to opening or closing a branch, and evaluating promising areas of new business. One question distributors should ask themselves — and suppliers will be asking — is: “Are our sales into the market at the level they should be?” Look at the estimate of the overall sales in your market in comparison with your company’s sales.
Employment in major customer markets. In addition to sales forecasts, employment numbers make up a large part of the regional profiles. The number of people employed by a company or in an industry tends to rise and fall with the volume of business it’s doing. Employment figures, therefore, act as a gauge to business prospects and conditions in end-user markets.
- Employee counts can help you compare the relative sizes of various end-user groups in your area.
- You can also compare the make-up of one market area to another, and consider new customer markets or ones that you could be serving better.
- If you track the employment figures for each market over time, you’ll see broad economic trends unfolding in your market.
- You can also use these employment figures to make your own multipliers or you can use the national multipliers we’ve already calculated.
Multipliers. Each multiplier is a dollar figure that represents the average amount of electrical products distributors sell to each particular type of customer, on a per-employee basis or other “economic factor.” (See Electrical Wholesaling’s National Multipliers on slide 5). When used with the employment figures in the regional profiles, the multipliers help establish the amount of business electrical distributors could do with major customer groups in your area, and in total.
For instance, to find the number of electrical contractor employees in Addison, Ill., a city not detailed in the East North Central regional profile, you could contact the local Chamber of Commerce, a nearby union chapter, the state university, or the local library to track it down.
These multipliers come in handy if you want to approximate the amount of sales available from a particular account. For example, if a local manufacturer employs 300 people, by applying the multiplier of $761, you would expect the facility to purchase about $228,300 worth of electrical MRO products this year.
Using multipliers results in a dollar figure for market size that tells the level of business distributors in the area could do if every potential customer there bought a typical amount of product from them. It tends to be a larger number than actual distributor sales.
You can also use EW’s multipliers to track sales through different types of customers over time. Let’s do that for total U.S. sales to electrical contractors. Using EW’s national multiplier of $65,151 in sales for each electrical contractor employee and contractor employment through August of 901,200, that’s roughly $58.7 billion in sales.
Summary. We don’t expect sales in 2018 to be anywhere near the high end of the 4%-to-8% growth band we have seen in the electrical wholesaling industry over the years. But unless some unforeseen economic or political event or global crisis shakes up the market, 2018 should be a decent year. EW’s editors have the data and local analysis to help guide you through your 2018 business plan in this issue and in our Electrical Sales Potential data at www.electricalmarketing.com.