


Who are you?
I am a designer and researcher currently working at Pleo — a corporate credit card company. It’s been almost 4 years since I started my journey as a designer in Indore, India. I worked there for small companies and as a freelancer before going full-time. Currently I am residing in the beautiful Copenhagen, Denmark. The iPhone and computers sparked a sense of love and care for tech objects and digital experiences, which ultimately turned me into a designer.
What are you working on?
I feel really fortunate to work on lots of different projects in a short span of time. Currently, I am employed as a product designer, so my routine is to define the product experience and make them more functional and easy for users. It involves working on many prototypes every day and brainstorming. My favorite part is my involvement in the process of implementation of ideas on a wide scale and creating a product that serves a purpose in the real world. Working on a product with a high level of craftsmanship and making it easier to use is what I aim for.
Choose a favorite shot of yours. Why is it a favorite?
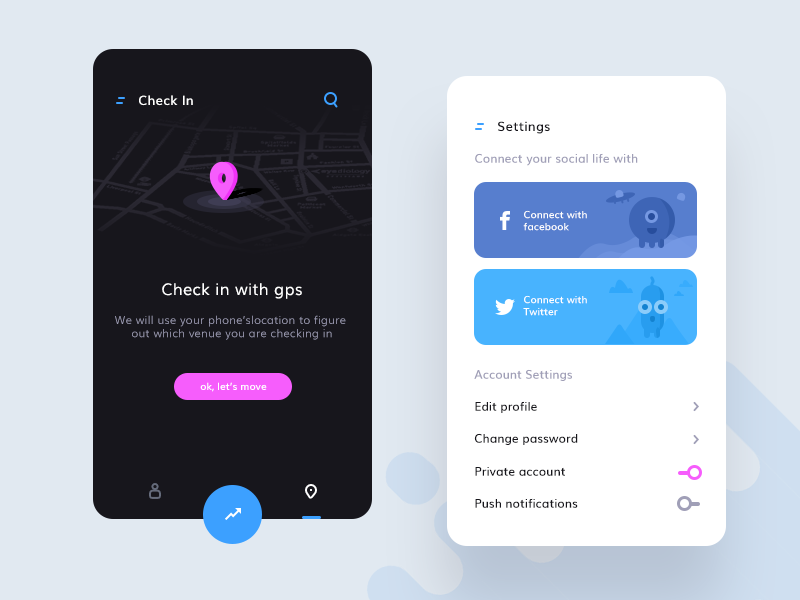
I did a social gathering app for which I created some sample screens. I really liked this because it creates an emotional connection with the user and lets the user get a feel for the app. I made some super cool and really cute characters for this demo which I used in the settings screen.
Tell us about your setup. What tools did you use to create the shot (e.g. hardware, software, pens, paper, blowtorch)?
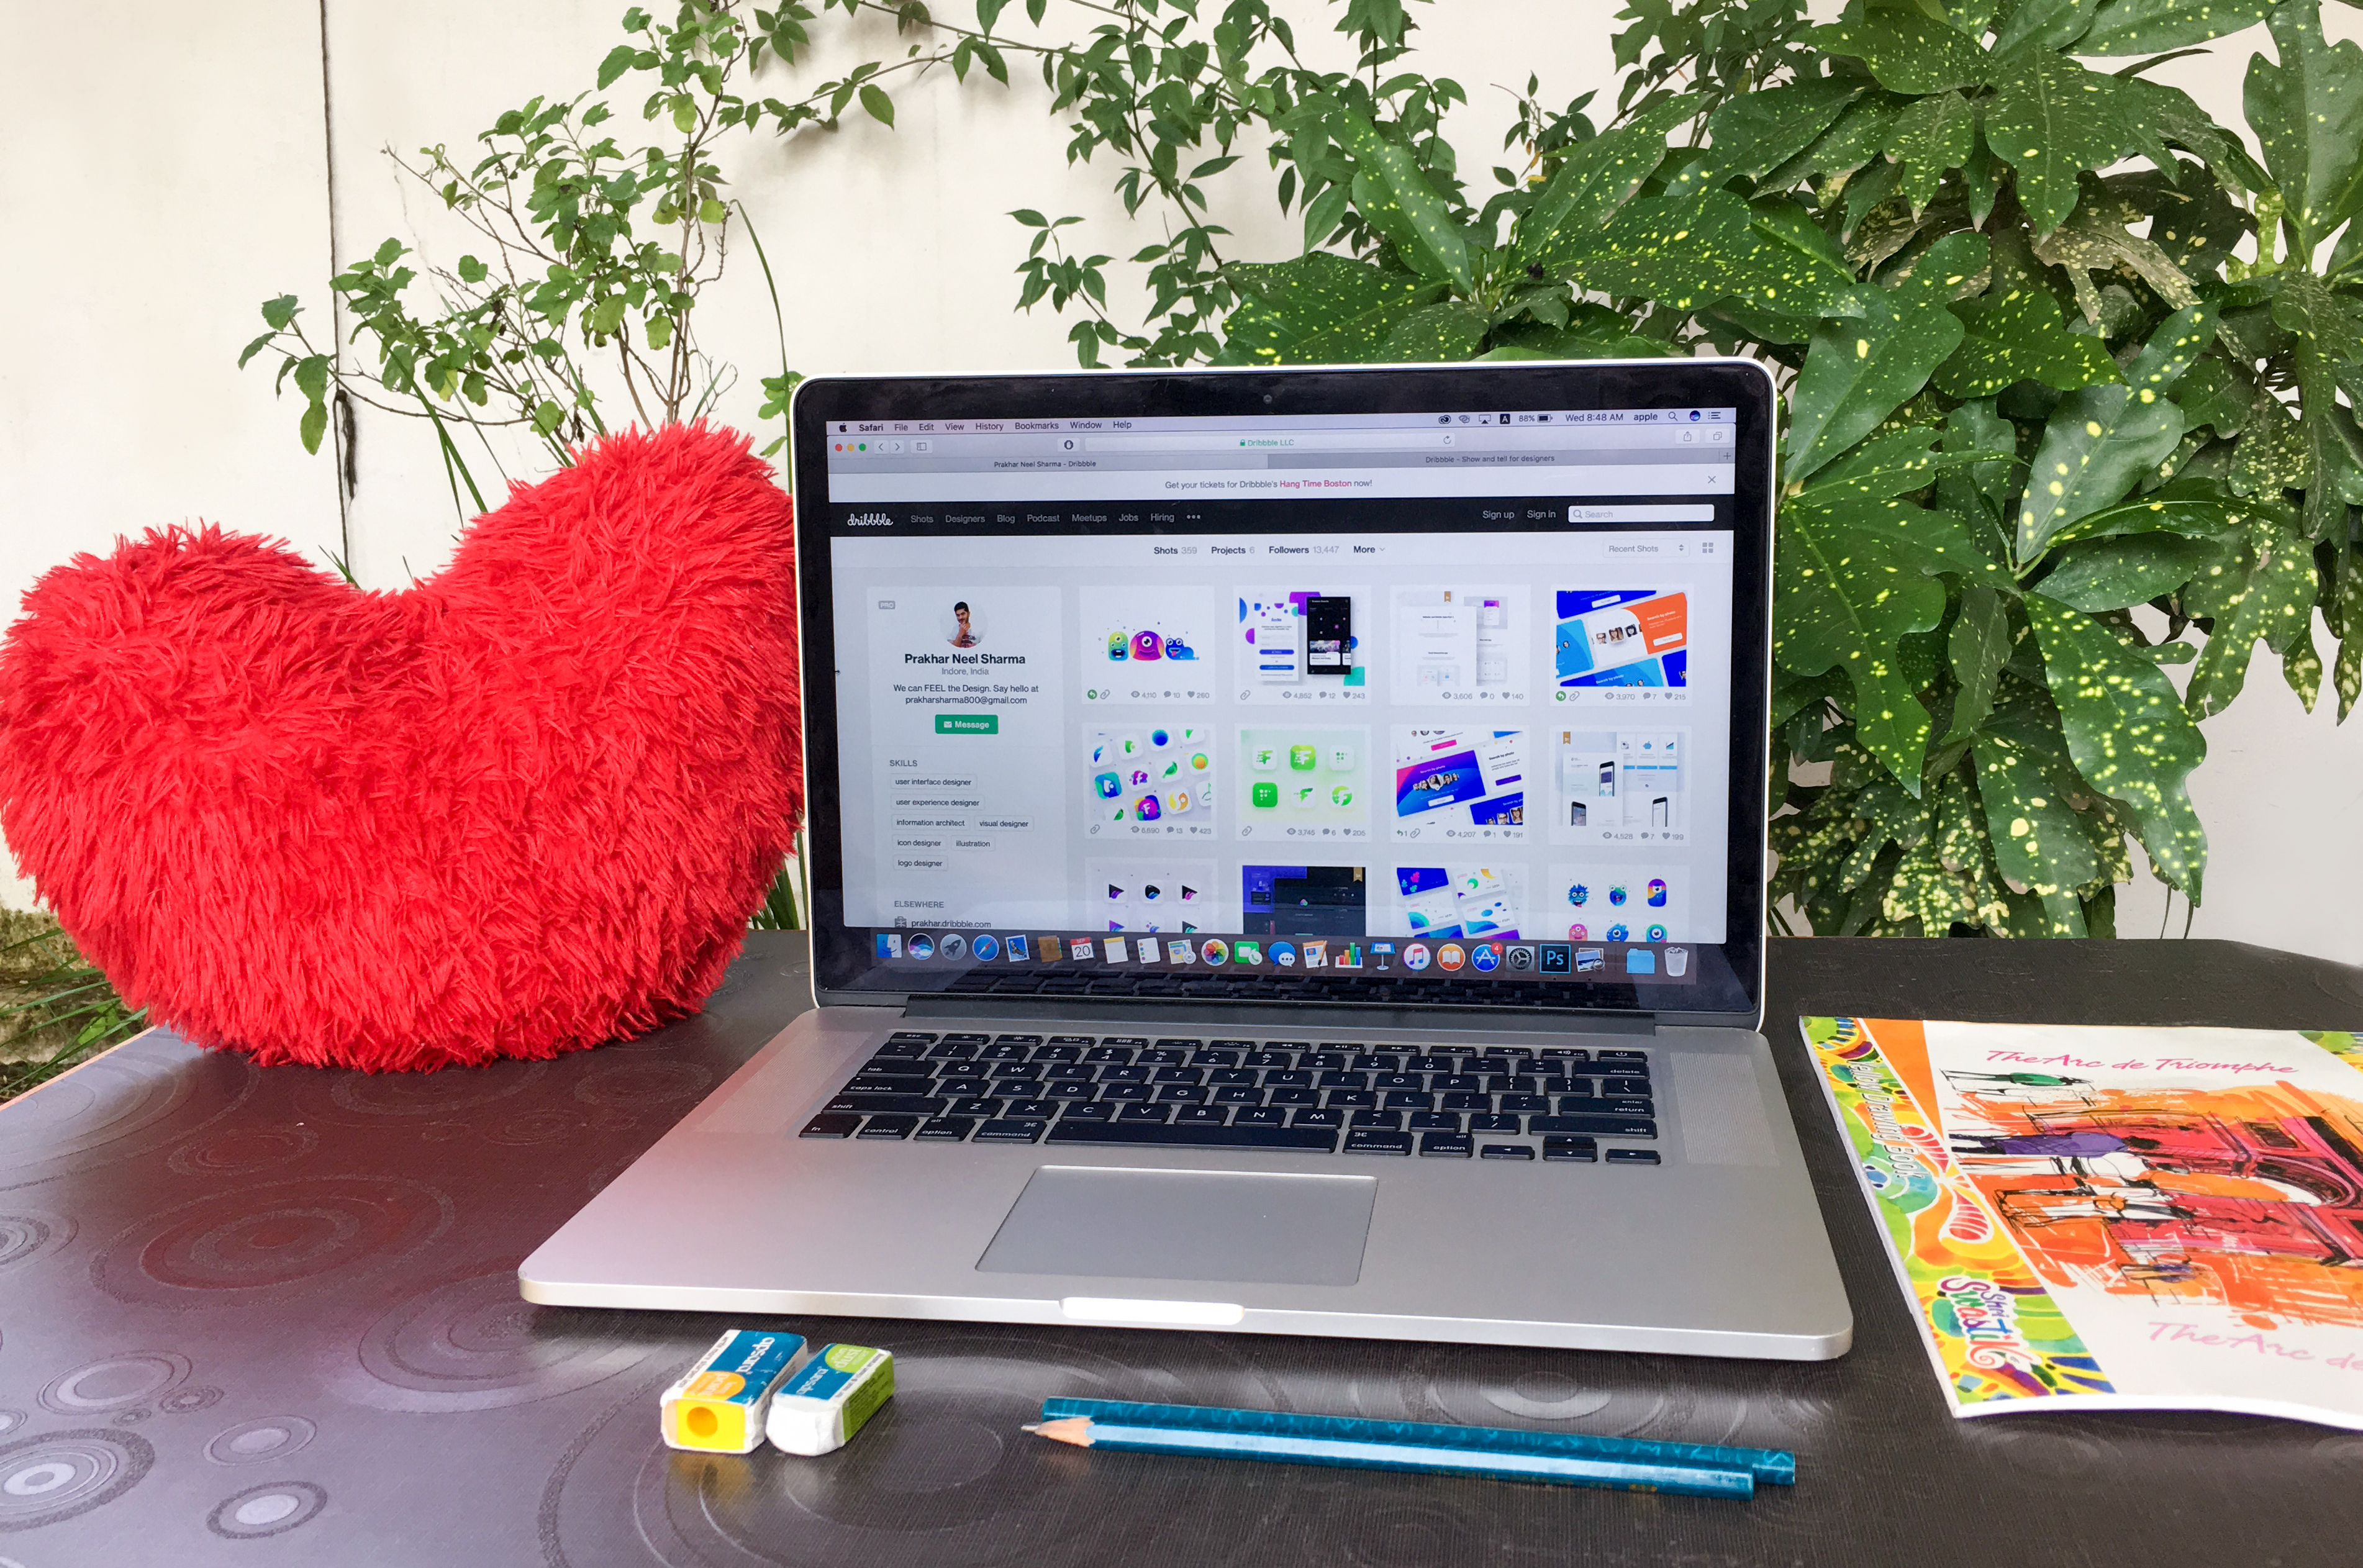
I really enjoy the process of creating design anatomy. My current table includes pencils, erasers, sharpeners, rulers, black pens, scattered A4 size paper, Legos, the India flag, and most importantly, a big bottle of cold water. My table is usually a bit messy. I usually prefer to start working on ideas with pencil or pen, then convert them into wireframes either with a pencil or using Sketch. Then comes the role of Photoshop or Sketch, which is my favorite part.
Choose a favorite shot from another Player. Why do you dig it?
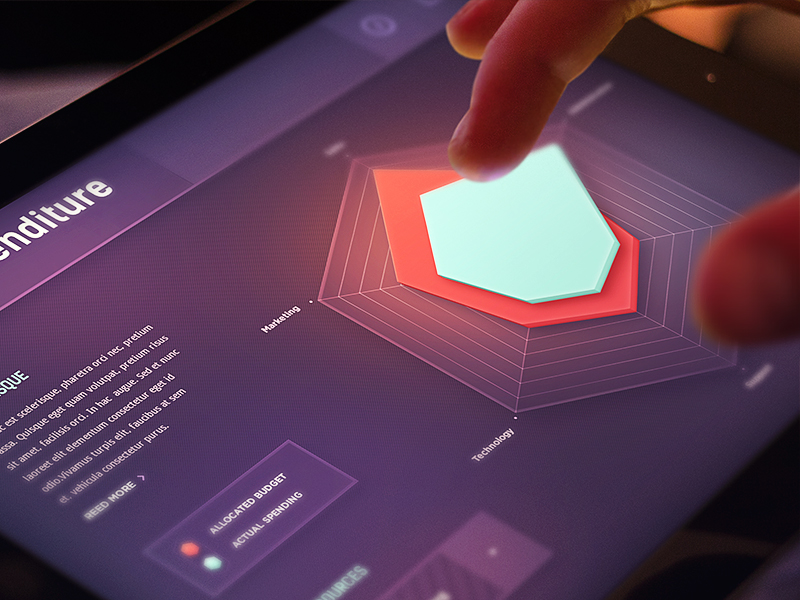
This shot by Mike is extraordinarily brilliant. I have looked at it hundreds of times! It clearly reflects a lot of care and dedication.
I am also generally a really a huge fan of Tobias Van Schneider and Mike Smith. They are the people who inspire me to design religiously! A sense of commitment, reverence, care, and a focus on intricate details are the values I learned from them. There is always opportunity to learn from the design community, and I am still a stepping-stone designer who makes mistakes and learns from other people.
Find Prakhar on Dribbble, Behance, and take a look at his Dribbble Playbook.
Find more Interviews stories on our blog Courtside. Have a suggestion? Contact stories@dribbble.com.


