
Originally published at nils-mehlhorn.de
Do you know what's going on in your Angular app when it's live? While
common to have logging set up on the server-side, it's often dismissed on the client-side. Yet, with more and more logic taking place in the user's browser nowadays we might want to keep a grip on the quirks our code might come up with in production.
Users won't contact you, they'll leave
As harsh as it sounds, without monitoring you're effectively assuming everything's working fine unless told otherwise. But be honest here for a second. When was the last time you clicked 'Submit Error Report' after an app on your phone crashed? And when there's no such reporting mechanism in place? Expecting users do draft up a detailed e-mail including what they did prior and which version of what browser they're using is, well, pretty optimistic. If something doesn't work, you'll try something else. Apps are mostly productivity tools. User's won't spend one more second on something that's supposed to save them time.
console.log won't get you far
Although there's some controversy on when to log or when to debug, the browser console is definitely a useful tool during development. However, everything you console.log stays inside your browser and once you deploy your application it won't run in just your browser anymore. You don't have access to people's browser console and therefore lose those precious stack traces which might've helped to fix a nasty bug.
Using Sentry in your Angular app
Sentry is an open-source error tracking solution that'll allow you to log errors beyond the browser console. You can run your own server or use the hosted variant (there's a free tier and if you're a student, you can also benefit from the GitHub Student Pack).
Once you've got either variant ready, you can install the JavaScript SDK by running
npm i --save @sentry/browser
Then you'll implement Angular's ErrorHandler interface like follows. You'll need the data source name (DSN) of your project for this, which will tell Sentry where to forward the errors.
import { Injectable, ErrorHandler} from '@angular/core'
import * as Sentry from '@sentry/browser'

@Injectable()
export class SentryErrorHandler implements ErrorHandler {

  constructor() {
    Sentry.init({
      dsn: '<your-sentry-project-dsn>'
    })
  }

  handleError(error) {
    Sentry.captureException(error.originalError || error)
  }
}
By implementing this interface we're able to catch all errors that occur in our application at a central point. This is enabled by zone.js which is used by Angular to wrap our app code and thus hook into any errors thrown. Now we just have to tell Angular to use our error handler instead of the default one - which would just log to the console. We do this by providing our error handler in the app.module.ts:
import { ErrorHandler } from '@angular/core'
import { SentryErrorHandler} from './error-handler'

@NgModule({
  ...
  providers: [
    {provide: ErrorHandler, useClass: SentryErrorHandler}
  ]
})
export class AppModule { }
Now any error thrown during runtime will show up inside Sentry. You might want to test this by just throwing an error somewhere in your code, e.g. in ngOnInit of your app.component.ts:
@Component({...})
export class AppComponent implements OnInit {

    ngOnInit(): void {
        throw new Error('Sentry Test Error') // TODO: remove
    }
}
It should show up in your Sentry dashboard like this:

Dealing with environments
There are some easy steps we can complete which will make our handling a bit more sophisticated. One thing you might have noticed is, that once you replace the default error handler, errors won't show up in the console anymore. We probably want those back for development purposes. Therefore we'll only provide our error handler in production environments by leveraging a provider factory:
import { ErrorHandler } from '@angular/core'
import * as Sentry from '@sentry/browser'
import { environment } from './../environments/environment'

class SentryErrorHandler implements ErrorHandler { ... }

export function getErrorHandler(): ErrorHandler {
  if (environment.production) {
    return new SentryErrorHandler()
  }
  return new ErrorHandler()
}
We can now use the factory to encapsulate the handler provision like this:
import { ErrorHandler } from '@angular/core'
import { getErrorHandler} from './error-handler'

@NgModule({
  ...
  providers: [
    {provide: ErrorHandler, useFactory: getErrorHandler}
  ]
})
export class AppModule { }
Also, if you've got multiple environments which should forward errors to Sentry but don't want them to get mixed up, you can tell Sentry about the environment it's running in during initialization. For that purpose we can maintain a property for the environment's name inside our environment.<name>.ts and pass it along:
class SentryErrorHandler implements ErrorHandler {

  constructor() {
    Sentry.init({
      dsn: '<your-sentry-project-dsn>',
      environment: environment.name
    })
  }

...
Providing context
A stack trace on its own is sometimes not enough to figure out why something went wrong. Sentry will additionally provide you with information about the user's browser, operating system as well as ip address. It'll also show you the url the user was on when the error occurred.
If you'd like to add more information, you can do so by modifying Sentry's scope. This way you could include the currently authenticated user in the error report:
const user = this.getUser() // get's user from some service
Sentry.configureScope(scope => {
  scope.setUser({
    id: user.id,
    username: user.name,
    email: user.mail,
  })
})
One thing that might trip you up here is getting the user inside your error handler. You'd usually do this through injection of a service (e.g. your NgRx Store). Yet, if you try injecting into the error handler, you'll end up with this error: Provider parse errors: Cannot instantiate cyclic dependency!
Since the error handler is an integral part of any Angular application, it's loaded at the very beginning before any of your regular services. It therefore can't depend directly on such services. You might get around this by depending on Angular's Injector and fetching the required service lazily in the handleError method. Yet, it might be cleaner to instead move the scope configuration out of our handler completely. Thus we'd configure the scope directly in response to a successful login. Not only would this resolve the cyclic dependency, it'd also minimize code in our error handler. This way it's less likely that we'll cause additional errors while reporting errors - possibly causing an endless loop. We can create a monitoring service for this purpose, which could look like this:
import { Injectable} from '@angular/core'
import * as Sentry from '@sentry/browser'

@Injectable({providedIn: 'root'})
export class MonitoringService {

  monitorUser(user: User): void {
    Sentry.configureScope(scope => {
      scope.setUser({
        id: user.id,
        username: user.name,
        email: user.mail,
      })
    })
  }
}
With this setup we can also easily test that monitorUser - and thus the scope configuration - is called from another service through dependency injection.
Besides attaching the user, you can also put key-value pairs into the scope or set a severity level. It's also possible to provide arbitrary extra content which might help you to reproduce a user's workflow. But watch out before dumping the whole application state because this field will only hold up to 200kB.
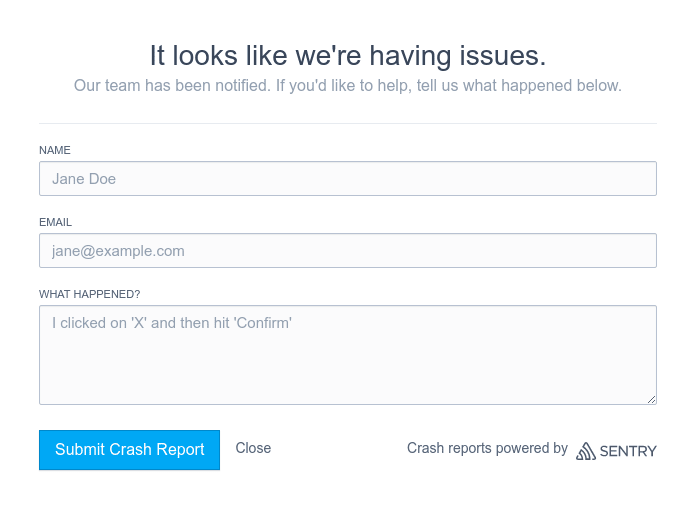
Collecting feedback
Sentry also has the ability to collect user feedback upon error. Even though it might be dismissed most of the times, it could serve as a helpful source of information at some point. You can initiate it in your error handler like follows:
const eventId = Sentry.captureException(error.originalError || error);
Sentry.showReportDialog({ eventId });
It'll open a modal dialog that looks like this:
Wrapping up
It's usually common sense to have some kind of monitoring for your applications. Yet, for browser applications this has been somewhat dismissed - probably because there weren't any sophisticated solutions like there have been for native mobile apps (e.g. Crashlytics).
Sentry and alike let you gain insight into what's going on in your Angular app and therefore develop with more confidence. And, with the presented considerations we were able to integrate it the Angular way.
There's also a bunch of other stuff you can do with Sentry such as tracking errors against releases and automatically filing bugs.


Top comments (10)
A quick question: I constantly have problems on setting up the source-maps if I don't provide them on the web-space along side the js files. Could you add some explanation on how to upload source-maps the right way using sentry-cli?
Would be really helpful. Thanks
Angular will generate source maps for you which you can serve alongside your regular assets and Sentry will just pick them up. Browsers won't load them until you open the developer tools - therefore that's what I do.
Alternatively, if you don't won't to serve the source maps, you'd upload them to Sentry for every release. Here are the docs on that: docs.sentry.io/platforms/javascrip...
You're assuming error can contain "originalError" property, I'm seeing this for first time - how such error can happen?
Angular's zone might wrap occurring errors in order to have error messages point to the place where an error occurred initially. You can see this in the sources here:
I couldn't find any precise docs on that, yet it's also done like this in the Sentry official examples. Therefore I thought it's best to keep the check in there.
Nice article, I'll give a try ❤️
I am having a hard time finding out if the server software is free. I want to host Sentry on AWS
Well, here's the license: github.com/getsentry/sentry/blob/m...
And here it's confirmed by a staff member: forum.sentry.io/t/is-running-a-sen...
After a quick search I also found posts about how to host on AWS :)
Thank for the answer. Do you know where I can download the server software?
Here's the official installation guide: docs.sentry.io/server/installation/
Have you considered integration with other players on the market, like bugsnag?