Early in March, Blissfully released their 2020 SaaS Trends Report. As with previous data they’ve shared, the report is full of highly interesting findings based on actual SaaS usage — not just what people claim they’re using when asked (which is usually underreported by half).
I was just getting ready to excitedly write a story about it when, well, the coronavirus pandemic escalated. The whole world started falling apart. Suddenly, a report on year-over-year growth in SaaS adoption didn’t seem quite as important.
Truthfully, it still doesn’t seem particularly important relative to everything else right now. But marketing and martech are still moving forward. And in many cases, adapting rapidly to these new circumstances. They will have a big part to play in business recovery on the other side. So it’s worth engaging with these topics, albeit with a modicum of perspective.
Besides, what else am I going to write about? Netflix shows? (Hmmm…)
The chart at the top of this post is the headline news of the report. SaaS adoption has grown significantly over the past year for businesses of all sizes:
- 1-100 employees: 29% to 155% more apps — now 102 apps on average
- 101-1,000 employees: 23% to 87% more apps — now 185 apps on average
- 1,000+ employees: 42% more apps — now 288 apps on average
(The ranges in percentage of growth are because Blissfully condensed their report from six segments of company size to three in their latest report. So not exactly apples-to-apples. But however you slice them, there are a lot more apples this year than last.)
Now, not all of these apps are net new functionality. Blissfully found that both “orphaned” apps — app subscriptions without a clear owner in the business — and duplicate instances of apps have grown too, up 100% and 80% year-over-year, respectively. On average, enterprises now have 4.3 orphaned apps and 7.6 duplicate apps.
Still, out of 288 apps in an enterprise on average, we’re only talking about 4% of “waste” in a typical stack — at least as measured by the number of apps. Not that bad in my opinion.
But number of apps is only one lens on SaaS adoption. Another is spend — how much money companies are paying for SaaS subscriptions. Blissfully’s five-year data on SaaS spend reveals some fascinating trends:
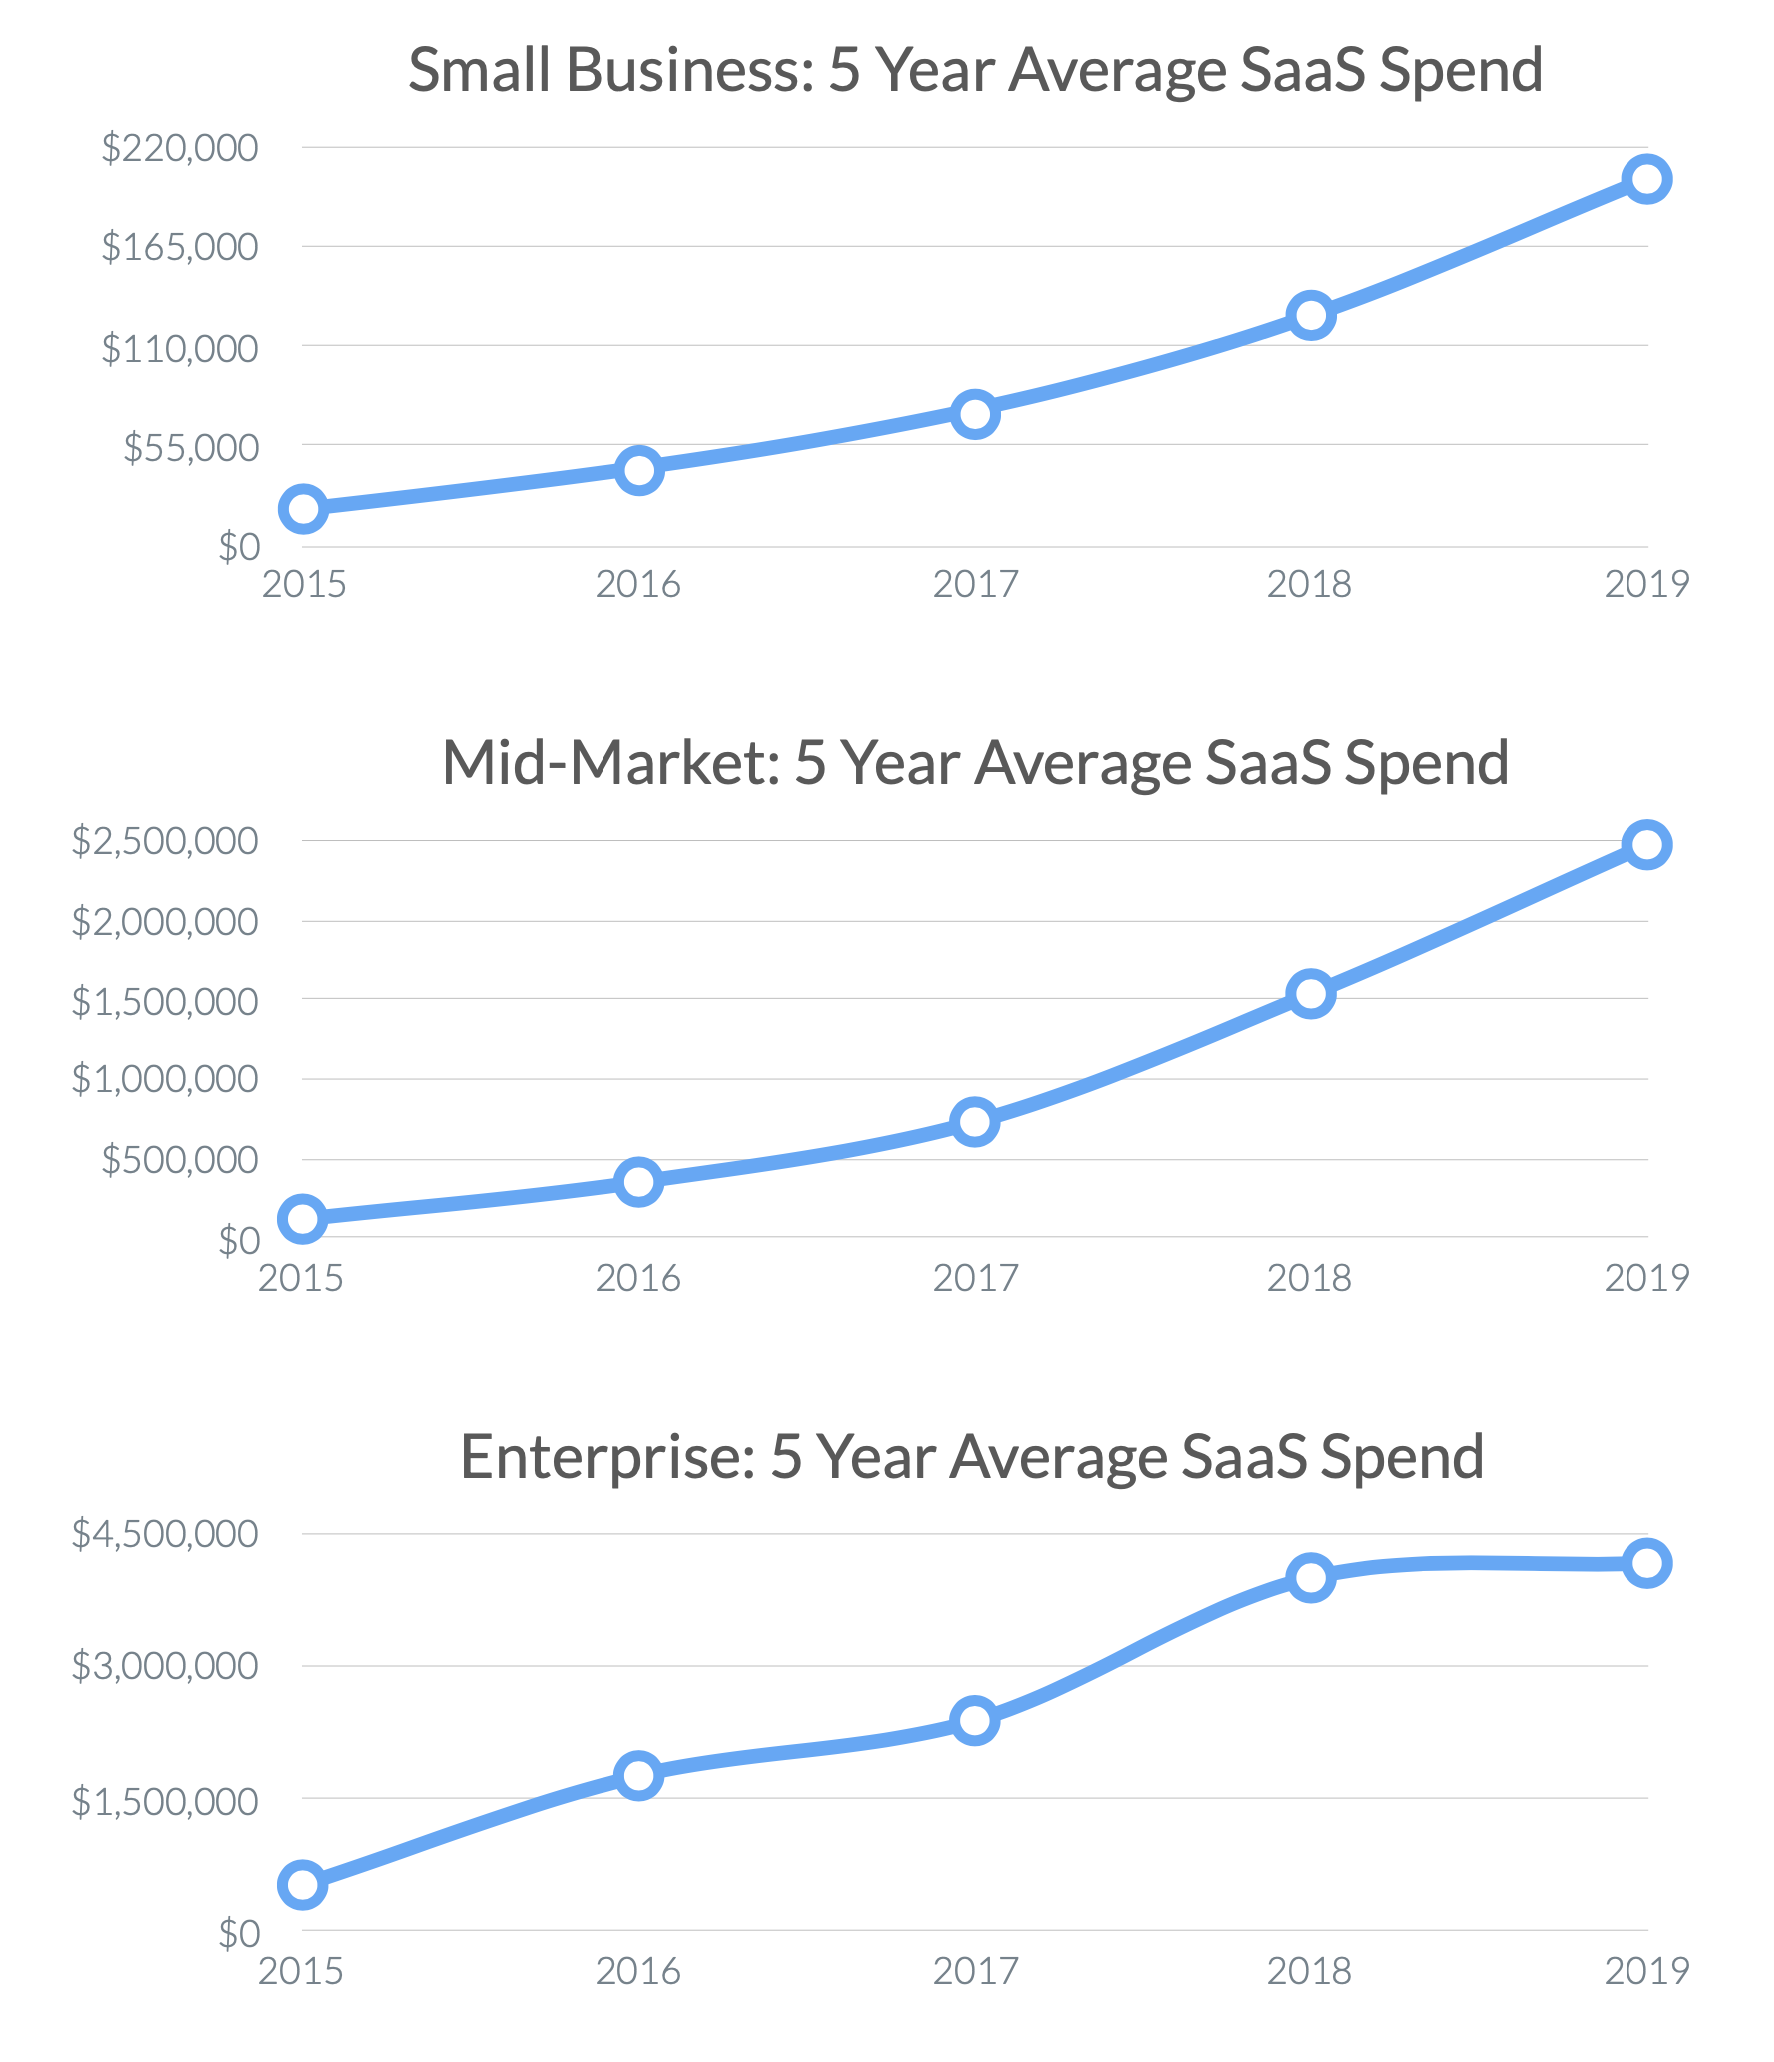
Note that SaaS spend over the past year for SMB companies has doubled 100%, for mid-sized companies it’s grown 66%, and for enterprise companies… it’s essentially been flat.
Juxtaposing these two different measurements, a really interesting phenomenon emerges in the enterprise segment: the number of SaaS apps in enterprise stacks has grown by ~42%, but their total SaaS spend has remained the same. Unless all their net new apps are free — I am sure some are, but not all — then either (a) costs for existing apps are falling or (b) expensive apps are being replaced by less expensive ones.
“Reducing expenses” is one of the top three reasons companies rip-and-replace martech, so it makes sense that latter dynamic is at play.
These numbers suggest it’s not an insignificant restructuring of apps within enterprise stacks. In theory, one of the advantages of a massive marketing technology landscape should be that all that competition would drive down prices. Many martech startups who have been chasing Clay Christensen’s trajectory of disruptive innovation may finally be having a substantial impact on the industry.
Better, cheaper, easier to use, and better integrated products can make a dent in the martech universe.
Of course, these trends aren’t limited to martech. It’s happening across all departments.
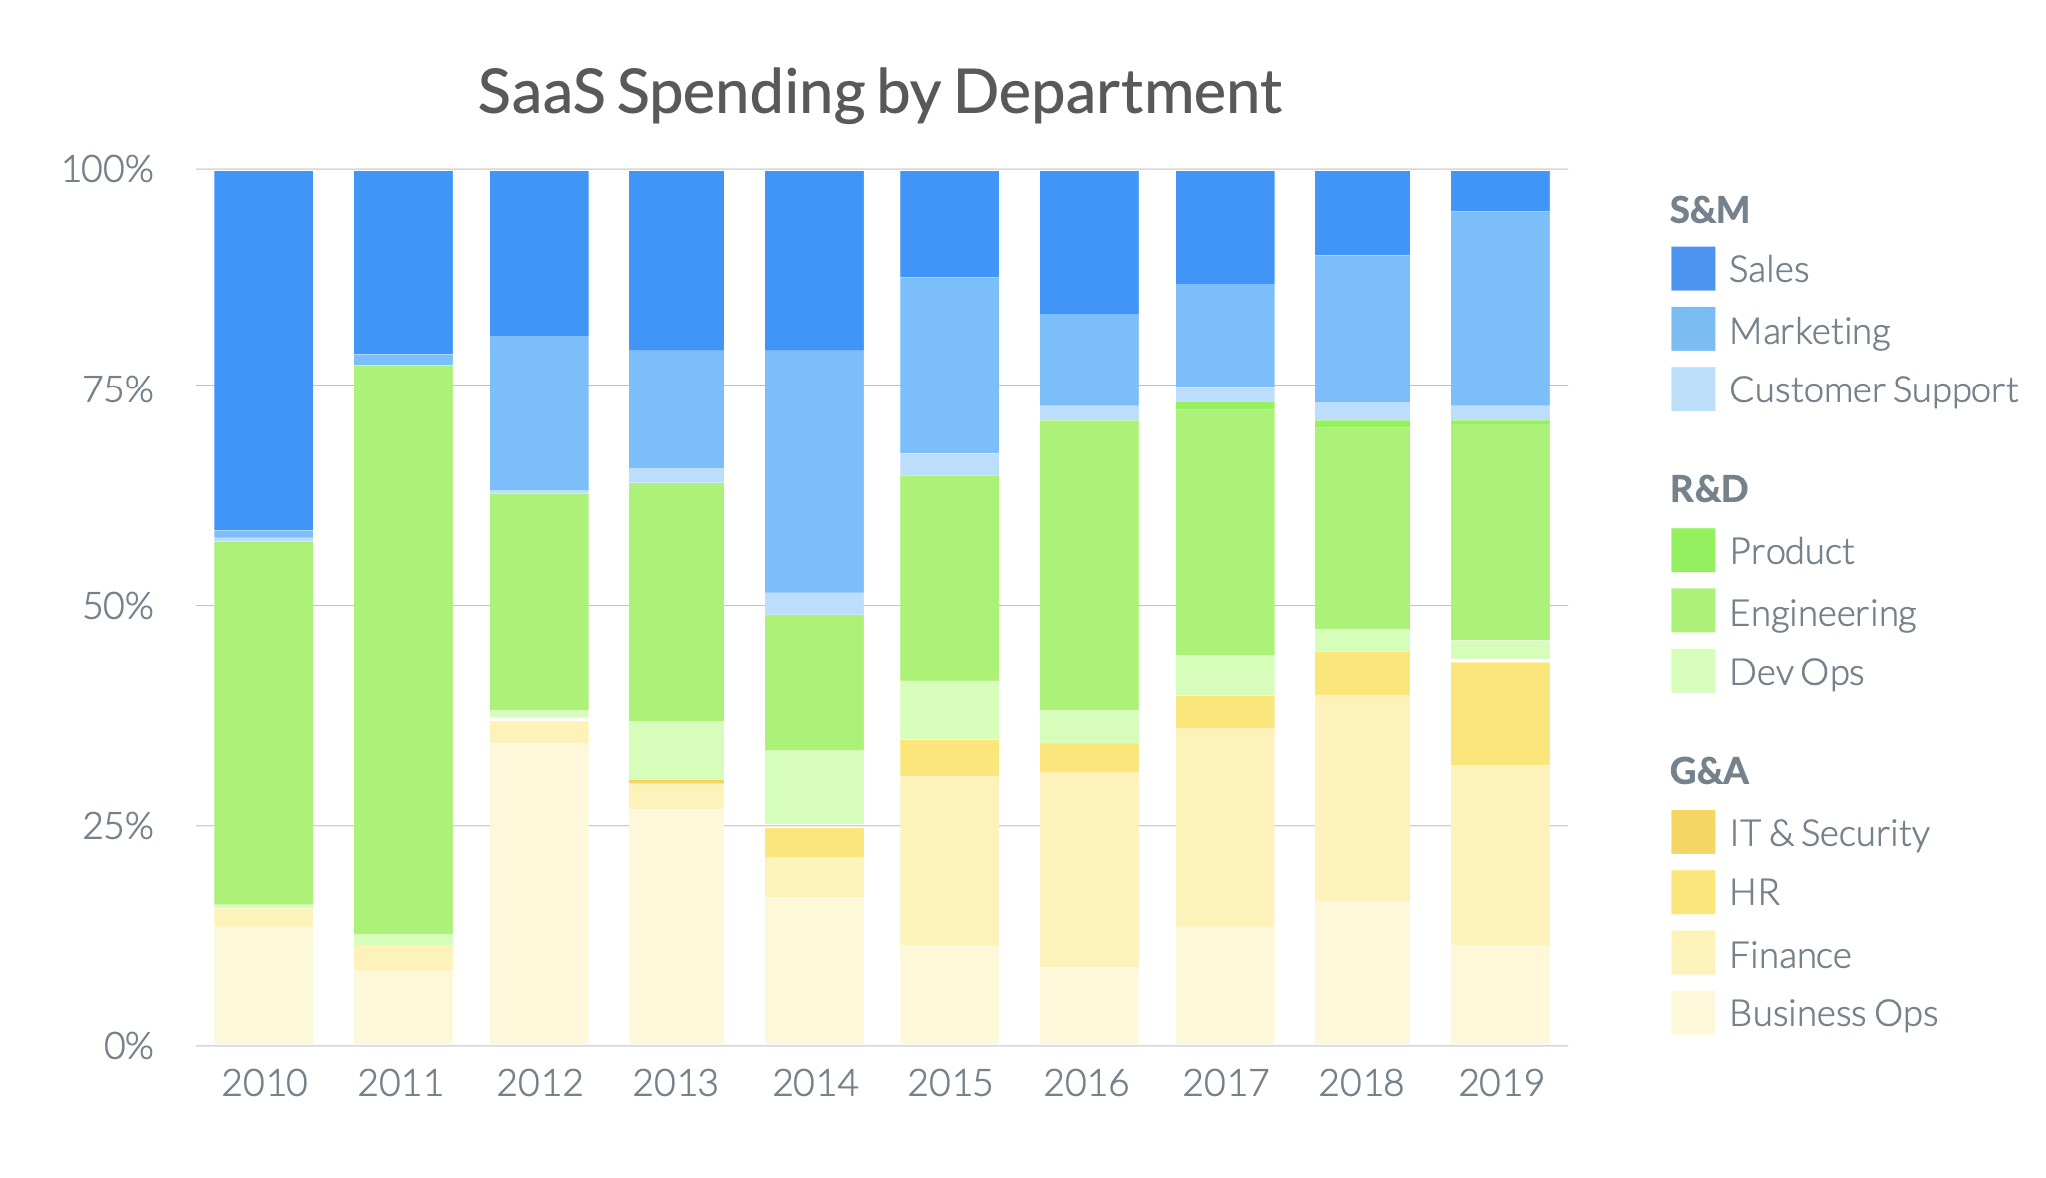
As a percentage of total SaaS spend at a company, marketing accounts for around 20%. The largest block of spend has actually become general and administrative solutions for IT, HR, finance, and business ops.
Blissfully ranked departments by the 2-year growth rate in the number of apps they use and found that marketing and sales were actually at the bottom.
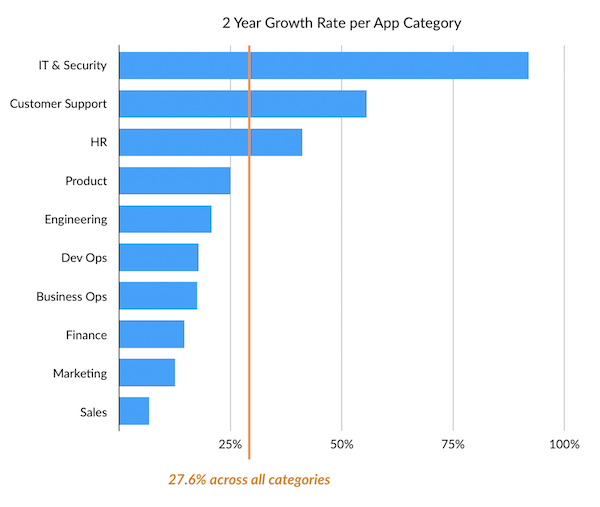
Of course, in total number of apps in use, marketing is likely at the top, as other report data has shown. It’s arguably the most “mature” category in terms of SaaS explosion.
But many of these other categories are now expanding rapidly. I’d bet that over the next few years, “landscapes” of the variety of apps in those departments will follow a similar pattern to the one I charted for marketing. Maybe not to the same scale, but directionally similar.
But what about the coronavirus and resulting economic recession? How will that change this?
That’s a question worthy of its own post. But at a high level, I doubt it will dramatically alter these trends. It may slow them down. But the underlying forces of the world becoming more digital — which in some ways this pandemic is actually accelerating — and software becoming easier, faster, and cheaper to create still remain.
Martech may indeed have its dot-com moment this year, triggered sharply by the coronavirus crisis. But I think its long-term prospects for the decade ahead are still quite promising.
A subject for much debate ahead, I’m sure.
Meanwhile, I continue to hope the best for you, dear reader, in making it through this storm.