
Housing prices have outpaced wages consistently over the last two decades, making homeownership increasingly difficult in many places across the United States. An Associated Press analysis found that in half of the metro areas around the country, housing prices grew at least 10 percent faster than wages did from 2011 to 2018.
In three quarters of metro and micropolitan (areas with population between 10,000 and 50,000) areas, home prices are back to what they were at their peak in 2007, with home prices outpaced wage growth during the last seven years. In 10 percent of areas, the gap between income and home prices is higher now than what it was at the peak of 2007.
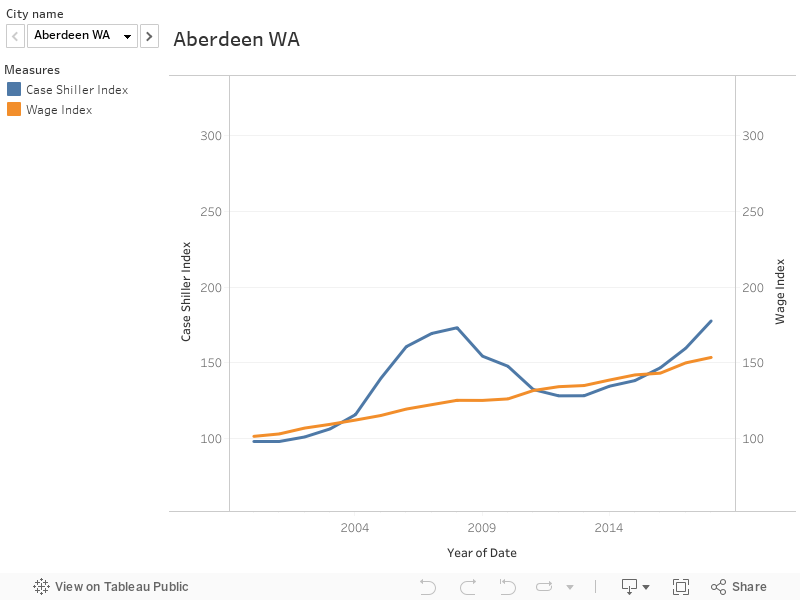
The monthly Case-Shiller Index, a widely recognized metric for house prices around the country, is a price index based on repeat sales of single-family homes. Click the major housing market areas for details, including change in average annual wages. Change in Case-Shiller Home Price Index, Dec 2018 to a year ago:
People are also reading…
The graphic below shows how housing prices compare with wages in over 400 metro areas. Choose a city from the drop down on the left to see how it compares to others in your area and nationally.
Choose a city from the drop down to see how wages and housing prices have changed over time
Update: this data was updated to include Q4 2018.
