
Just what is behind the decisions your customers make? Your sales and marketing funnels tell you the path you would like your customers to follow, but what path are they actually taking? Or, often more insightful, when and where are they dropping off?
Anecdotal evidence is just that: anecdotal. A company that genuinely wants to know why conversion is underperforming should start by mapping the customer journey. You must understand which features are used and which aren’t, which campaigns are working and which aren’t.
Doing that isn’t always simple. And it’s only going to get more difficult. And more important.
Customer journeys have become more complex across multiple devices and platforms, and yet customers expect personalization. Looming is the loss of third-party data, making your own collection of customer and product analytics data that much more imperative.
It has never been more critical for companies to understand the what, why and how behind their user data. Mapping your customer journey can fill in that picture at a time when such insights are so difficult to ascertain.
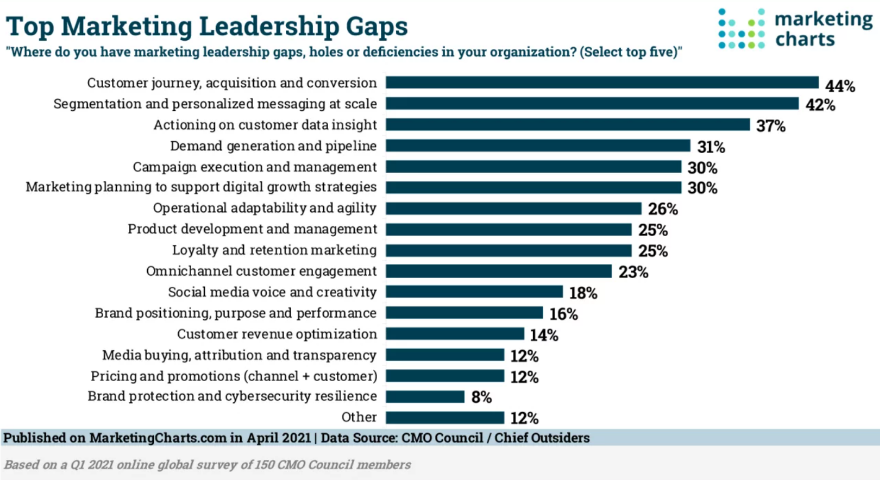
44% of CMOs identify customer journeys as a top gap
Mapping your customer journey creates a visual path to see how visitors move through your app, website or campaign and interact with your brand. The process helps you see your brand from your customers’ perspectives. Where do they drop off? Where do they move forward? What features do they interact with? What touchpoint along the path immediately preceded their choice to subscribe or make a purchase?
Product analytics is essential to pinpointing the problematic touchpoints that reveal where the customer experience needs improvements.
Let’s say you’ve identified that a specific feature in your app or section of your website is underutilized. You hypothesize that it’s not a question of value but one of access. Perhaps there’s a design or UX issue that’s interrupting your users from finding this relevant functionality? Something as simple as an A/B test can refute or confirm your theory, taking the guesswork out of it.
This kind of information is as useful for marketing and customer experience teams as it is for product teams, whose ultimate goal is to build better features and a better roadmap. Product analytics allows everyone to have a finger on the pulse of who is using the product and how — insights all teams can leverage in the pursuit of better user ratings, conversions and revenue.
“A smooth customer journey comes from leveraging new technology like AI, automation and big data,” Forbes noted in August. “Data has the power to provide more insights and personalization for customers than ever before, and AI and automation open doors for new ways to connect with customers.”
A typical business intelligence tool is insufficient. It may tell you how many users convert to paid, but it won’t tell you why, and it won’t tell you about the users who didn’t. You need to go deeper than dashboards to better understand the how and the why.
Mapping the customer journey shows how users engage with features and what happened before and after. Which features do different customer segments engage with? What behaviors do they exhibit? What touchpoint do they make? Where does friction exist?
The key is to look at the customer journey along its entire continuum. It’s not a marketing journey followed by a product journey. It’s a single path from first touchpoint with the brand’s message all the way through product usage and, ultimately, disengagement (hopefully after many years of loyal use).
Pinpoint the meaningful events along the journey
The process is far more dynamic than just following your customer down the sales funnel. Your product and marketing teams can’t depend on a sole factor, such as the overall conversion rate. A sophisticated analytics platform reveals much more:
- Discover the paths users most often follow before conversion.
- Analyze the top paths users follow after a specific event.
- Create user segments and funnels based on what you find.
- Answer questions about what users do after they create an account or upgrade.
- Improve the customer experience by understanding the paths users most frequently take.
- Uncover the paths customers take before they cancel, drop off and churn.
- Spot red flags to avoid churn before it happens.
The right kind of mapping software allows you to look at the customer journey differently, not just by observing groups of users interacting with your application but by pinpointing the meaningful events along the path. This insight enables marketing or product teams to challenge anecdotal evidence or long-held assumptions about customer behavior because it removes the guesswork behind trying to understand what customers do after they log in, sign up or use certain features. The map also provides an empirical approach to A/B testing.
Knowing what is driving engagement can be elusive for marketing managers, and an increasingly complex landscape of multiple integrated platforms, third-party data issues and the yin and yang of traditional versus digital marketing efforts only compounds the challenges. Marketers need the ability at their fingertips to access and visualize the right data. Companies that are too reliant on dashboards, anecdotal evidence and assumptions put their marketing efforts at a disadvantage.
About the Author: Jeremy Levy is CEO and co-founder of Indicative, the only product analytics platform for product managers, marketers and data analysts that connects directly to the data warehouse. He is a serial entrepreneur and a veteran of New York City’s Silicon Alley.