
Azure Monitor Logs (formerly Log Analytics) is a fundamental feature of Azure Monitor Service. It is a set of tools allowing :
By design, Azure resources can send automatic logs to a linked Log Analytics workspace. Note that each resource sends appropriate data (so different kinds of data) to the workspace.
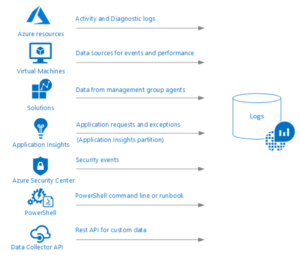
Unlike the Metrics, Logs can store different data types (dates, strings…) and are organised as records. It’s worth to say the Logs base can also be filled with custom logs (for instance by using the Log Analytics APIs as shown on the previous picture), and it’s exactly the purpose of this post: How to send custom log analytics data through Azure Logic Apps.
First of all, you need to have a dedicated Log Analytics workspace. If you don’t have one, you can create a new resource of Log Analytics workspace type using the Azure portal.
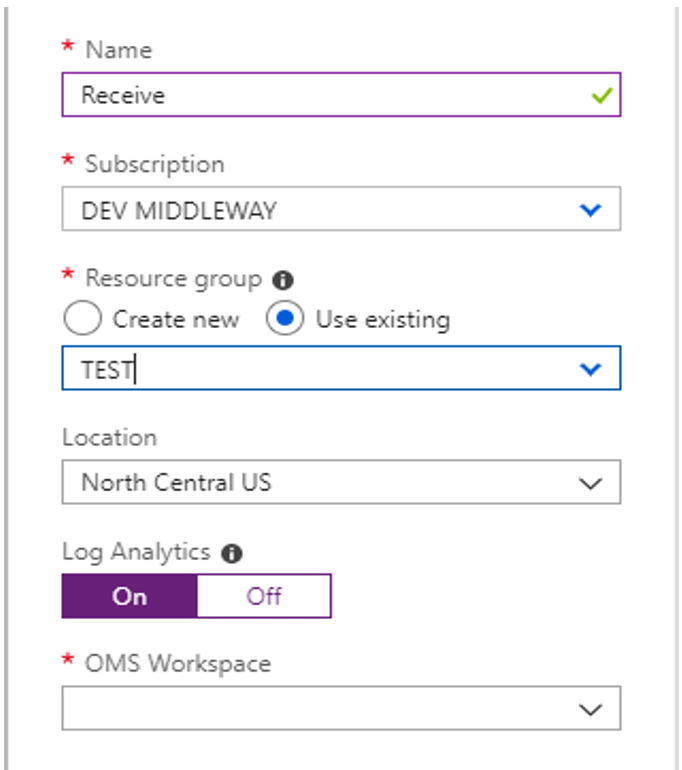
Just fill the form with:
That’s it, you can now send logs to Azure Monitor Logs.
In order to send logs, your Logic App needs to be linked with the workspace. You can link it on the Logic App creation step as shown on the following picture.
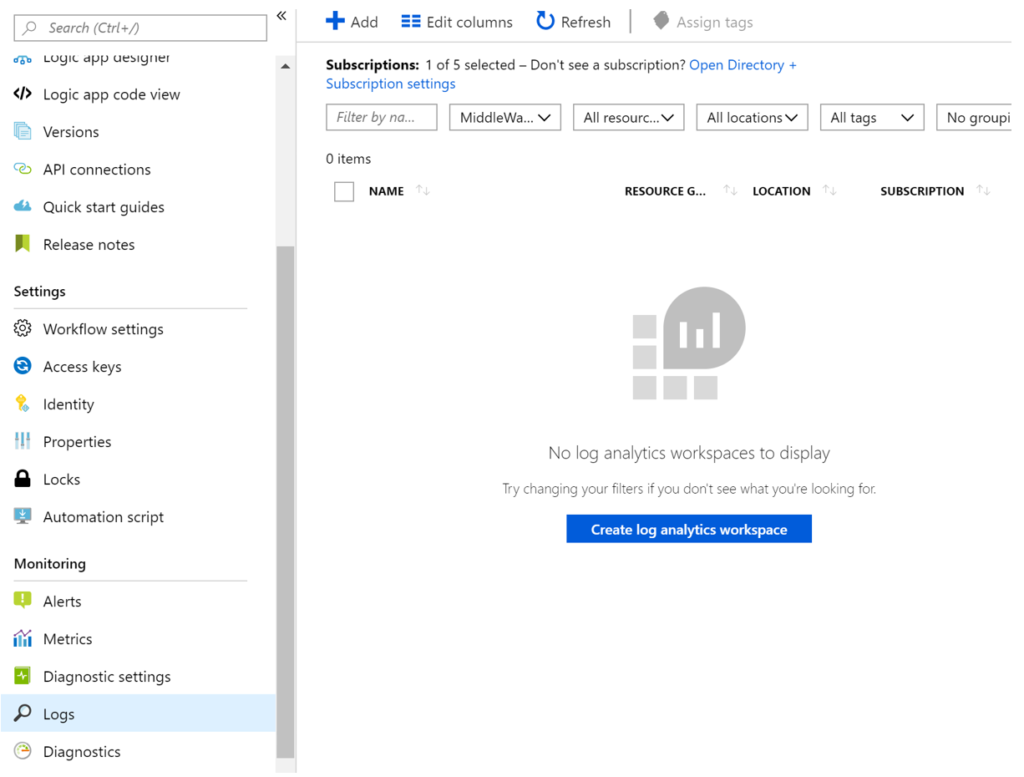
The link between the workspace and the Logic Apps activates automatic logs:
All of these are technical logs. However, sometimes you need to trace other business data. For instance, you might want to log an « order number » from incoming orders to build business dashboards or improve the monitoring of your logic app runs.
From any Logic App action, you can configure tracked properties which will be sent to the Log database. Just use the « Settings » command behind the ellipsis on the top right corner of the related action.
In the following screenshot, we just track 2 data entries. One of these is the subject of an outgoing Email.
![]()
In order to request the log database, you need to use the Kusto language (https://docs.microsoft.com/fr-fr/azure/kusto/query/). It’s a relatively easy to understand query language and it’s close to SQL syntax.
In the following example, the query gets all the logs related to the subject “log”.
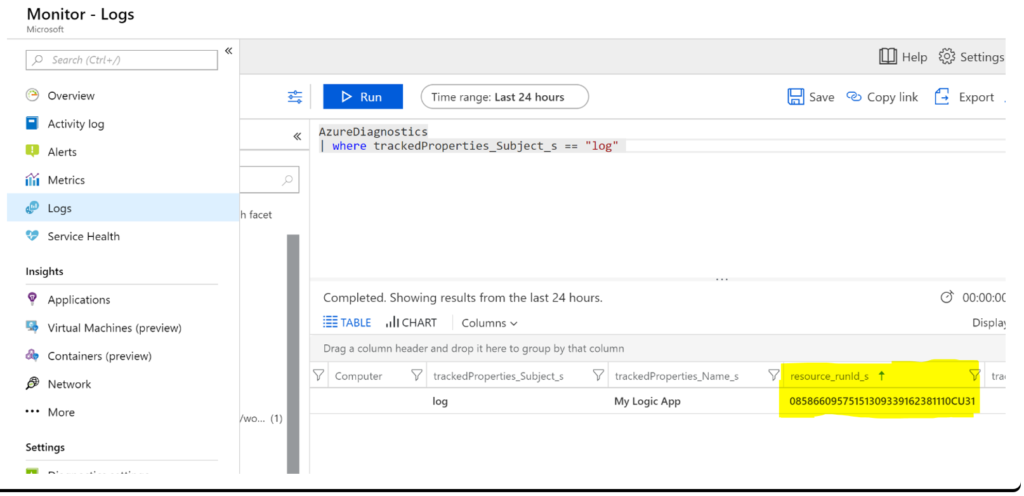
Before processing, keep in mind that: