IT’S A DISCLAIMER FAMILIAR TO ANY INVESTOR, but it’s perhaps truer now than ever: Past performance is no guarantee of future success. Technological changes have accelerated the rate of competition: New challengers are rising faster than ever, and incumbent leaders are falling just as fast. At BCG, our research shows that for large companies, there is now less correlation than there used to be between past and future financial and competitive performance over multiple years.
The tools business leaders use, however, have not yet caught up to this reality. CEOs may pride themselves on being “forward-looking” (and the very best ones are called “visionaries”), yet the metrics commonly used to judge the state of a business (for example, profitability, revenue growth, and stock performance) are inherently retrospective. In other words, CEOs are looking into the proverbial rearview mirror when they really need binoculars.
That’s why last year BCG and Fortune created the Future 50. Our index is forward-looking, in the sense that it aims to measure vitality—a company’s capacity to reinvent its business and sustain revenue growth. Over long periods, the majority of shareholder returns of high performers are driven by such growth. However, consistently delivering growth is especially challenging for larger companies, which can no longer rely on startup-like momentum to sustain their performance. Our goal is to create a new tool for managers to measure and shape growth potential.
Signs of future strength
The Future 50 are the exceptions—the established public companies with the best long-term growth outlook. Our index is based on two pillars: a “top-down” market view of growth potential, and a “bottom up” assessment of a firm’s capacity to deliver growth.
To assess capacity, we focused on four dimensions: strategy, technology and investments, people, and structure. We identified dozens of theories that predict long-term performance, based on research and academic study. Then we tested them, leveraging a wide range of financial and non-financial data. In the non-financial realm, we used natural language processing algorithms to parse companies’ annual reports and SEC filings, searching for indicators of a firm’s strategic thinking on dimensions such as long-term focus; a broader sense of purpose beyond financial returns; and “biological thinking”—for example, embracing complexity and being adaptive. Finally, we used a machine-learning model to test the predictive power of these factors, retaining only those with a demonstrated impact on long-term growth.
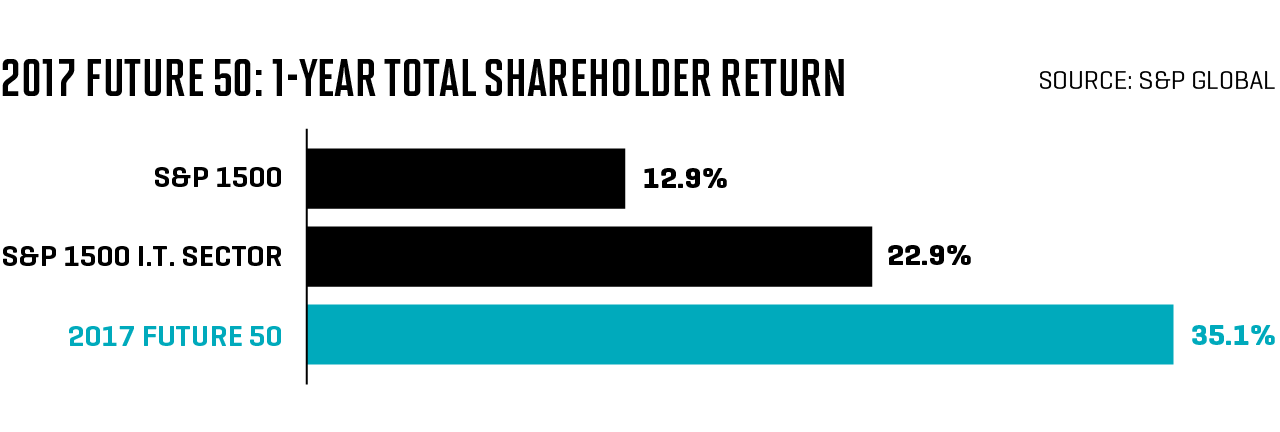
Vitality operates over long periods and may not be reflected in short-term performance. That said, early results are encouraging: Since their selection last October, the 2017 Future 50 have achieved average revenue growth of 18% and total shareholder returns of 35%—outperforming both the overall market and growth-focused stock indexes.
Global patterns of vitality
Our 2017 ranking assessed only U.S. companies. This year we expanded our scope to include the largest public companies worldwide. We found a bipolar landscape. The vast majority of this year’s Future 50 are headquartered in two countries: 42% each in Greater China (including Hong Kong) and the U.S.
This distribution may seem extreme, but it is in line with growth trends. Of the fastest-growing large companies over the five years through 2017, 54% were based in China, and 28% in the U.S. Growth-focused investment follows a similar pattern: In the first half of 2018, approximately 80% of venture capital funding went to those two countries, according to Crunchbase.
Vitality is also unevenly distributed by sector. In the U.S. and other developed markets, the vast majority of vital companies are tech players. But in China and other emerging markets, the picture is more varied, thanks in part to rising consumer demand from the growing middle class. While digital leaders such as Alibaba, Baidu, and Tencent rise to the top, there are also three Chinese automakers among our top 50, along with a consumer-oriented Indian bank and a Thai convenience-store operator.
With high potential, high risk
The very attributes that make high growth possible often also increase risk. One cautionary example: While last year’s Future 50 companies are outperforming in the aggregate, three—LendingClub, Gogo, and Macom Technology Solutions—have lost half their market value since publication.
Many high-growth companies are led by founder-CEOs, who face the challenge of preserving culture and momentum while transitioning in the leadership role. Tech giants face trust issues, as users become increasingly sensitive to the social and political implications of digital products and increasing market power. And macro concerns, such as trade disputes, fears of a slowdown, and the impact of government influence on the economy, are more salient than ever. (Such concerns have impacted the share prices of many companies on this year’s list, especially in China.)
To calibrate these risks, we have stratified our ranking. We classified four companies—Samsung Biologics, Tesla, Facebook, and JD.com—in a “higher uncertainty zone”: Though they score well in our vitality analysis, each faces circumstances that elevate the risk that their growth could derail.
The Future 50 can’t predict success with certainty, of course. Evolving markets, new competitors, and external forces always have the potential to disrupt trajectories. But we believe this index provides a useful set of binoculars through which to recognize growth potential in volatile times.
METHODOLOGY
To identify the Future 50, BCG examined 1,100 publicly traded companies with at least $20 billion in market value or $10 billion in revenue in the 12 months through the end of 2017. A company’s final score represents its outperformance across the following metrics when compared with peers of a similar size.
50% of a company’s score is based on market potential—defined as its expected future growth as determined by financial markets. This is assessed by calculating the present value of its growth opportunities, which represents the proportion of its market value that is not attributable to the earnings stream from its existing business model.
The other 50% is based on a company’s capacity to deliver against this potential. This score comprises 17 factors, selected for their ability to predict growth over the following five years. These factors fall into four categories:
Strategy: Our A.I. algorithm Our A.I. algorithm uses a Long Short-Term Memory neural network (a natural language processing model that incorporates word order and context) to detect strategic orientation from SEC filings and annual reports. It assesses a company’s long-term focus, commitment to a purpose beyond financial returns, and “biological thinking” (emphasizing for example adaptation, collaboration and ecosystems). We also assess the clarity of a company’s strategy from earnings calls. Finally, we assess the company’s commitment to sustainability from its governance rating from Arabesque, a firm that specializes in ESG data and analytics.
Technology and Investments: A company’s capital expenditures and R&D (as a percentage of sales) measure its investment in the future. Technology advantage is assessed through the growth in a company’s patent portfolio and that portfolio’s digital intensity (share in computing and electronic communication). To account for external innovation, a company’s portfolio of startup investments is compared with the best-performing global venture capital funds.
People: We assess the age of a company’s executives and directors, as well as the share of managers and employees who are female. The value of consistent, focused management is assessed via leadership stability and smaller board size.
Structure: A company’s age and (revenue-based) size are correlated with vitality loss. But three-year and six-month sales growth can be predictive of future growth as signs of revitalization.
A company’s final score represents its outperformance across these factors compared to peers of a similar size (above or below $50 billion in market value), accounting for fact that growth-focused analysis inherently favors smaller companies. Companies in energy, metals, and commodity chemicals sectors were excluded because their growth is highly dependent on exogenous commodity prices. Finally, among companies with a high vitality score, “higher-uncertainty” companies were identified from reported events that commentators believe could materially affect their long-term growth outlook.
Company profiles:
HEAD WRITERS Eamon Barrett, Matt Heimer
CONTRIBUTORS Scott DeCarlo, Ryan Derousseau, Grace Donnelly, Erika Fry, Robert Hackett, Adam Lashinsky, Sy Mukherjee, and Jonathan Vanian
Martin Reeves is a senior partner at management consulting firm BCG and the director of the BCG Henderson Institute.
A version of this article appears in the November 1, 2018 issue of Fortune with the headline “A Global Hunt for the Next Decade’s Champions.”


