

Founders Dr. Giovanni Tummarello (CPO) and Dr. Renaud Delbru (CTO) provide a deep dive into what is new in Siren 10.
The Siren platform is built to address some of the world’s most important data driven problems in industries such as life sciences, financial services, cybersecurity, telecommunications, intelligence and law enforcement. In all sectors investigative intelligence is what is required to gain actionable insights out of disjointed data sets to propel organizations into a sustainable and cost-efficient investigative process.
The release of Siren version 10 represents a radical step forward.
While previous versions of Siren – also known as Kibi – required the data to be loaded into a Siren augmented Elasticsearch cluster (a cluster capable of big data cross index joins thanks to the Siren Federate plugin), Siren 10 adds direct connectivity to JDBC to relational databases (Oracle, SQL Server, Postgres, MySQL and more) and JDBC/SQL middleware such as Impala, SparkSQL, Presto, Dremio.
The result is that Siren 10 relationally interconnected dashboards and knowledge graph browser give the analyst the ability to investigate at big data scale seeing the connections across records no matter in which backend they’re stored in.
Get more insights and watch an extensive Siren 10 demo in our Siren 10 on demand launch webinar, hosted by Siren’s co-founders Dr. Giovanni Tummarello (CPO) and Dr. Renaud Delbru (CTO).

What to expect in the Webinar?
Siren’s “set to set” navigation: showing connections between your records across indexes, back ends and dashboards
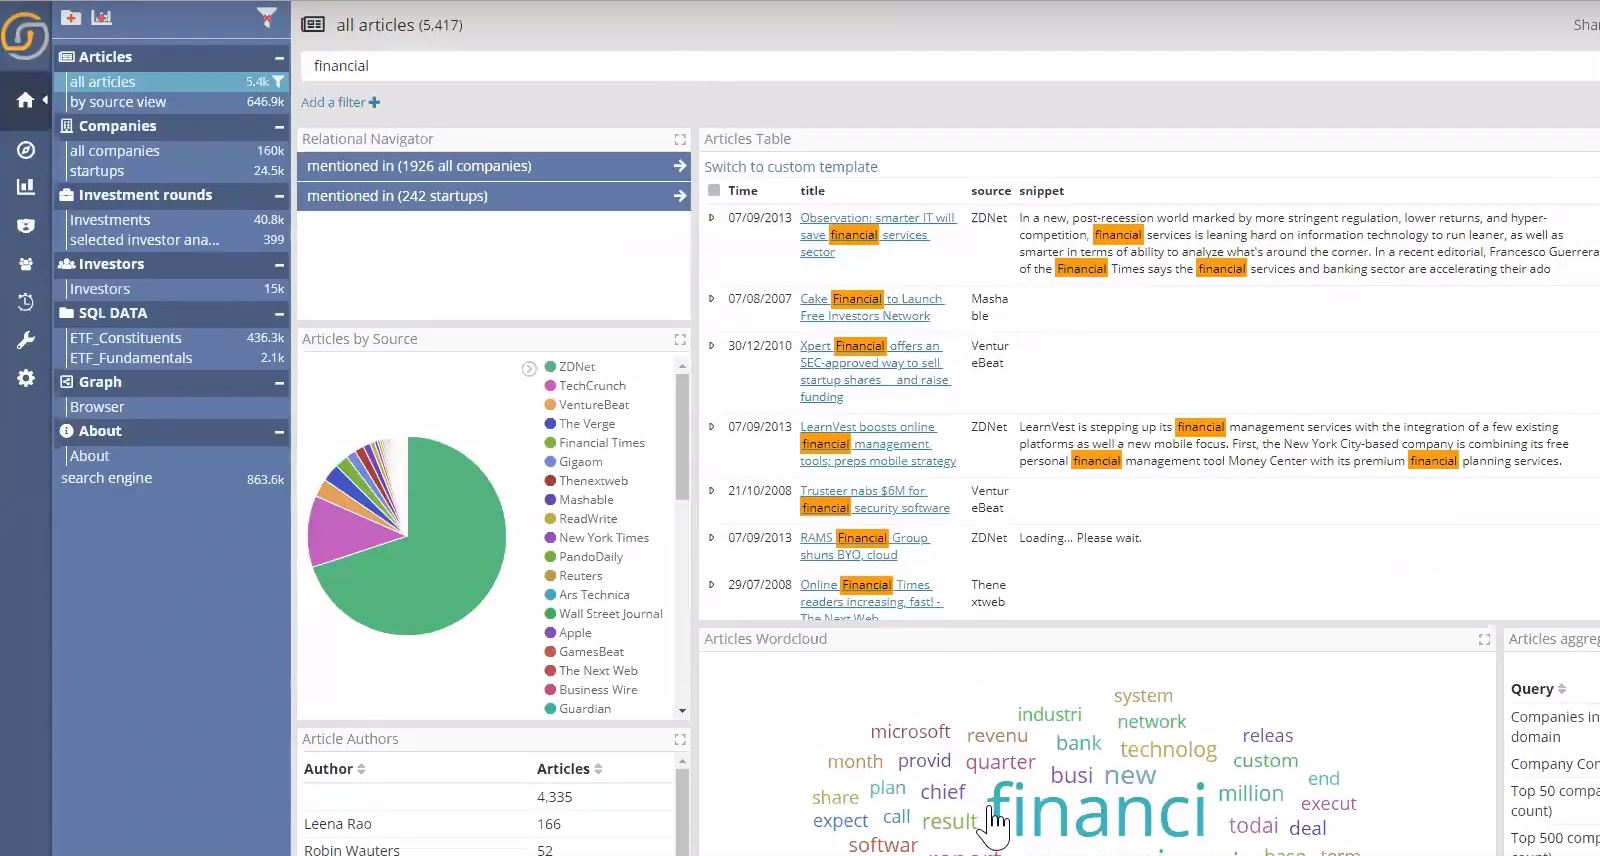
Siren allows the user to drill down based on properties from the other tables in a paradigm called “Set to Set” navigation.
It’s a unique capability which allows the investigator and/or analyst to get answers to very complex questions in which relations among records are key.
For example, if you type “financial” in the search bar while in the articles tab, the user interface will display the number of entities in other data sets that match the criteria set. The user can then navigate from the set of articles mentioning the word “financial” to the set of the companies connected to those articles.
Analyze data where it is with big data join push-downs (… no ETL to Elasticsearch needed)
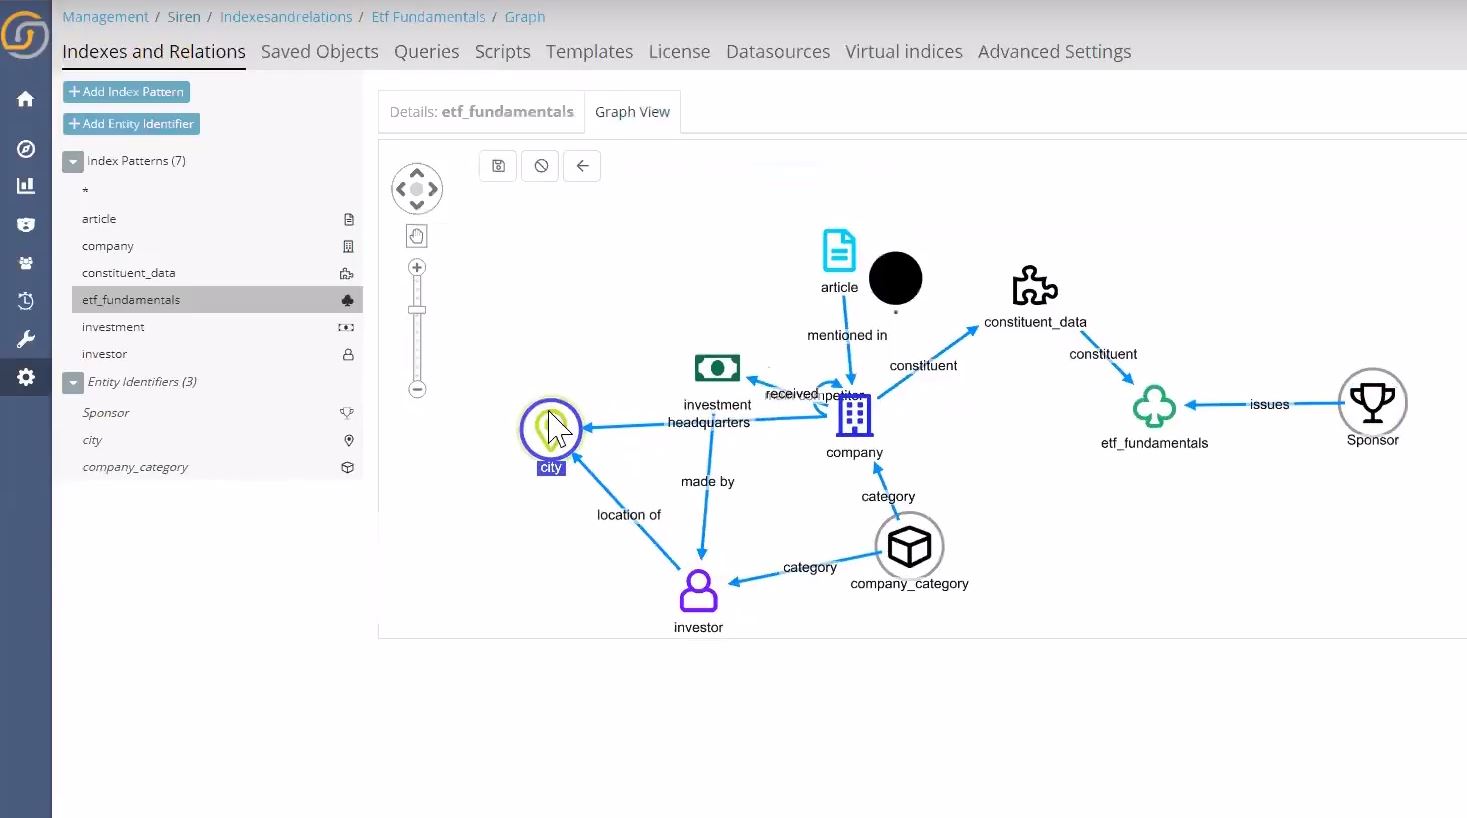
Siren’s proprietary federation technology allows the user to create virtual indexes, which effectively means being able to connect to data not held natively within Elasticsearch (such as an SQL data set held on Microsoft SQL Server or Oracle). When virtual indexes are on the same back end, joins are pushed down as native SQL statements leveraging the power of your existing infrastructure.
At the heart of this functionality resides the Siren semantic federation model. Which governs how the data is meant to be joined and provides coherent views and navigation. (for more in detail on how this works, see our Welcome Siren 10 post)
Relational dashboards, lists and tables are great; but are just not enough. Siren 10’s improved link analysis
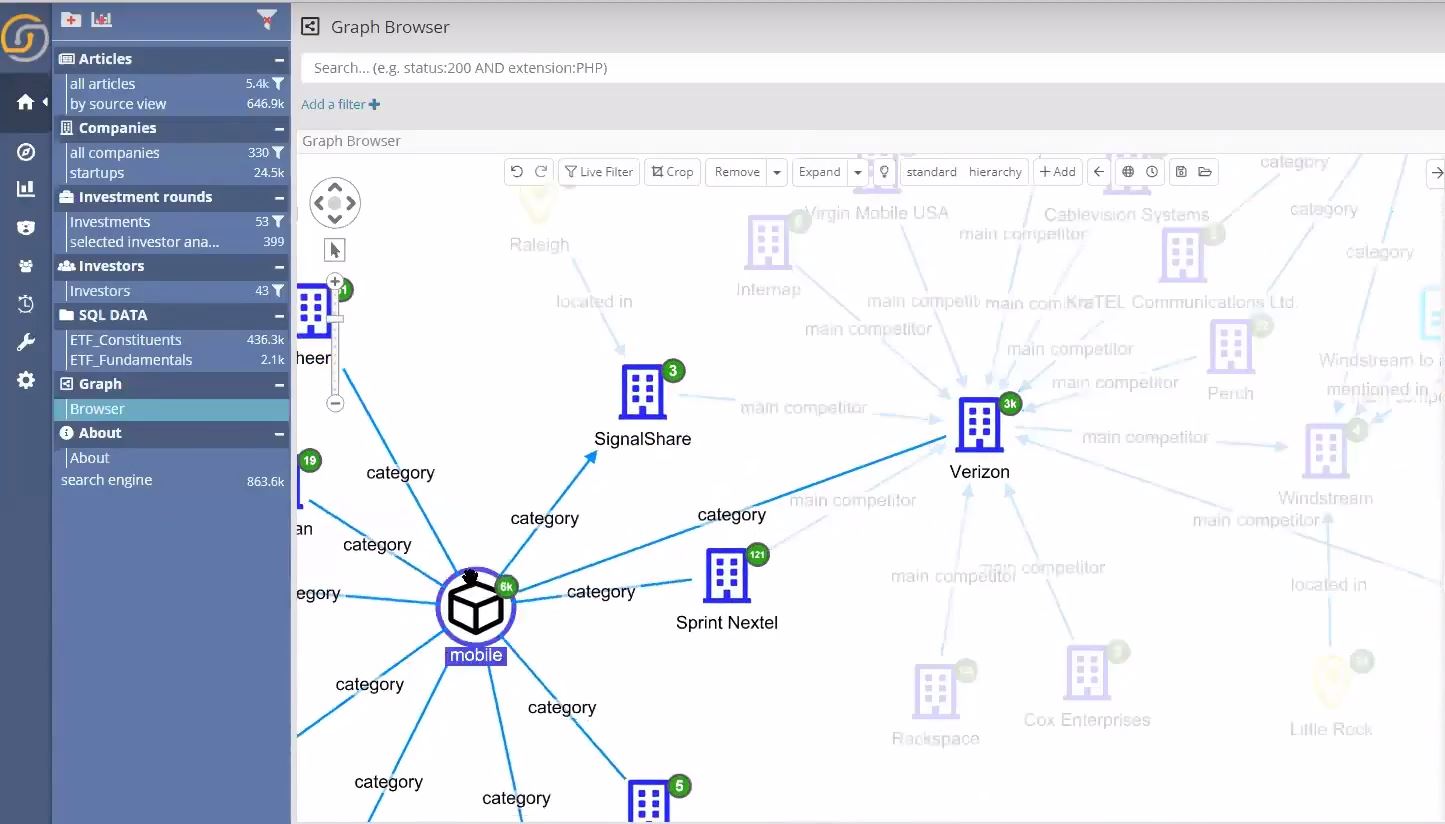
As valuable lists and table are, sometimes they are just not enough, at this point link analysis becomes absolutely critical. Siren Investigate is enriched with the graph browser functionality, which allows the users to see their data sets neatly and intuitively displayed in a graph, making the interconnections clearly visible thus unearthing the relationships amongst the data.
An interesting feature is that entities on the graph do not necessarily have to be a representation of entities in an index, they can be values, something as simple as a social security number, a phone number, IP address or other. These elements are nothing more than field values in certain indexes.
Manipulate data in real-time, highlighting and differentiating elements with Siren 10’s graph lenses
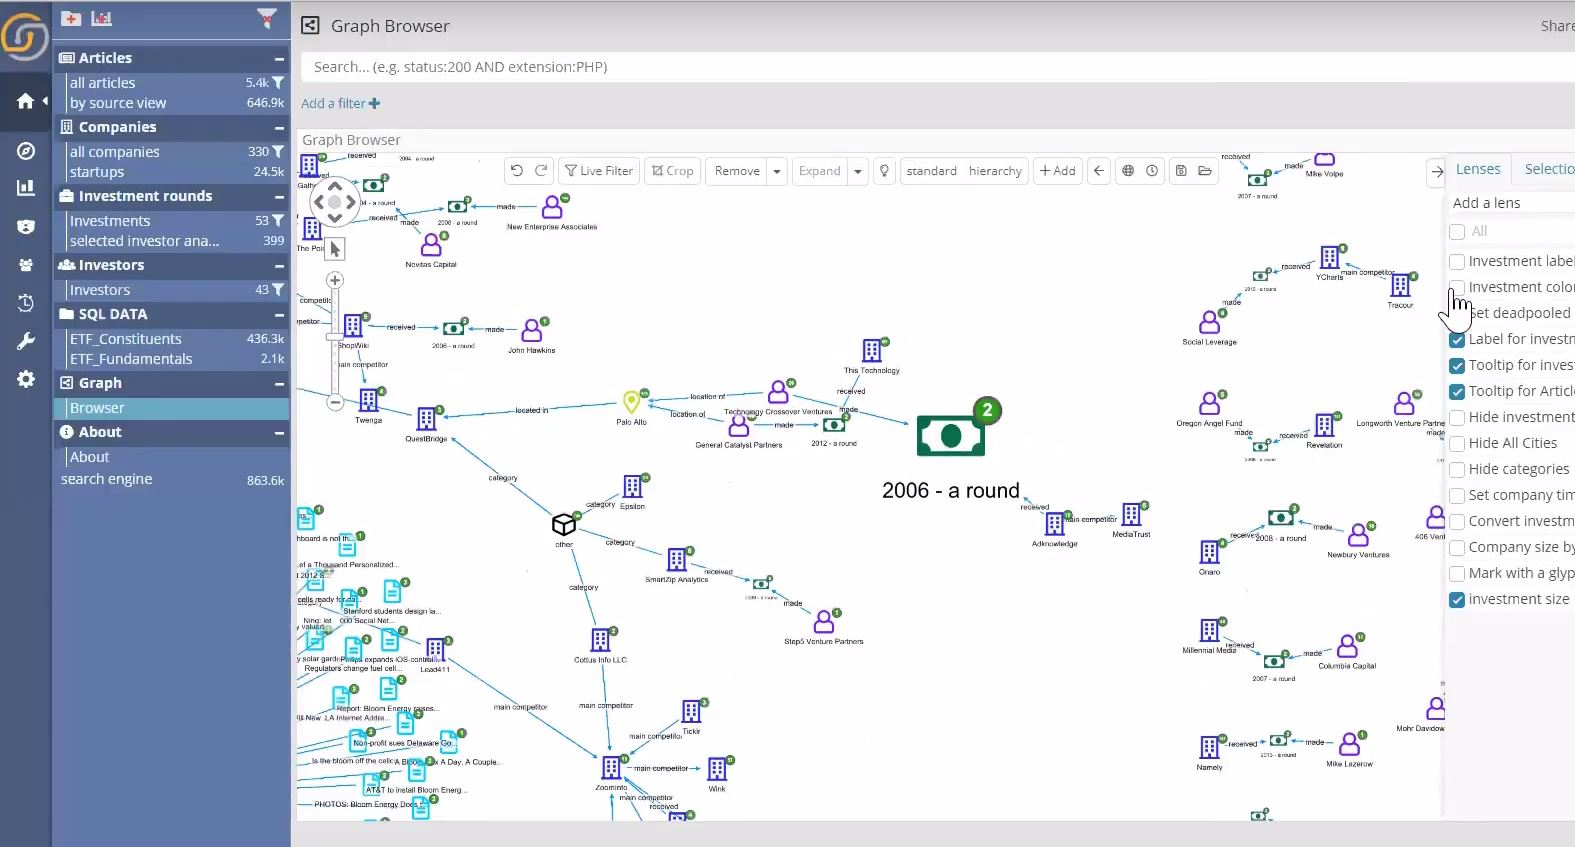
In Siren 10’s graph browser a powerful new way the user can manipulate data sets and create tooltips for objects is by using the lenses feature. This element of the interface is configurable and scriptable by the user, who can hide or highlight elements, according to his or her needs, making it easier to investigate data.
For example, you can ask the system which are the biggest investments that investors made, you can set different parameters and colors. This will make the biggest investment (that match your criteria) pop up in the graph, with the corresponding icon being colored per user’s parameters.
To get a deep dive into this element of the Graph Browser read our second article of Siren 10 platform release.
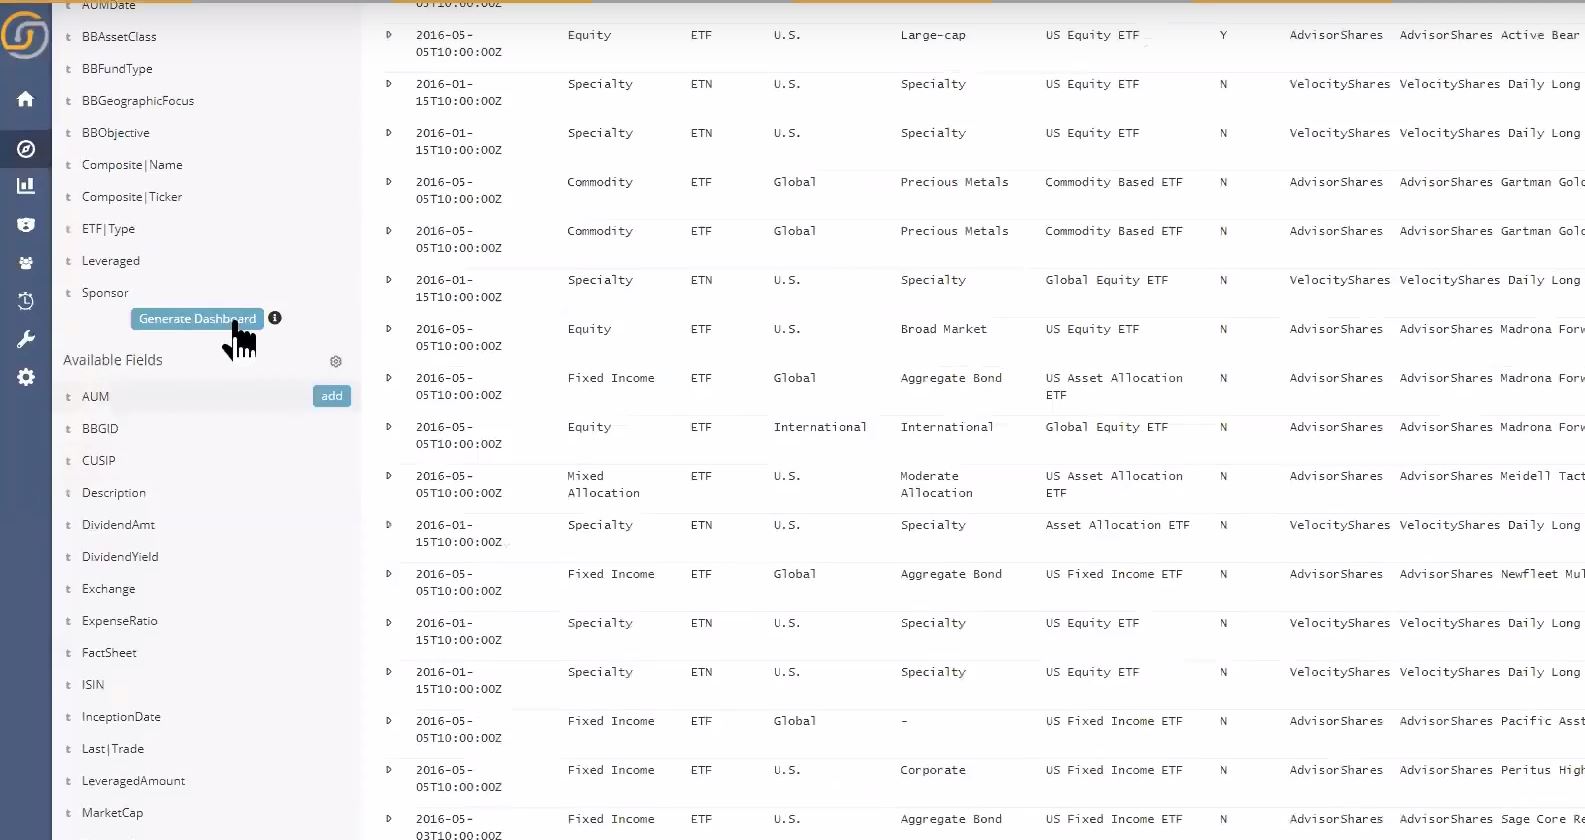
Siren 10’s auto-dashboard creation: instant insight from a newly connected data source.
Siren 10 has the ability to connect to new data sets on the fly and immediately provide insights on it. Once the index is created as an entity, a dashboard is needed to enable content discovery and data analysis. Siren 10 includes a mechanism that allows to auto-create dashboards – the platform will automatically propose fields which the user may select, and once created, the remote table is ready to be analyzed and joined across with other databases already mapped.
Welcome ultra scalable joins withing Elasticsearch – Siren 10’s fully distributed join technology available as an ES Plugin
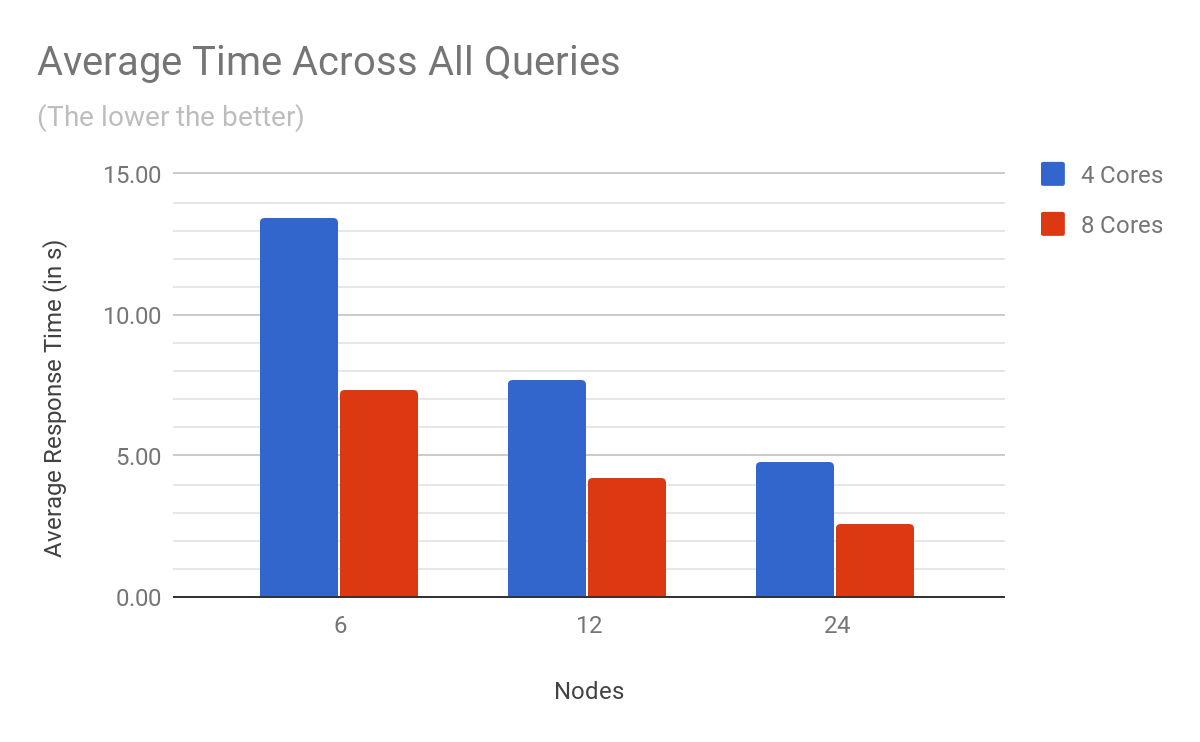
For scenarios in which your data is in Elasticsearch, (big data operational logging or cyber for example) Siren 10 makes use of the fully distributed in cluster join capabilities of the Siren Federate plugin for Elasticsearch.
Siren’s CTO, Renaud Delbru, goes through a general description of this technology and showcases our initial release benchmark of Siren Federate in the on-demand webinar.
To read more about the Siren Federate Engine you can take a look at this blog post.
Also published on Medium.


