Place-based approaches for reducing health inequalities: main report
Updated 28 September 2021

© Crown copyright 2021
This publication is licensed under the terms of the Open Government Licence v3.0 except where otherwise stated. To view this licence, visit nationalarchives.gov.uk/doc/open-government-licence/version/3 or write to the Information Policy Team, The National Archives, Kew, London TW9 4DU, or email: psi@nationalarchives.gov.uk.
Where we have identified any third party copyright information you will need to obtain permission from the copyright holders concerned.
This publication is available at https://www.gov.uk/government/publications/health-inequalities-place-based-approaches-to-reduce-inequalities/place-based-approaches-for-reducing-health-inequalities-main-report
Context and causes of health inequalities
The main points made in this section are:
- the gap in life expectancy in England is growing, with females in the most deprived parts of the country experiencing a decline in life expectancy
- health is not just about the length of life we live, but also the quality of life – the gap in healthy life expectancy (years lived in good health) between the most and least deprived areas of England was around 19 years for both males and females from 2014 to 2016 [footnote 1]
- the extra costs to the NHS of health inequalities have been estimated as £4.8 billion a year from the greater use of hospitals by people in deprived areas alone [footnote 2]
- health inequalities reduce employment and productivity - which has a cost for the national and local economies [footnote 3]
- acting on health inequalities is, therefore, an investment for England’s national and local economies - with the cost of inaction running into the billions [footnote 4] [footnote 5]
- the focus on narrowing gaps in life expectancy in the Industrial Strategy [footnote 6], DHSC’s published green paper for prevention [footnote 7], and the NHS Long Term Plan [footnote 8] all create welcome opportunities for ambitious, co-ordinated, national and local level action on health inequalities
- health inequalities are not caused by one single issue, but a complex mix of environmental and social factors which play out in a local area, or place - this means that local areas have an important role to play in reducing health inequalities
- addressing the wider determinants of health through a life course approach is important for achieving impact at the level of population health - rather than at the individual level
Definition of health inequalities
Health inequalities are unfair and avoidable differences in health across the population, and between different groups within society. Health inequalities arise because of the conditions in which we are born, grow, live, work and age.
These conditions influence our opportunities for good health, and how we think, feel and act, and this shapes our mental health, physical health and wellbeing.
Health inequalities have been documented between population groups across at least 4 dimensions, as illustrated in Figure 1 below. It is important to note that these are overlapping dimensions with people often falling into various combinations of these categories.
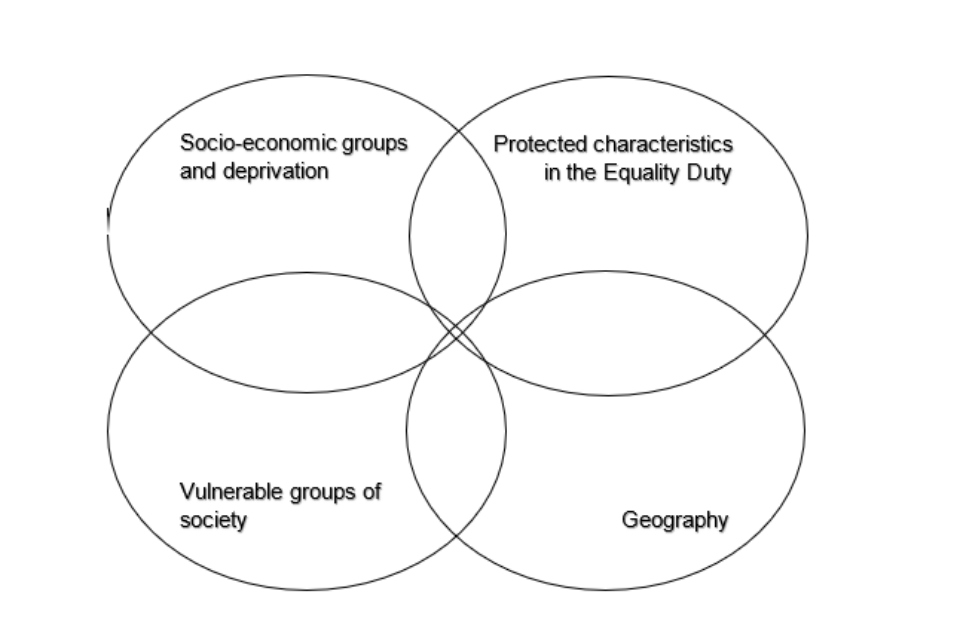
Figure 1. Groups usually considered for health inequalities.
Examples of the characteristics of people or communities in each of these groups are below (this is not an exhaustive list):
- socio-economic status and deprivation, for example, unemployed, low income or people living in deprived areas. This could include poor housing, poor education as well as unemployment
- protected characteristics - for example, age, sex, race, sexual orientation, and disability
- vulnerable groups of society, or ‘inclusion health’ groups, for example, vulnerable. migrants; Gypsy, Roma and Travellers, as well as homeless people and sex workers
- geography, for example - urban or rural areas
Action on health inequalities requires improving the lives of those with the worst health, fastest.
With this definition in mind, and to focus this work, much of the data from here on focuses particularly on differences in health between socio economic groups, and areas of varying degrees of deprivation.
Whilst it is not explicitly centred on important barriers to health facing Inclusion Health groups such as homeless people, and Gypsy, Roma and Traveller communities, or those with protected characteristics, many of the principles and recommended actions are applicable to inequalities faced by these groups of people.
The PHE Health Equity Collection [footnote 9] features a number of resources and tools that provide further practical information and resources to improve health outcomes for these populations, including published guidelines to support local and national action on ethnic inequalities in health [footnote 10].
Current trends in health inequalities
After decades of progress, since 2011 the improvement in age-standardised mortality rates and life expectancy has slowed down considerably, for both males and females.
The gap in life expectancy between the most and least deprived areas is 9.4 years for males and 7.4 years for females [footnote 11]. However, this gap has recently widened since the years 2010 to 2012, and the improvement in life expectancy has been slower in more deprived areas than less deprived areas of England [footnote 12].
In addition, female life expectancy in the most deprived decile areas has actually decreased. Therefore, the causes of the slowdown in improvement are having the greatest impact in the more deprived areas.
These trends over time are shown in Figures 2 [footnote 13] and 3 [footnote 14] below.
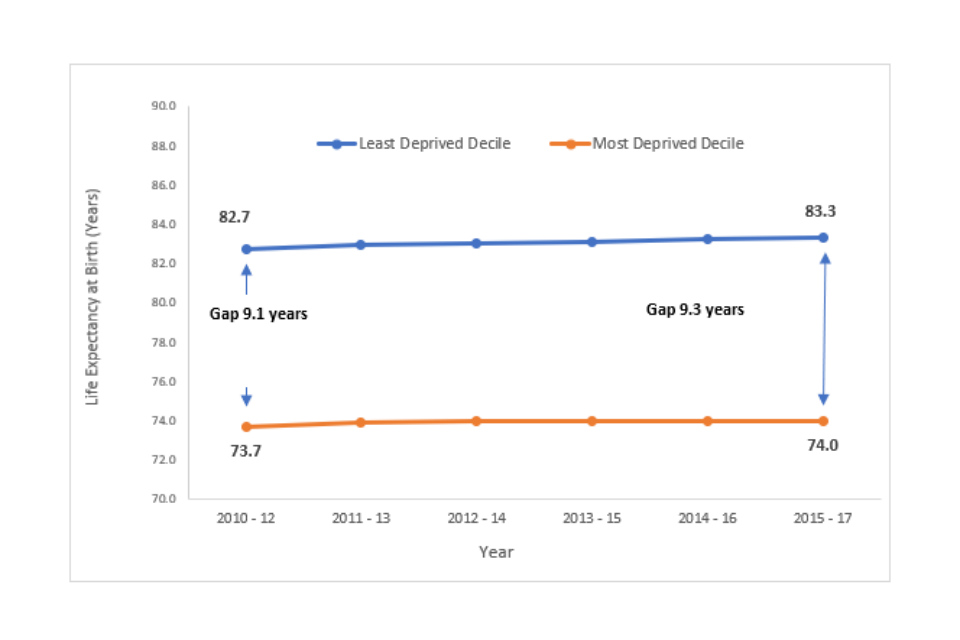
Figure 2. Male life expectancy gap between least and most deprived deciles, England, 2010 to 2012 up to 2015 to 2017.
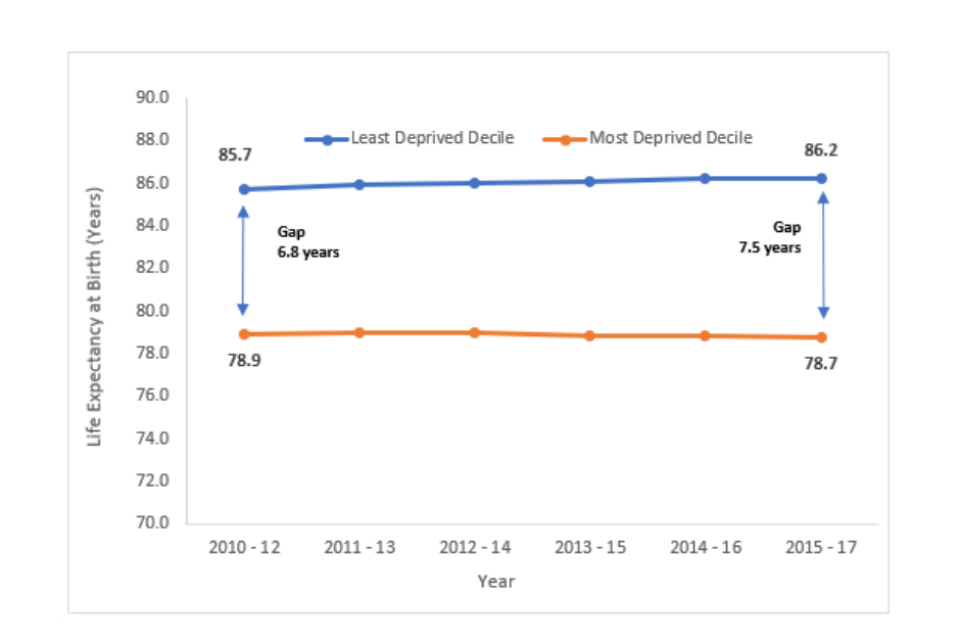
Figure 3. Female life expectancy gap between least and most deprived deciles, England, 2010 to 2012 up to 2015 to 2017.
Health is not just about the length of life we live, but also the quality of life. The gap in healthy life expectancy (years lived in good health) between the most and least deprived areas of England was around 19 years for both males and females from 2015 to 2017 [footnote 15].
Annex 1 sets out further national and local data on the current causes of health inequalities.
Economic case for acting on health inequalities
There are many reasons to come together to find solutions at a national and local level to break the cycle of entrenched health inequalities in England. As many of these inequalities are avoidable, the moral case cannot be overstated.
There are also economic reasons for action. The high burden of disease in deprived areas generates higher use of health and social care services, higher unemployment, and lower productivity.
The Marmot Review estimated that health inequalities cost society £31 billion in lost production, in 2010 prices [footnote 16]. Whilst this is a national figure, it is in local jobs and economies where this impact is borne out.
The higher burden of disease experienced by women living in the most deprived neighbourhoods costs the NHS 22% more per person than women living in the least deprived neighbourhoods, despite having shorter life expectancy (or £400 per person per year in secondary care costs).
For men, this figure is 16% per person (or an additional £300 per person per year in secondary care costs). This results in an additional spend of £4.8 billion per year, almost 20% of the total hospital budget [footnote 17], without taking into account additional costs, including social care provision.
National context for health inequalities
The case for acting on health inequalities is recognised in recent announcements from across government, and in the NHS’s Long Term Plan. This context provides substantial opportunity to take meaningful, joined-up action on health inequalities.
This includes actions such as:
-
The Industrial Strategy [footnote 18], which sets out a Grand Challenge to increase Disability Free Life Expectancy by at least 5 years by 2035, while reducing the gap between the richest and poorest.
-
The government’s prevention green paper was published on 22 July. The green paper signals a new approach for the health and care system where it focuses on improving and maintaining good health through prevention, prediction of disease and early personalised interventions.
These national statements of intent provide an opportunity to harness the collective efforts of society. However, to bring about sustainable change they must be followed through with effective action at a national and local level.
Public Health England, Local Government Association, and Association of Directors of Public Health are all committed to supporting the development and delivery of cross-sector action to address health inequalities at both a national and local level.
- The NHS Long Term Plan (LTP) [footnote 19], which takes a concerted and systematic approach to reducing health inequalities.
Some of the commitments in the NHS Long Term Plan relating to inequalities include:
- basing 5-year funding allocations to local areas, using a more accurate assessment of health inequalities and unmet need
- setting out specific, measurable goals for narrowing inequalities, including those relating to poverty
- development of detailed and measurable plans for how every local area in England will contribute to narrowing the health inequalities gap over the next 5 to 10 years
This PBA has been designed to support local areas with the development of these plans by identifying what strategic, and system-wide action, has previously worked to reduce health inequalities at a population level.
Consequently, this work has been referenced in the NHS LTP Implementation Framework as a resource that systems can draw on to develop their plans.
PHE has also worked with NHS England, alongside the voluntary and community sector and local government, to produce a menu of evidence-based interventions that sets out specific interventions local areas can invest in to reduce health inequalities.
This work, and the menu of evidence-based interventions are thus complimentary pieces of work to support the system to take strategic and evidence-based action on inequalities.
Causes of health inequalities and why Place matters
To effectively reduce health inequalities, it is important to start with a clear conceptual framework which analyses the causes, and opportunities for action. There are many models, all with different merits for use in different purposes.
One adapted from the Labonte models [footnote 20] [footnote 21] provides a simple but effective structure, as shown in Figure 4.
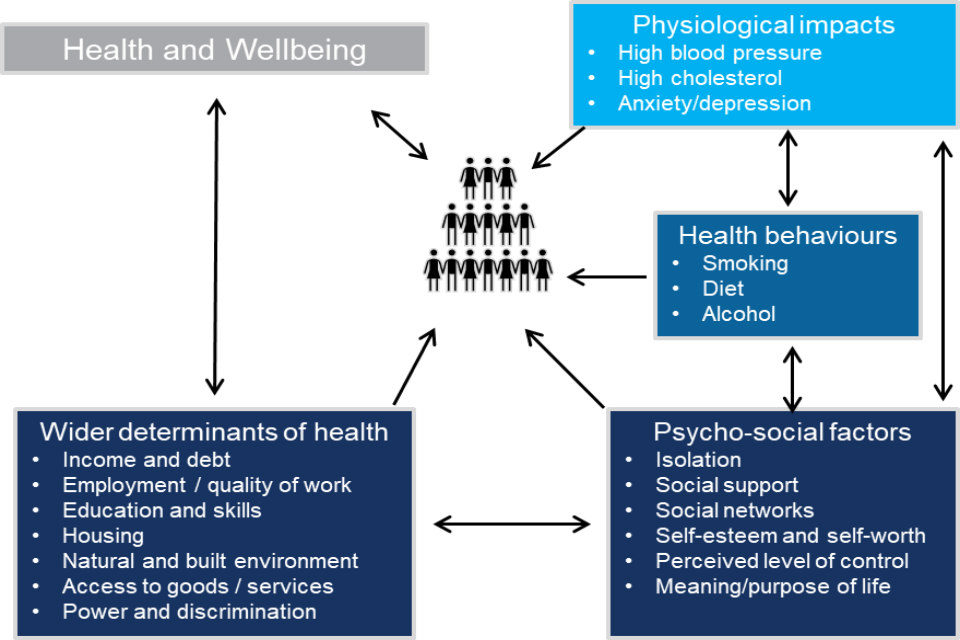
Figure 4. System map of the causes of health inequalities.
This model is a simplification of the complex system that causes inequalities to thrive. It encapsulates the different factors that impact our health, where they stem from (the wider determinants of health), how they interact, multiply, reinforce and act both in sequence and simultaneously.
The adapted Labonte model highlights why interventions must focus on treating place and not just people. This is because acting on only one factor is likely to provide a partial and incomplete response to the situation.
A summary of the important lessons from this logic model to inform action is provided below.
Important lessons from the Labonte model are that:
-
health inequalities stem from variations in the wider determinants of health and the presence of, or access, to psycho-social mediating and protective factors – this means that people do not have the same opportunities to be healthy
-
given the range of causes, a joined-up, place-based approach is necessary to tackle the complex causal pathway of health inequalities
-
interventions that solely rely on individual behaviour change are likely to widen inequalities given the complex causal pathway impacting on capability, opportunity and motivation to change
-
while action on behaviours and conditions is a necessary part of solution to reduce health inequalities, these need to be addressed within the context of their root causes in the wider determinants of health
-
resources should be allocated proportionately to address the levels of need for specific communities or populations to achieve equitable outcomes for all
There is, therefore, a critical role for local areas to play in reducing health inequalities across the life course, by taking a joined-up place-based approach - and utilising the leadership, expertise and levers that are available to them to affect this environment.
In many places and across organisations, including local authorities, sustainability and transformation partnerships (STPs), integrated care systems (ICSs), Clinical Commissioning Groups (CCGs), this is already happening.
Part of the aim of this work is to provide a range of tools to help accelerate progress at a population level, including showcasing and sharing good practice.
Annex 2 of the PBA sets out the potential roles and actions local organisations can take to reduce health inequalities through a place-based approach.
Place-based approaches recognise the importance of addressing the wider determinants of health (the conditions into which people are born, live and work) across the life course.
It is an approach which considers critical stages, transitions and settings where large differences can be made in population health, rather than focusing on individual conditions at a single stage in life.
The Quality in Public Health: a shared responsibility [footnote 22] includes reducing health inequalities being one of the 6 principles and actions [footnote 23]. This work builds on, and is linked to, the ‘What Good Looks Like’ series that follows the ‘Quality in Public Health’ document, by providing detailed guidance on how to deliver a place-based approach to reducing health inequalities.
Population intervention triangle: a framework for action to reduce health inequalities
Main points made in this section are:
- to be effective, system leadership and planning is needed to implement action on civic, service and community interventions
- each of these elements individually have the potential to reduce inequalities at population scale
- civic interventions have the greatest reach of any intervention and therefore are an extremely powerful component of place-based action to reduce inequalities - this highlights why local authorities are a critical driving force behind place-based action
- services are able to achieve significant outcomes due to their direct impact with individuals - they must, however, be delivered with system, scale and in a sustainable way, and calibrated to deliver further and faster to the most disadvantaged communities
- it is important that all partners, including communities themselves, understand the potential of community-centred contributions to reduce health inequalities (including assets within communities, such as the skills and knowledge, social networks, local groups and community organisations, as building blocks for good health)
- particular focus on joint working across the interfaces between the civic, service and community sectors is needed to enable the whole to become more than the sum of its parts
Introduction
The context and causes of health inequalities higlights the multiple causes of health inequalities which are complex, interactive and simultaneous in their combined actions, with their roots in the wider determinants of health.
A joined-up approach that treats the ‘place’, and not just individual problems or issues, is therefore necessary if we are to measurably reduce inequalities in health and wellbeing.
Place-based approaches emerged as an important foundation of producing population level change in outcomes when the Health Inequalities National Support Team (HINST) were supporting the most deprived areas with the poorest health to narrow the national health inequalities gap.
The population intervention triangle (PIT) was developed to describe how the main components of intervention capable of producing measurable population level change relate to each other.
The PIT model described in this chapter, has been developed and upgraded to ensure it continues to be fit for purpose in the current health and public health system.
This update also provides clearer, up-to-date guidance on community-centred interventions, detailed descriptions of actions needed between each part of the triangle (“the seams”) and, most importantly, provides practical tools to implement the guidance and principles described.
The tools, all derived through experiential learning, are signposted from important points in this chapter. These tools have been designed to work as self-guided assessments or through facilitated workshops, but they are also likely to work well through local mechanisms such as Sector Led Improvement approaches.
The use of these tools will be evaluated and consequently updated over time, enabling them to continuously improve.
The model can be (and has been) used at a variety of levels.
- to support cross-organisational working at the strategic place-based level, including with population health management
- at a topic or condition level, it can (for example) support whole system approaches to main elements of health inequalities and prevention (aimed at wider determinants, behaviours or health conditions)
- by individual partners (for example primary care; voluntary, community and social enterprise (VCSE) sector) as a framework to easily see how their contributions fit on a place basis
The population intervention triangle (PIT)
PIT brings together a number of important constituent elements which together form the main elements of effective place-based working.
It was developed through practical experience working to achieve measurable population level change in health and wellbeing outcomes, including addressing health inequalities between and within local geographies.
The 7 main components are shown in Figure 5.
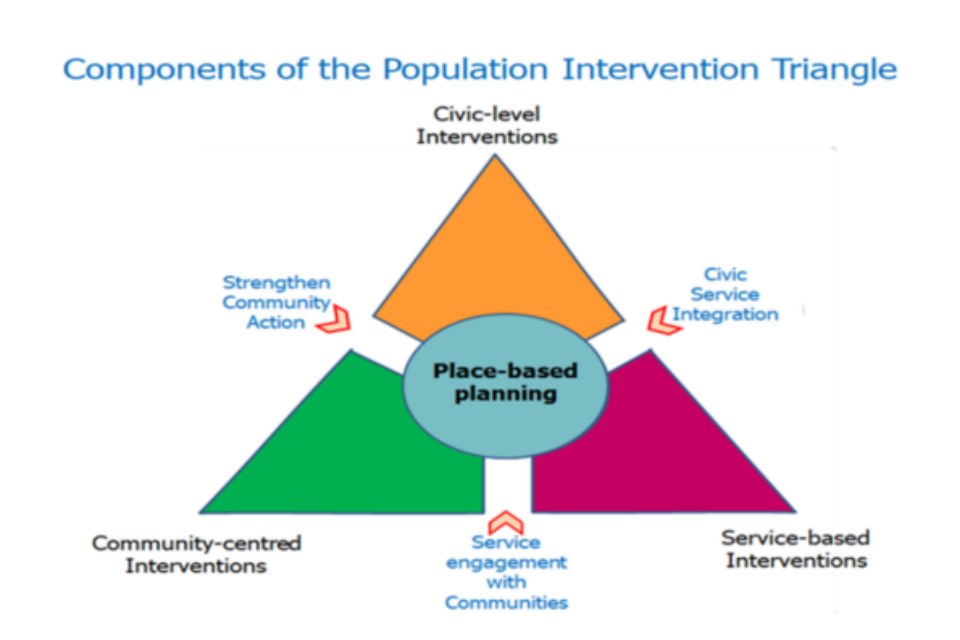
Figure 5. The Population Intervention Triangle model (PIT).
The components, described separately in the following sections, can be thought of in 3 groups:
Firstly, 3 ‘segments’:
- civic-level interventions
- community-centred interventions
- service-based interventions
Each of these categories of input - pursued with attention to system, scale and sustainability - can individually deliver percentage change at population level.
Secondly, place-based planning, which is built on:
- quality characteristics such as strong leadership
- effective partnership
- joint vision and credible strategies
- can drive measurable change bringing the impact of the individual segments together
Thirdly, effective place-based planning can also enhance impact by focussing on the 3 interfaces or ‘seams’ between the segments.
With creative working across, the whole can become greater than just the sum of the parts.
Each local area will face different causes of health inequalities, have different assets available with different solutions already in place. This model should therefore not be interpreted as a mutually exclusive list with every action required.
Instead, it is a useful map to identify potential areas to further strengthen existing action, that can be tailored to the circumstances in any place.
Section 1 to 3 segments
Civic-level interventions
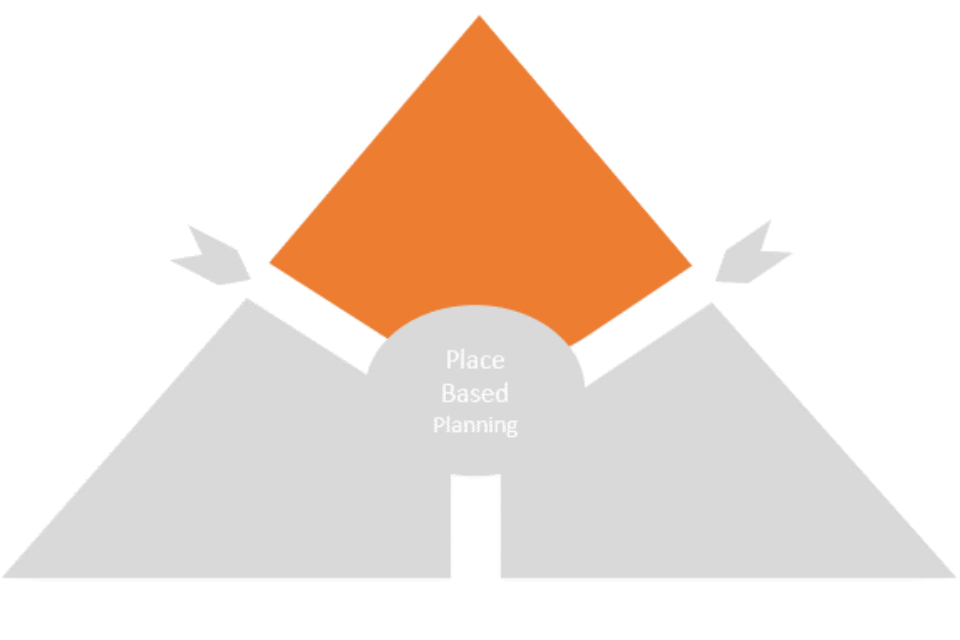
Figure 6. Civic-level interventions.
The various tiers of local authority have a wide range of civic functions (over 700), some mandated from national government and others determined by local democratic process.
This makes them critical leaders in any place-based action as they are well equipped to act on a range of drivers of health inequalities.
A clustering of some of the functions most relevant to the inequalities agenda is captured below.
Tools available to local authorities to implement health public policy include:
- policy and strategy development and review
- legislation - including regulation, licencing and by-laws
- fiscal measures - incentives and disincentives
- economic development and job creation
- spatial and environmental planning
- welfare and social care
- community safety
- communication - including information and campaigns
- impact as major local employer
- statutory public health responsibilities
These elements can have some of the most powerful and far-reaching impacts on the health and wellbeing of the population as a whole, but also on the inequalities that exist in the society within the place.
Economic development, planning, information and guidance are all factors that can help to ‘make the healthy choices, easier choices’, and can influence the availability of psycho-social and protective/mediating factors.
Factors enabling a full range of levels of influence can be drawn upon, from regulation, behavioural incentives and disincentives, and supportive resources, depending on the risk or opportunity in focus.
These interventions can be reinforced to ensure particular reach to those at a disadvantage, working in various ways through community-centred support and a range of services.
In addition, local authorities have a large web of interactions and linked responsibilities with other public-sector bodies including police, fire and rescue, welfare agencies, education and housing.
The ways the various civic/local authority functions are deployed are complex and offer an opportunity for impact.
Planning the disposition of the powers and resources that might best impact on target priorities on a whole system basis will require an array of specialist knowledge and expertise to be connected directly into place-based planning.
Deploying and harnessing the various civic functions of local authorities effectively through a Health in All Policies (HiAP) approach helps individual agencies and local authority level partnerships to develop strategic plans for health inequalities.
The policies targeted for HiAP are often the main routes to tackling some of the wider determinants of health (for example healthy schools, active and safe travel, access to green spaces and warmer and safer homes).
Alongside national government enabling-initiatives, implementing such policies can impact on whole populations, communities and individuals.
Components within the HiAP Manual – Healthy Public Policy:
- best start in life
- healthy schools and pupils
- jobs and work
- active and safe travel
- warmer and safer homes
- access to green spaces and leisure services
- public protection
- health and spatial planning
- strong communities: wellbeing and resilience
The HiAP Manual provides further guidance on implementing this approach. [footnote 24]
Service-based interventions
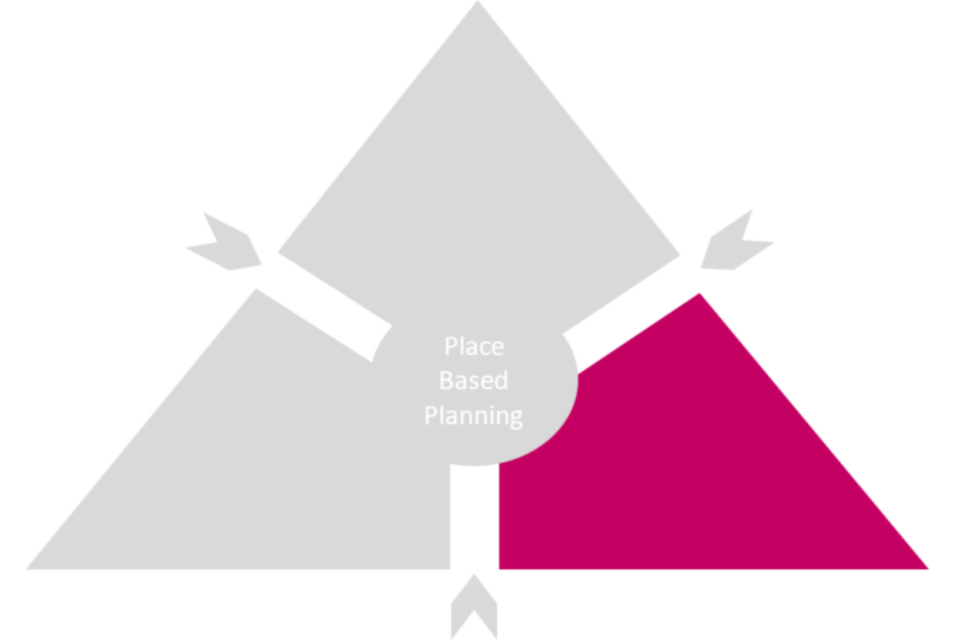
Figure 7. Service-level interventions.
Where interventions have the potential to generate population-level change, this is often not achieved for a number of reasons, broadly:
- unwarranted variability in service quality and delivery (effectiveness; efficiency and accessibility)
- variability in the way the population uses those services (based on knowledge, skills and health-seeking behaviours and resources) - and so variable needs for support to use those services appropriately
Therefore, high-quality services on their own can reduce unwarranted variation in outcomes.
However, they will not reduce inequalities at a population level unless they also identify and (with partners) give graduated and targeted support to the populations in greatest need, who are not using those services to best effect.
A practical, systematic approach to addressing these issues in a coherent way, based on extensive application in systems across the country and - over time - was recently published by PHE as the population outcomes through services (POTS) diagnostic [footnote 25].
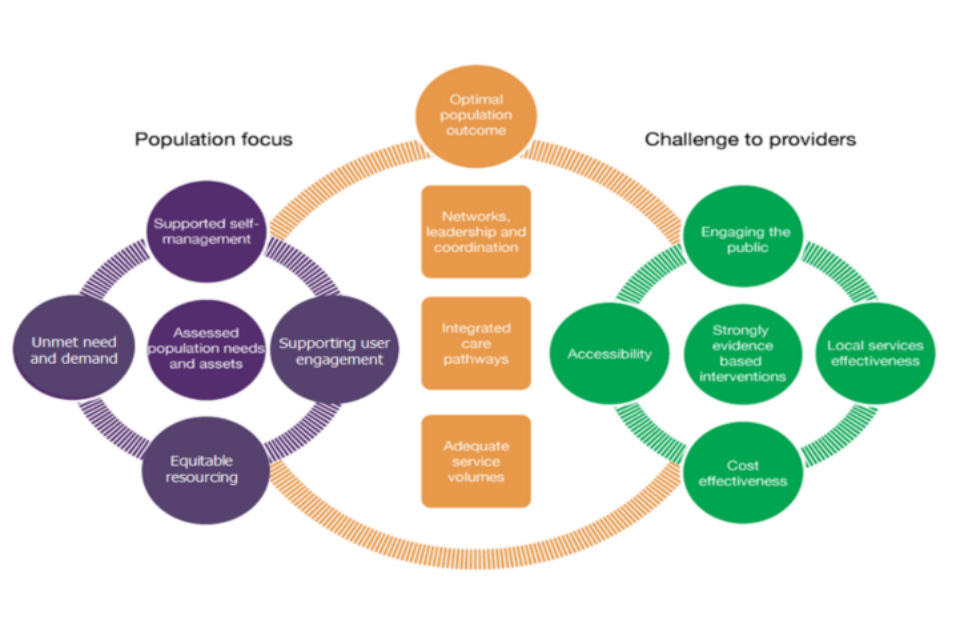
Figure 8. Population Outcomes Through Services (POTS) framework.
It is a symmetrical framework, giving equal weight to 5 elements of direct service delivery:
- strong evidence for interventions themselves (for example NICE and LGA)
- best local service effectiveness (good governance, audit and evaluation, training and Quality Improvement)
- cost effectiveness, efficiency and cost benefit return on investment (for example NICE and LGA)
- accessibility favouring the most disadvantaged (access, service offer and choice)
- service and potential user engagement (design, feedback and delivery)
Five elements influencing how potential beneficiary individuals, families and communities access and use services appropriately, based on:
- needs assessment (distribution of risk, burden, assets and clustering)
- basis of unmet need and demand
- focus and targeting of resources towards equitable outcomes, aiming to move the most disadvantaged, furthest and fastest
- support to improve user engagement and utilisation
- self-managed care (gaps, barriers and resources)
Three elements needed to balance the framework:
- service volumes to accommodate previous unmet need (prevention, earlier identification and management)
- balanced care pathways (minimal bottlenecks)
- leadership, networks and coordination across place and pathways
Extensive use of this diagnostic framework, with more detailed questions laid out under each of the 13 elements, has enabled systems to appreciate the importance of giving attention to both sides and the balancing central elements of the framework.
Scanning across all the contributory factors, either as a place-based assessment or workshop, enables the ‘weakest links’ in the system to be recognised and targeted for corrective or strengthening action.
If you are interested in using a detailed POTS workbook to assess service delivery in your area, contact health.equity@phe.gov.uk.
Community-centred interventions
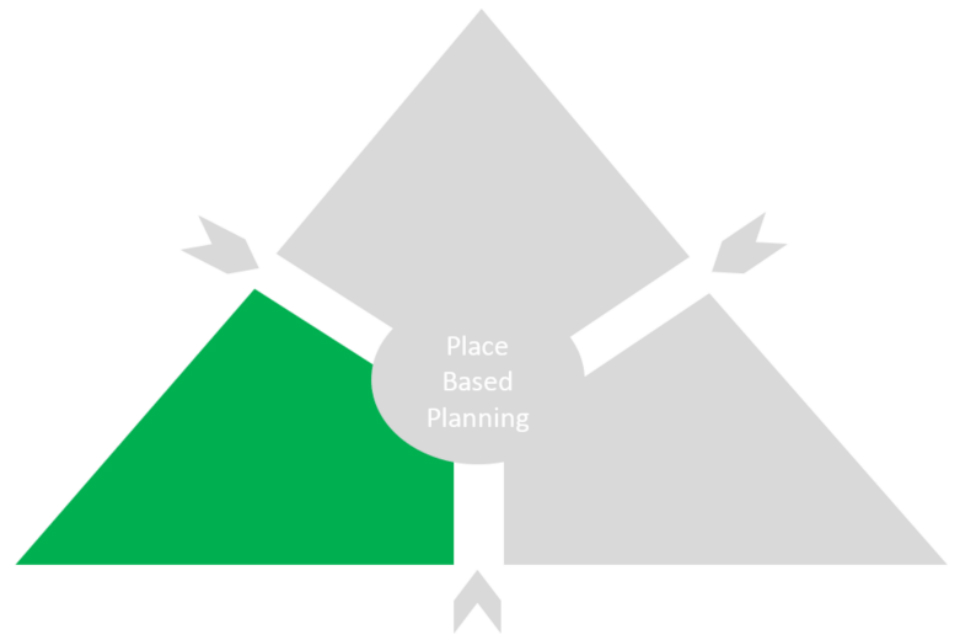
Figure 9. Community-centred interventions.
Communities, both place-based and where people share a common identity or affinity, have a vital contribution to make to health and wellbeing. Community life, social connections, supportive relationships and having a voice in local decisions are all factors that underpin good health.
However, inequalities persist and too many people experience the effects of social exclusion or lack social support [footnote 26].
In order to build community contributions into a central role within place-based strategies to address health inequalities, it is important that all partners, including communities themselves, understand their potential. The assets within communities, such as the skills and knowledge, social networks, local groups and community organisations, are building blocks for good health.
A ‘family of community-centred approaches’ has been developed to represent some of the practical, evidence-based options that can be used to improve community health and wellbeing (see Figure 10) [footnote 27].
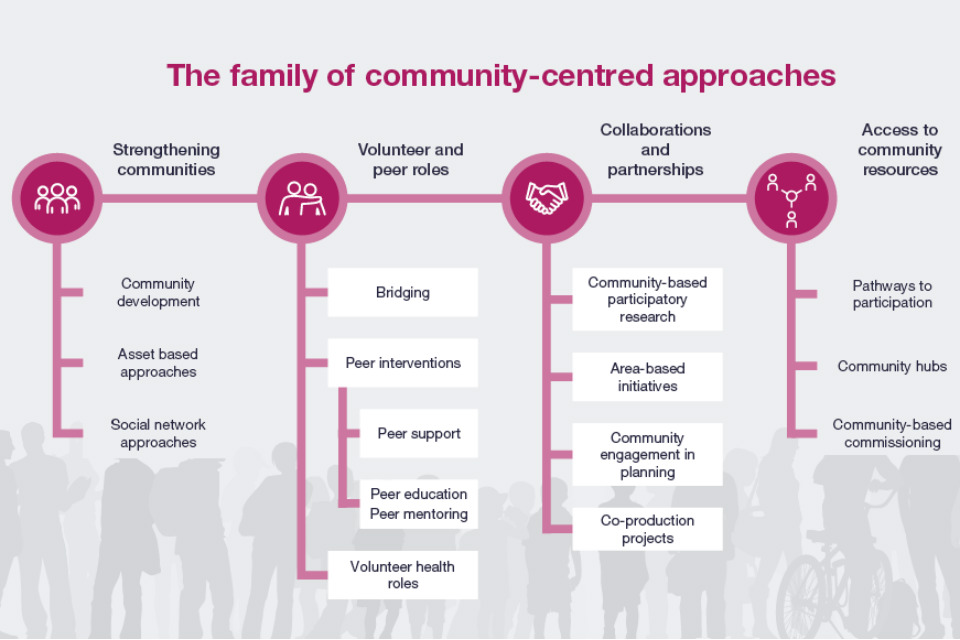
Figure 10. Modes of community-centred action.
Importantly, without including community-centred approaches in a place-based system, there is a risk of leaving behind, and even alienating large parts of the populations with any action to improve the populations’ health.
‘Community-centred’ means that it:
- promotes health and wellbeing or reduces health inequalities in a community setting, using non-clinical methods
- uses participatory methods where community members are actively involved in design, delivery and evaluation
- measures are in place to address barriers to engagement and enable people to play an active part
- utilises and builds on the local community assets in developing and delivering the project
- develops collaborations and partnerships with individuals and groups at most risk of poor health
- focuses on changing the conditions that drive poor health alongside individual factors
- aims to increase people’s control over their health and lives
The main pillars of community-centred action:
1- Strengthening communities:
These approaches build community capacities to take action on health and the social determinants of health – people come together to identify local issues, devise solutions and build sustainable local action.
Common models include:
- Community capacity building, community development, asset-based methods, community organising, social network approaches and time banking.
2- Volunteer and peer roles:
How do they work? These approaches enhance individual capabilities to provide advice, information and support or organise activities in their own or other communities – community members use their life experience and social connections to reach out to others.
Common models include:
- peer support
- peer education
- health trainers
- health champions
- community navigators
- befriending and volunteer schemes such as health walks
3- Collaborations and partnerships:
These approaches involve communities and local services working together at any stage of planning cycle, from identifying needs and agreeing priorities through to implementation and evaluation – involving people leads to more appropriate, equitable and effective services.
Common models include:
- community-centred participatory research
- area-based initiatives
- healthy cities
- area forums
- participatory budgeting
- co-production projects
4- Access to community resources:
These approaches connect individuals and families to community resources, practical help, group activities and volunteering opportunities to meet health needs and increase social participation – the link between primary healthcare and community organisations is critical.
Common models include:
- social prescribing
- green gyms
- community hubs in libraries and faith settings
- healthy living centres
- community-centred commissioning
Further information can be found at family of community interventions [footnote 28].
Section 2 – Place-based planning and leadership
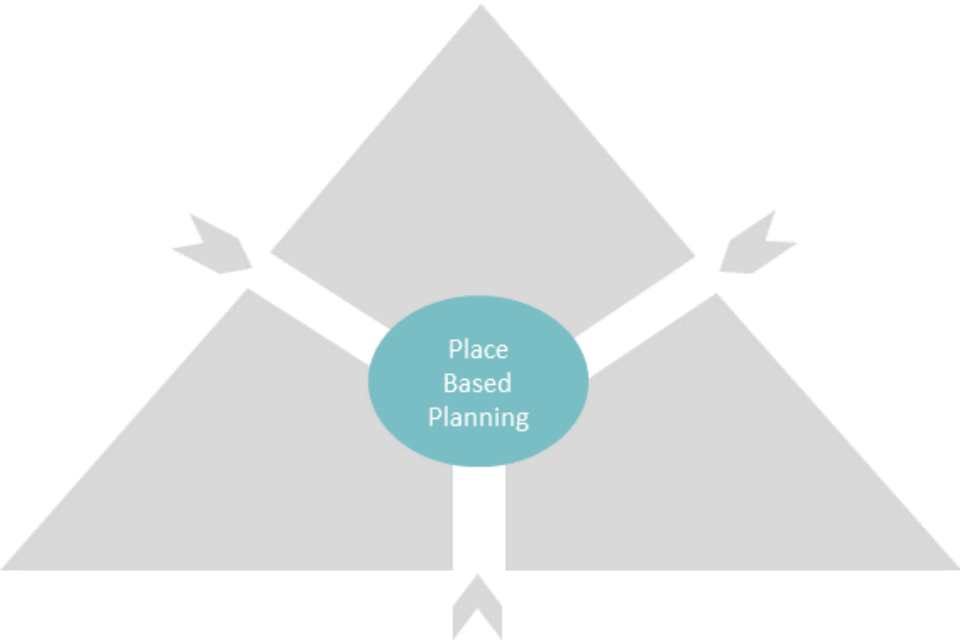
Figure 11. Place-based planning.
Good quality initiatives within the 3 segments of the Triangle described above, delivered with consideration of system, scale and sustainability, are separately able to generate measurable change at population level, including the narrowing of health inequalities gaps.
However, the mechanisms of change are usually different, as are the approaches and ambitions adopted. Because of this, if they can be effectively combined together in a coordinated, multifaceted way within the setting of place, their separate impacts can be additive.
Place-based units of planning will preferably include leadership and senior experts from the main partners, representing the local authority, health and related services and VCSE sector.
This will enable:
- sharing of data and analysis, contributing to holistic assessment of needs and assets
- supporting agreement of shared priorities and objectives
- describing interventions and resources from each segment, and relevant outcomes sought for each
- agreeing mechanisms of cross-organisational programme management and governance, and required data sharing protocols
It is critical that the whole agenda of addressing inequalities in health and wellbeing is owned and prioritised by local system leaders.
This is true of all strategies looking to achieve changes to place-based population level outcomes, many of which (for example public finance; service capacities; independent living; employment and income) are an important component for health inequalities.
Successful management of change will, therefore, depend on the quality of processes at the heart of place-based planning.
Once shared priorities, and ambitions for improvement are established on a place basis, details of how the required change can be managed on a topic basis can follow.
Tool A, a simple self-assessment framework, and follow-up diagnostic, based on extensive practical experience, forms an important part of the Tools section accompanying this framework.
This examines, in 10 steps, how a local place-based planning system can work to improve its system and process towards better population level delivery.
These steps are provided below for information and are likely to be of value to local systems developing plans for reducing health inequalities.
Important elements of effective place-based planning:
- leadership in place: fully committed to Health Inequalities goals
- Joint Needs Assessment: bottom-up and top-down
- joint priority setting: balanced across partners
- whole system: full range of civic, service and community interventions considered
- select interventions: realistic about system and scale
- setting targets: locally relevant and meaningful
- business plan: health economic case for change
- information governance: systematic intelligence sharing
- programme management: who is accountable
- built-in evaluation: from the start
Section 3 – Working on the seams
The work in the segments, despite the differences in their mode of action, often interacts with each of the others.
In many cases, however, these interactions can be inefficient or under-utilised. Thus, focusing on these interfaces or ‘seams’ can help the impact of place-based action involving the 3 segments to become greater than just the sum of its parts.
There are 3 main ‘seams’ within the Intervention Triangle that need attention in order to reduce inefficiencies and add value as illustrated in Figure 12 below and outlined in the following sections.
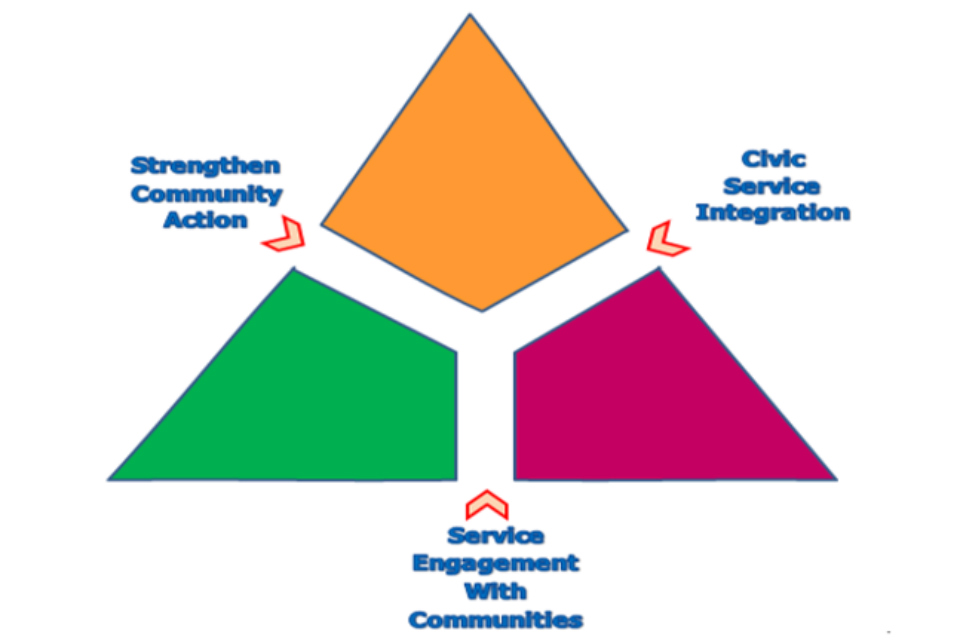
Figure 12. Strengthening the 'seams' between the PIT segments.
Strengthen community action
Within this ‘seam’, an important role of civic authorities, involving some statutory functions, is to support local communities (of neighbourhood; culture; interest) to become more empowered and resilient, and to enable them to support individuals and families to take more control of their own wellbeing and health.
For some issues communities might expect certain protections and provisions to be delivered. For others there may be a preference for being supported to take control for themselves directly.
Working in the other direction, civic authorities will want to engage civil input from individuals and communities in democratic affairs, and participating in processes to influence policy and decision making.
Community engagement needs to be considered through a strategic approach that is systematic, purposeful and based on need.
Some of the most disadvantaged communities may be least able to make their case for inputs and support, and place-based partnerships should be able to take this into account, and make adjustments accordingly.
There is a case to explore ways to build leadership, communication and some basic informal infrastructures in some communities to strengthen their ability to engage with system leaders going forward.
There is a crucial role here for the VCSE sector, and place-based infrastructures and processes need to make sure they identify and support development of active channels of communication and engagement with all important community groupings, as part of a strong inclusion approach.
Some of the most disadvantaged communities may be least able or encouraged to make their case for inputs and support, and place-based partnerships should be able to take this into account, and make adjustments accordingly.
There is a case to explore ways to build leadership, communication and informal infrastructures in some communities to strengthen their ability to engage on a more equitable basis as partners.
Training and mentoring for staff working with communities should aim to systematically provide knowledge, understanding and skills relevant to community development.
There will be an important ongoing role in supporting social networks and forums to help continually share learning and experience within and between local communities, VCSE organisations and statutory sector staff groups.
(See Tool B for a supportive self-assessment and diagnostic)
Service engagement with communities
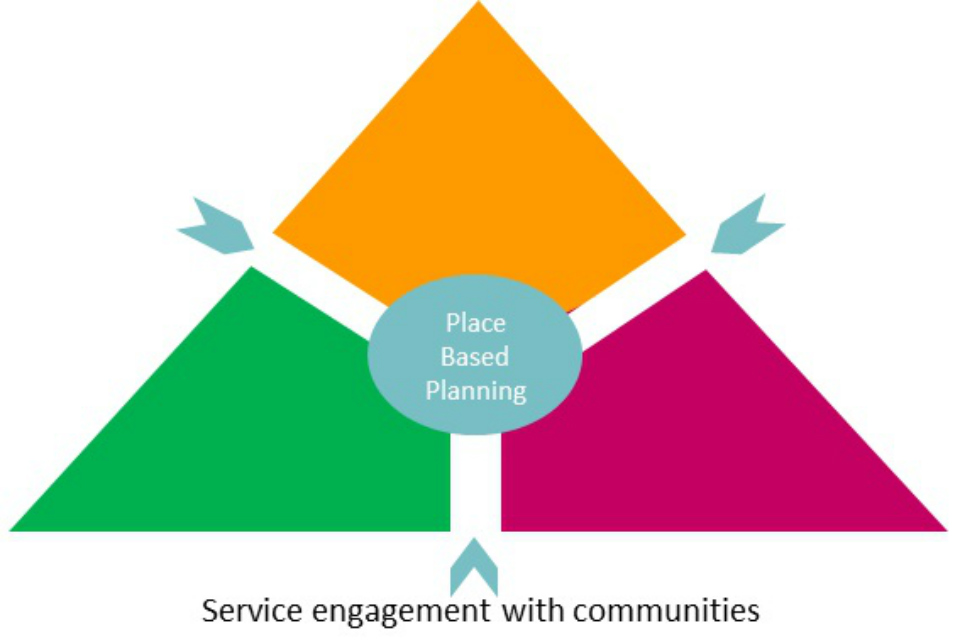
Figure 13. Service engagement with communities.
Although health and social care systems have been working to integrate their structures and processes, and driving for ‘care close to home’, they still often find that barriers persist between their systems and the more disadvantaged people in their communities.
Figure 14 below highlights that the communities of place, interest and culture where people live their lives (left hand side) have their own range of assets such as leadership, venues, organisations and networks.
Within this context they live with sets of different values, beliefs and expectations of themselves, and the lives they lead.
Meanwhile, in the world of health and care services there is a range of organisations with their own cultures and values working hard to embrace integration to bring care closer to home and increase community engagement (the right-hand side).
Place-based working arrangements provide the opportunity to capitalise more consistently and systematically on infrastructures, relationships and trust already established by partner organisations from different sectors working with communities.
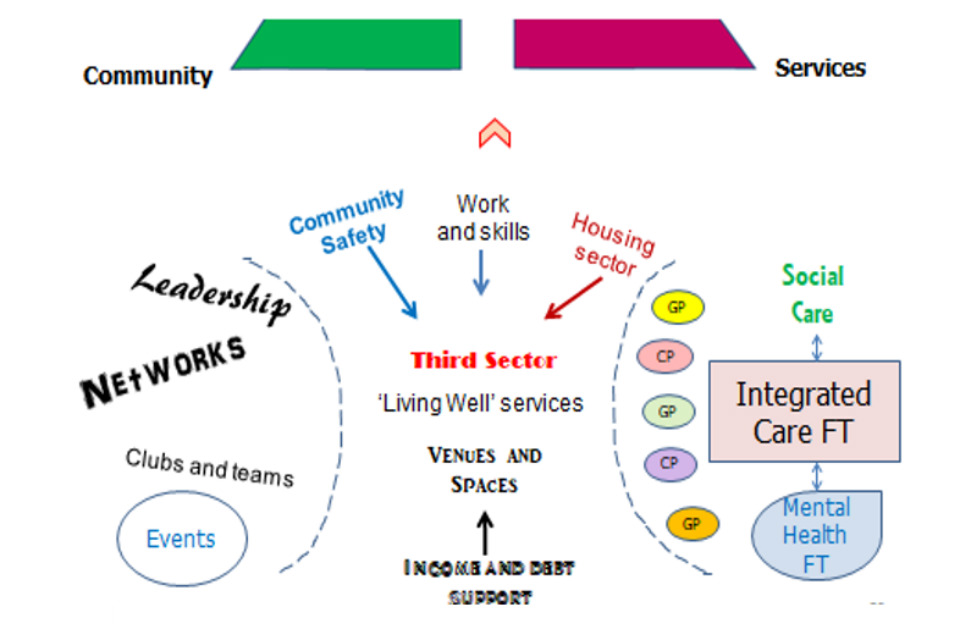
Figure 14. Addressing barriers of service engagement with communities.
These issues will be of ongoing importance, for example as the local health and care services organise themselves into more structured primary care networks.
(See Tool C for supportive self-assessment and diagnostic)
Civic to service integration
Civic authorities, such as local councils, work closely with a range of service providers:
- public sector: for example police; fire and rescue; welfare agencies; NHS
- VCSE sector: for example housing associations; community social enterprises
- private and independent sector: for example bus companies; leisure services; food businesses
Some of these relationships are formalised through commissioning or outsourcing. In addition, in some cases, the authority contributes to, influences and at times constrains service functioning through public policy, regulation, legislation and financing.
Working to integrate services within defined places, and communities of culture and interest, is important for many reasons, including:
- it enables combined focus around the needs of individuals and families, rather than the separate needs of individual services
- it enables the rationalising of overlaps and duplication – bad for patient/user experience and bad for system efficiency
- it enables gaps and barriers to be identified and overcome
- it makes sound financial sense
In order for true integrated working to become normalised, it is crucial that there are regular and ongoing opportunities for joint training and developed shared vision across organisations (including middle management) and professions.
These will need to explicitly explore and work to mitigate real and potential barriers such as cultural differences, understanding the roles of others, and possible barriers of technical jargon and definition.
It is important that processes for integrating services do so with a strong person, family, and community facing perspective.
It is critical, particularly with health inequalities in mind, that the purpose of the integrating process is to make access of services easier for the end user to enable increased uptake for those who need it most.
An important means of achieving this is to engage target communities in consultation throughout the integrating process.
(Tool D provides a simple structured diagnostic to help with these processes)
PIT and the levels of Whole System working
The principles and potential benefits of place-based working are not limited by geographical size. For example, models of Population Health Management, with which PIT is compatible, describe related levels of organisation at different population size:
- System (1+ million)
- District (~250,000 – 500,000)
- neighbourhood and primary care network (~ 50,000)
Similarly, the PIT model can be applied at a range of related levels of infrastructure.
Figure 15 below illustrates how the various levels of infrastructure can relate to each other.
Mirroring the PIT approach at each level can be used to ‘nest’ approaches with connectivity at the different levels of the organisation. In this way, it can enable coherent ‘golden threads’ to be established running through objectives, measures and evaluation.
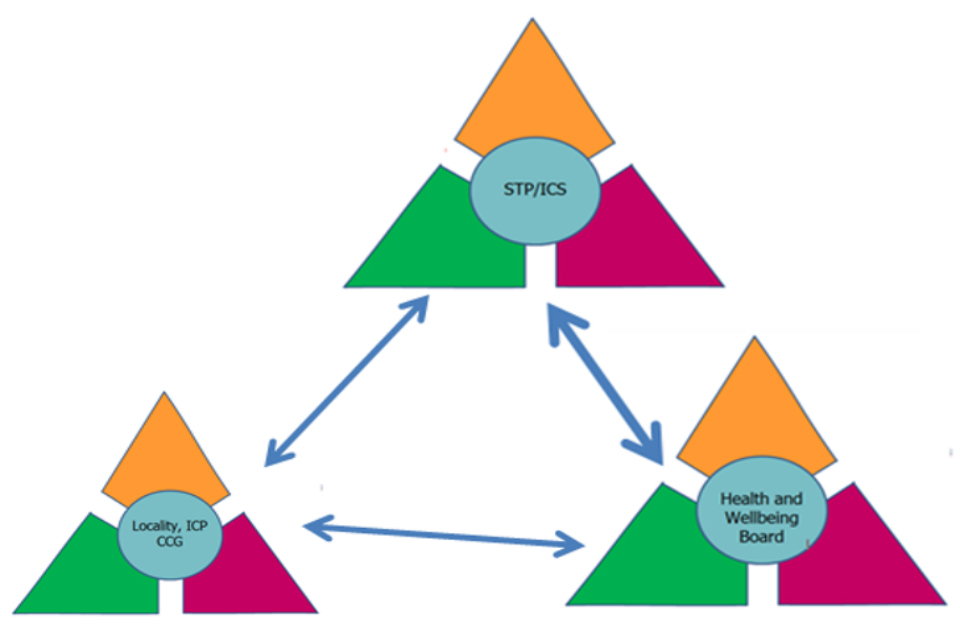
Figure 15. Mirroring the PIT model at different levels of organisation.
It is important to emphasise that it is conceptually easier to describe models such as this in geographical terms. However, it is not useful to confine consideration of communities in this way. In any place, there will be many types of community, which will often be cross-cutting.
However, the principles and mechanisms to help support community engagement are fundamentally similar whether talking about, for example - neighbourhoods, cultural groupings, or protected equity groups.
The accompanying place-based planning tools document of this framework contains tools to support work on each of the 3 seams.
These consist of a set of diagnostics, supported with self-assessment matrices. They explore the most important factors in each case that collated experience has shown will strengthen the effectiveness of action across the particular interface.
Annex 3 provides a hypothetical example of what a place-based approach for health inequalities, using PIT, would look like in practice.
References
-
Office for National Statistics, ‘Health state life expectancies by national deprivation deciles, England and Wales: 2015 to 2017’ ↩
-
Asaria M, Doran T, Cookson R. The costs of inequality: whole-population modelling study of lifetime inpatient hospital costs in the English National Health Service by level of neighbourhood deprivation. Journal of Epidemiology and Community Health. 2016;70(10):990. ↩
-
Marmot M. Fair society, healthy lives: the Marmot Review: strategic review of health inequalities in England post-2010. 2010. ↩
-
Marmot M. Fair society, healthy lives: the Marmot Review: strategic review of health inequalities in England post-2010. 2010. ↩
-
NHS England. NHS Long Term Plan. 2019. ↩
-
Department for Business Energy & Industrial Strategy. Policy paper: The Grand Challenge missions 2018. ↩
-
Department of Health and Social Care. Prevention is better than cure: our vision to help you live well for longer. 2018. ↩
-
NHS England. NHS Long Term Plan. 2019. ↩
-
PHE. Local action on health inequalities: Understanding and reducing ethnic inequalities in health. 2018. ↩
-
Public Health England. Health Profile for England. 2018. ↩
-
Office for National Statistics, ‘Health state life expectancies by national deprivation deciles, England and Wales: 2015 to 2017 ↩
-
https://fingertips.phe.org.uk/profile/public-health-outcomes-framework ↩
-
https://fingertips.phe.org.uk/profile/public-health-outcomes-framework ↩
-
Office for National Statistics, ‘Health state life expectancies by national deprivation deciles, England and Wales: 2015 to 2017 ↩
-
Marmot M. Fair society, healthy lives: the Marmot Review: strategic review of health inequalities in England post-2010. 2010. ↩
-
Asaria M, Doran T, Cookson R. The costs of inequality: whole-population modelling study of lifetime inpatient hospital costs in the English National Health Service by level of neighbourhood deprivation. Journal of Epidemiology and Community Health. 2016;70(10):990. ↩
-
HM Government. Industrial Strategy: Building a Britain fit for the future. 2017. ↩
-
NHS England. NHS Long Term Plan. 2019. ↩
-
Labonte R. Heart health inequalities in Canada: Modules, theory and planning1992. ↩
-
Labonte R. Health promotion and empowerment: Practice Frameworks: Centre for Health promotion. University of Toronto; 1993. ↩
-
Public Health System Group for England. Quality in Public Health: A Shared Responsibility. 2019. ↩
-
PHE, ‘Quality in Public Health: a shared responsibility’, March 2019 www.gov.uk/government/publications/quality-in-public-health-a-shared-responsibility ↩
-
LGA. Health In All Policies: A manual for local government. 2016 ↩
-
Public Health England. Reducing health inequalities: system, scale and sustainability. 2017 ↩
-
Public Health England. Health and wellbeing: a guide to community-centred approaches. 2015 ↩
-
Public Health England. Health and wellbeing: a guide to community-centred approaches. 2015 ↩
-
Public Health England. Health matters: community-centred approaches for health and wellbeing 2018 ↩