
*2018-2019 Winter Outlook...looks like a cold and snowy winter*
Paul Dorian

The current sea surface temperature anomaly pattern features a large and expanding area of warmer-than-normal conditions across the equatorial Pacific Ocean and warmer-than-normal water in the northern Pacific; map courtesy CMC Environment Canada
Key Factors
Several key factors listed below have been examined for the “2018-2019 Winter Outlook” and they suggest to me that this will be a colder-than-normal and snowier-than-normal winter in much of the eastern and southern US:
1. Weak-to-moderate “centrally-based” El Nino in the tropical Pacific
2. Warmer-than-normal water in the northern Pacific
3. Low solar activity
4. High-latitude blocking
5. Northern Hemisphere snowpack
6. Analog years
7. Soil moisture

The consensus of numerous dynamical and statistical computer models is for a weak-to-moderate El Nino this winter season in the equatorial part of the Pacific Ocean; courtesy NOAA, NASA, ECMWF, IRI/CPC
The all-important Pacific Ocean
The Pacific Ocean is the planets biggest, covers more than 30 percent of the Earth’s surface, and is larger than the landmass of all the continents combined. As such, its sea surface temperature (SST) pattern has a tremendous influence on all weather and climate around the world. During last winter, La Nina conditions (i.e., colder-than-normal) dominated in the equatorial part of the Pacific Ocean and there was a persistent area of colder-than-normal water in the northern Pacific as well. This year, however, there are strong signs that El Nino conditions (i.e., warmer-than-normal) will dominate in the tropical Pacific and this can have a tremendous impact on the winter weather in the US depending on its intensity and duration. In addition to intensity and duration, the specific location of an El Nino can be quite crucial to wintertime temperatures and precipitation patterns across the nation.
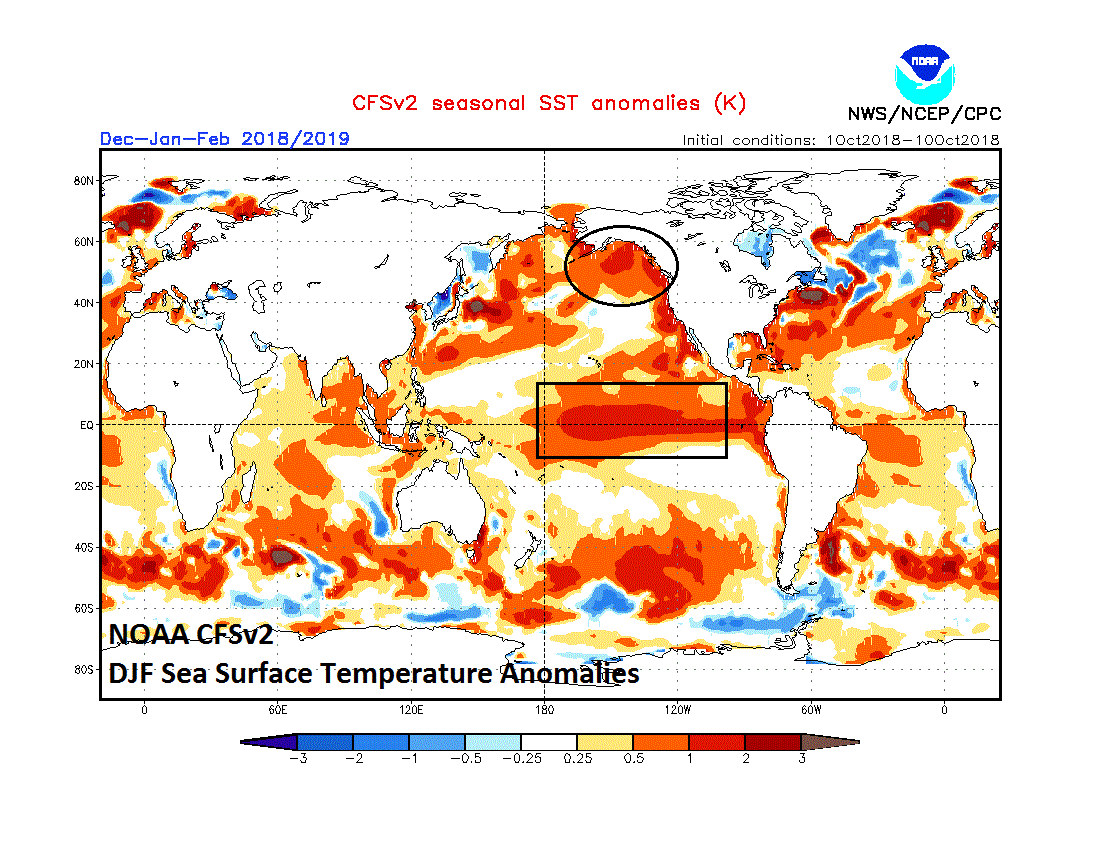
NOAA’s CFSv2 sea surface temperature anomaly forecast map for the upcoming winter season of December/January/February that features an El Nino focused in the central part of the tropical Pacific Ocean and a large patch of warmer-than-normal water in the Gulf of Alaska. Courtesy NOAA
Weak-to-moderate and “centrally-based” El Nino
Current signs point to a weak-to-moderate strength El Nino that should last through the entire winter season and one that is most pronounced in the central part of the Pacific Ocean. The (limited) strength and specific location of this El Nino raises the prospects for a cold and snowy winter season in much of the eastern and southern US. Numerous dynamical and statistical forecast models agree on the formation of a weak-to-moderate El Nino that will last through the upcoming winter season. In addition, forecast models such as the JAMSTEC and NOAA’s CFSv2 suggest the El Nino will be “centrally-based” with the highest sea surface temperatures relative-to-normal concentrated in the middle of the Pacific Ocean as compared to near the west coast of South America. A “centrally-based” El Nino is sometimes referred to as “Modoki” which is a Japanese word that means “similar but different.”
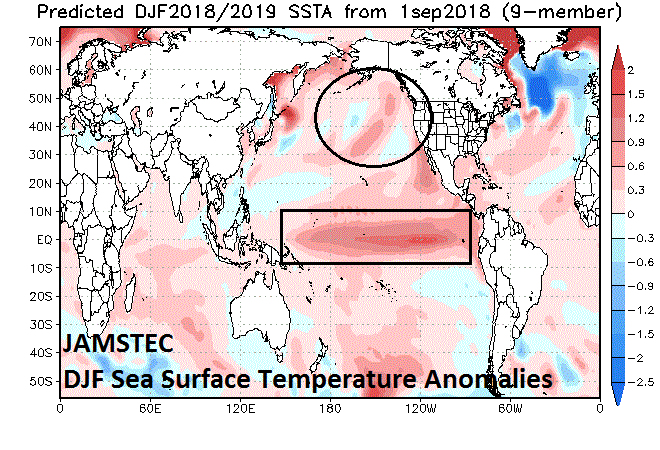
The Japan Agency for Marine-Earth Science and Technology (JAMSTEC) sea surface temperature anomaly forecast map for the upcoming winter season of December/January/February that also features an El Nino focused in the central part of the tropical Pacific Ocean and a large patch of warmer-than-normal water in the Gulf of Alaska (base period for estimation of anomalies is 1983-2006). Source
In recent history, strong El Nino’s that were “eastern-based” generally have been associated with warmer-than-normal winters in the eastern US whereas “centrally-based” weak-to-moderate El Nino’s have been often correlated with cold and snowy winters. For instance, two strong and "eastern-based" El Nino’s that resulted in warm winters in much of the eastern US took place during the winters of 1972-1973, 1982-1983 and 1997-1998. On the other hand, two weak-to-moderate El Nino's that were "centrally-based" and resulted in cold and snowy winters occurred in 2002-2003 and 2009-2010.
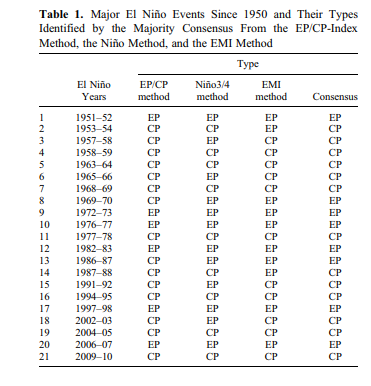
Listing of El Nino events back to the middle of last century which are separated into those which were based in the central Pacific (CP) and those focused in the eastern Pacific (EP). Publication source
There are a couple of reasons why a weak-to-moderate strength and "centrally-based" El Nino can increase the chances for a cold and snowy winter in the eastern US. First, the higher the temperature of the ocean, the more water vapor is released into the atmosphere and this extra moisture tends to energize the southern branch of the jet stream. An activated southern branch of the jet stream, in turn, raises the chances for a storm track across the southern and eastern US. As a result, coastal storms will be much more favorable this winter as compared with last year’s La Nina (colder-than-normal) pattern and east coast storms are generally more favorable for snow in places like the big cities of the I-95 corridor - as long as there is sustainable cold air. Second, a “centrally-based” El Nino tends to favor the formation of higher pressure ridging over the western US with a downstream trough over the eastern US and this type of atmospheric pattern usually allows for numerous cold air outbreaks into the central and eastern US. The findings in a recent publication support the idea of an increased chance for a cold and snowy winter in the southern and eastern US during a "centrally-based" El Nino winter season.

Observed anomalies of 500 mb geopotential heights (contours) and surface air temperature anomalies (color shade) in "centrally-based" El Nino winters (left); schematic diagram (right) of the Central Pacific El Nino impact on US surface temperatures (right) with a “di-pole” pattern. Publication source.
Warming in the northern Pacific Ocean
In addition to the "centrally-based" El Nino sea surface temperature pattern expected in the equatorial part of the Pacific Ocean, there is another important region which too may be signaling for numerous cold air outbreaks this winter into the eastern and southern US. Specifically, the same computer forecasts models that are predicting a "centrally-based" El Nino (e.g., NOAA CFSv2, JAMSTEC) both forecast warmer-than-normal water this winter in the region to the south of the Alaskan southern coastline. This kind of sea surface temperature pattern actually took place on more than one occasion this decade (e.g., 2014-2015, 2013-2014). Warmer-than-normal water in the northern Pacific favors the formation of high pressure ridging along the west coast of Canada which, in turn, allows for the penetration of cold air from northern Canada to reach the central and eastern US.

This plot shows the daily observations of the number of sunspots during the last four solar cycles back to 1 January 1977 according to Solar Influences Data Analysis Center (SIDC). The thin blue line indicates the daily sunspot number, while the dark blue line indicates the running annual average. The current low sunspot activity is indicated by the arrow at the lower right of the plot. Last day shown: 30 Sep 2018. Data source click here .
Low solar activity and its impact on “high-latitude blocking”
In the long term, the sun is the main driver of all weather and climate and multi-decadal trends in solar activity can have major impacts on oceanic and atmospheric temperatures. In addition, empirical observations have shown that the sun can have important ramifications on weather and climate on time scales associated with the average solar cycle (i.e., 11-years). For example, there is evidence that low solar activity years tend to be correlated with more frequent “high-latitude blocking” events. “High-latitude blocking” during the winter season is characterized by persistent high pressure in northern latitude areas such as Greenland, northeastern Canada, and Iceland. Without this type of blocking pattern, it is quite difficult to get sustained cold air outbreaks in the central and eastern US during the winter season and that is usually a critical requirement for snowstorms in, for example, the big cities of the I-95 corridor.
No visible sunspots in a current image of the sun and it has been blank like this 58% of the time in 2018 as we head towards the next solar minimum. Courtesy spaceweather.com
In terms of solar activity, we are now at the end of the weakest solar cycle (#24) in more than a century and are rapidly approaching the next solar minimum – usually the least active time in a given solar cycle. The last solar minimum that took place from 2007-to-2009 turned out to be the quietest period in at least a century and signs point to another deep solar minimum over the next couple of years. The last time an inactive sun coincided with a moderate El Nino event was during the winter of 2009-2010 and the Mid-Atlantic region experienced a cold and snowy winter. In fact, some spots (e.g., Washington, DC) ended up with their snowiest winter on record that season during the historically deep solar minimum. Furthermore, the prior solar minimum winter season of 1995-1996 was also a “gangbuster” winter for the I-95 corridor with cold and snowy conditions and one of the biggest snowstorms ever (January 6-9, 1996).

Low solar activity years are well correlated with abnormally high heights at 500 millibars (shown above in red, orange, yellow) over high-latitude regions like Greenland and Iceland (i.e., high-latitude blocking pattern); Data courtesy NOAA/NCAR
The 500 millibar (~18,000 feet) height composite anomaly plot in previous low solar activity years going back to the middle of last century and there is a clear and strong signal of “high-latitude blocking”. Higher-than-normal heights tended to dominate near Greenland, northeastern Canada and Iceland which typically leads to “high-latitude blocking” patterns in the upper atmosphere allowing for sustained cold air outbreaks in the central and eastern US. Based on these observations from previous low solar activity years, odds certainly would favor frequent “high-latitude blocking” events this upcoming winter given the very strong likelihood for low solar activity.

Northern Hemisphere snowpack (left) at above-normal levels at the end of September ranking 9th highest in the last 50 years; Northern Hemisphere winter snow extent has been on an upward trend (right); courtesy Rutgers Snow Lab
North America snowpack was at the highest level in the last 50 years at the end of September; courtesy Rutgers Snow Lab
Northern Hemisphere snowpack
In addition to oceanic and solar cycles, the snowpack in the Northern Hemisphere during the autumn season is an important consideration for a couple of reasons when preparing a winter outlook. First, a deeper snowpack across the Northern Hemisphere this time of year will likely result in the formation of colder and denser air masses in the important cold air source regions (e.g, Canada, Alaska, Greenland, Siberia). In fact, Greenland has been exceptionally cold since July which is a bullish sign for cold air mass formation. Second, research studies and empirical observations suggest that snowpack in the Northern Hemisphere during the autumn season can be valuable as a predictive tool with respect to “high-latitude blocking” patterns during subsequent winter seasons.
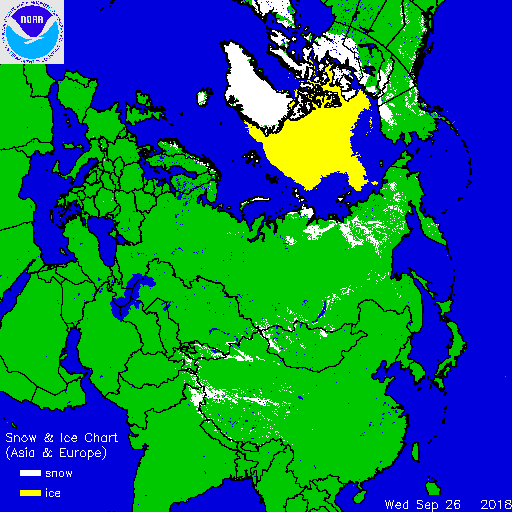
Some expansion of snowcover in Asia during the past couple of weeks and more accumulating snow is predicted in the near term; courtesy NOAA
Specifically, research studies (e.g., Dr. Judah Cohen, AER, Inc.) have actually pinpointed the region in Siberia below 60°N during the month of October as critical with respect to the likelihood of “high-latitude blocking” patterns during the following winter season. If snowpack consistently expands during October in that particular part of Siberia, studies have shown that there is an increased chance for more frequent “high-latitude blocking” configurations in subsequent winter months. Indeed, there has been an increase in snowpack in parts of Siberia during the first part of October and computer forecast models suggest there will be additional accumulating snow in that general region in coming days - so far, a neutral to slightly bullish signal for wintertime “high latitude blocking”. The Northern Hemisphere as a whole experienced above-normal snowpack at the end of September ranking it as the 9th highest snow cover extent in the last 50 years and North America had its highest level ever in that same time frame.
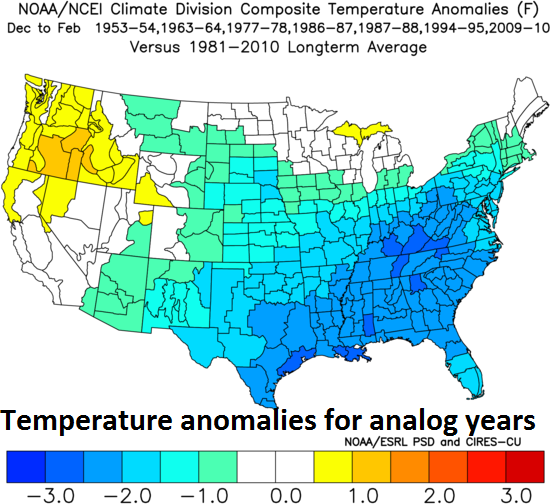
Temperature anomalies for analog years featuring weak-to-moderate El Nino conditions in the central Pacific Ocean along with low solar activity; courtesy NOAA
A look back to analog years
In addition to the evaluation of oceanic and solar cycles as well as Northern Hemisphere snowpack, I believe it is quite valuable to find analog years in the past which feature similar conditions compared to today. By examining closely the winter weather conditions for those particular analog years, we can get some clues as to what can be expected this coming winter season. As such, my analysis back to the middle of last century has produced the following 7 winter seasons with similar oceanic conditions compared to today (i.e., weak-to-moderate and “centrally-based” El Nino) along with low solar activity: 1953-1954, 1963-1964, 1977-1978, 1986-1987, 1987-1988, 1994-1995, 2009-2010.
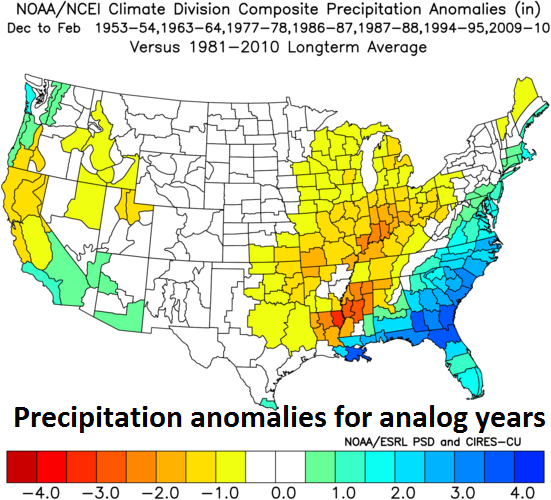
Precipitation anomalies for analog years featuring weak-to-moderate El Nino conditions in the central Pacific Ocean along with low solar activity; courtesy NOAA
In terms of temperature anomalies, there is a pretty clear signal for colder-than-normal conditions in much of the eastern two-thirds of the nation during these analog years with warmer-than-normal conditions in the Pacific Northwest (i.e., resembling the “di-pole” pattern cited earlier for “Modoki” El Nino winter seasons). As far as precipitation is concerned, these analog years featured wetter-than-normal conditions along the east coast which makes some sense in my opinion given the expectation of a “centrally-based” El Nino which tends to energize the southern branch of the jet stream which, in turn, often results in higher probability of east coast storms. Much of the western half of the nation featured normal to below-normal precipitation amounts in these analog years.
Soil Moisture
One other factor to consider as we approach the winter season has to do with the high amounts of rainfall that has been experienced this summer and fall in much of the eastern half of the nation. As a result of persistent and substantial rainfall in recent months, soil moisture content is very high as we approach the upcoming winter season in much of the eastern part of the nation. This condition adds to prospects for a long-wave trough of low pressure to set up in the eastern US given boosted humidity levels in the lower atmosphere (less dense air, lower pressure) and this kind of upper-level pattern would favor the penetration of cold air masses into the central and eastern US from cold source regions to the north.
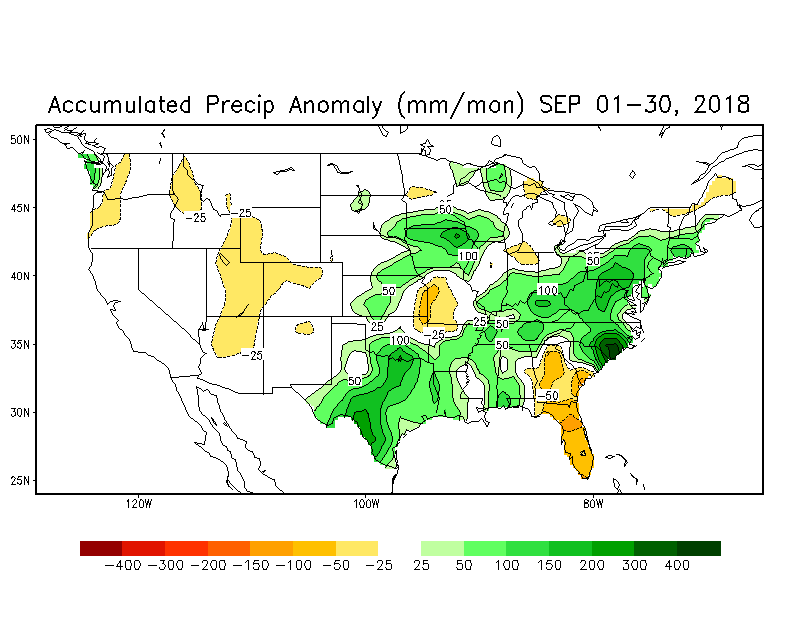
Soil moisture anomaly chart for the month of September featuring wetter-than-normal conditions in much of the eastern half of the nation; Courtesy NOAA
The bottom line
A detailed analysis of many different factors suggests to me that much of the eastern half of the nation should experience a colder-than-normal winter with more snow than normal. Coastal storms in the eastern US will be much more of a threat this winter as compared to last year when La Nina conditions dominated in the equatorial Pacific. Overall temperatures in the Mid-Atlantic region are likely to end up about 1.5-3.0 degrees (F) below-normal for the winter season and perhaps an even more dramatic chill will take place in the Southeast US where overall temperatures may average several degrees below normal.
Snowfall is likely to be at least ten inches above the normal amounts in the Mid-Atlantic region this winter season which could result in 25+ inches in the DC metro region, 30+ inches in Philly and 35+ inches in New York City. Unlike some recent winters, this season is likely to get off to a quick start with some notable cold and snow in the early part of the season. Much of the western third of the nation is likely to experience warmer conditions relative-to-normal; especially, in the Pacific Northwest where it could be several degrees above normal. Precipitation amounts this winter season in the western third of the nation are likely to be near normal to slightly drier-than-normal.
Stay tuned…we’ll continue to monitor all of these key factors in coming weeks.
Meteorologist Paul Dorian
Perspecta, Inc.
perspectaweather.com
Extended video discussion on the “2018-2019 Winter Outlook”: