

Abstract
Climate warming has significant impacts on permafrost, infrastructure and soil organic carbon at the northern high latitudes. These impacts are mainly driven by changes in soil temperature (TS). Snow insulation can cause significant differences between TS and air temperature (TA), and our understanding about this effect through space and time is currently limited. In this study, we compiled soil and air temperature observations (measured at about 0.2 m depth and 2 m height, respectively) at 588 sites from climate stations and boreholes across the northern high latitudes. Analysis of this circumpolar dataset demonstrates the large offset between mean TS and TA in the low arctic and northern boreal regions. The offset decreases both northward and southward due to changes in snow conditions. Correlation analysis shows that the coupling between annual TS and TA is weaker, and the response of annual TS to changes in TA is smaller in boreal regions than in the arctic and the northern temperate regions. Consequently, the inter-annual variation and the increasing trends of annual TS are smaller than that of TA in boreal regions. The systematic and significant differences in the relationship between TS and TA across the circumpolar north is important for understanding and assessing the impacts of climate change and for reconstruction of historical climate based on ground temperature profiles for the northern high latitudes.
Export citation and abstract BibTeX RIS

Original content from this work may be used under the terms of the Creative Commons Attribution 3.0 licence.
Any further distribution of this work must maintain attribution to the author(s) and the title of the work, journal citation and DOI.
1. Introduction
Air temperatures (TA) across northern high latitudes are increasing twice as fast as the global average (IPCC 2013), which could have significant impacts on permafrost (Chadburn et al 2017), infrastructure (Nelson et al 2001), and the large stock of organic carbon stored in frozen soils (Schuur et al 2015). These impacts are mainly driven by changes in soil temperature (TS). Thus, understanding the response of TS to TA increase is critical to predict the magnitude of these impacts. Seasonal snow cover can cause significant differences between TA and TS (dTSA = TS−TA), known as surface offset, through thermal insulation and reflection of solar radiation (Smith and Riseborough 2002, Zhang 2005). Since snow conditions are highly variable, observations and modelling studies show that annual dTSA differs not only spatially (Zhang 2005, Morse et al 2012, Palmer et al 2012, Throop et al 2012), but also varies with time (Zhang et al 2001, Stieglitz et al 2003, Zhang et al 2005, Isard et al 2007, Osterkamp 2007, Romanovsky et al 2007, Woodbury et al 2009, Lawrence and Slater 2010, Qian et al 2011, Park et al 2014, Wang et al 2017). Previous observation-based investigations of dTSA are limited to local or regional scales (Zhang et al 2001, Beltrami and Kellman 2003, Stieglitz et al 2003, Isard et al 2007, Osterkamp 2007, Romanovsky et al 2007, Sherstyukov 2008, Woodbury et al 2009, Qian et al 2011, Morse et al 2012, Park et al 2014, Streletskiy et al 2015, Wang et al 2017). Modelling studies can consider the entire circumpolar region but the results differ widely due to model structure and input data (Lawrence and Slater 2010, Wang et al 2016). This uncertainty limits our capacity to assess the impacts of climate change on permafrost and northern ecosystems and affects reconstruction of historical climate change from deep ground (>10 m) temperature profiles (Beltrami and Kellman 2003, Mann and Schmidt 2003, Bartlett et al 2005).
In this study, we compiled observations at 588 sites from climate stations and boreholes across the northern high latitudes. Based on this large number of site observations, we analyzed the spatial and temporal variations of near surface TS (measured at about 0.2 m below surface), near surface TA (measured at about 2 m above surface), dTSA and the relationships with snow conditions. We use the data to explore the following questions. (1) What is the general range of mean dTSA, and are there any broad scale spatial patterns evident across the circumpolar north? (2) How does annual dTSA change with climate warming, and is there any evidence that changes in dTSA affected the response of TS to TA? (3) How are the spatial and temporal variations in dTSA related to snow conditions at the circumpolar scale?
2. Data and processing
The data used in this study include observations from climate stations and boreholes across the northern high latitudes. We only included sites with latitudes greater than 45 °N. Daily data from Russian meteorological stations were obtained from the All-Russian Research Institute of Hydrometeorological Information-World Data Centre (Sherstiukov 2012a). Daily data from Canadian climate stations were provided by Environment and Climate Change Canada. Borehole ground temperature and TA data were obtained from Global Terrestrial Network for Permafrost (GTN-P) and the literature.
The Russian climate station dataset includes 458 stations for TS, 619 stations for snow depth, 599 stations for TA and precipitation. In combination, 264 stations have measurements of TS, TA, snow depth, and precipitation. A detailed description of the TS dataset is provided in Sherstiukov (2012a). TS was measured at 12 depths (0.02, 0.05, 0.1, 0.15, 0.2, 0.4, 0.6, 0.8, 1.2, 1.6, 2.4, and 3.2 m). The records are sparse at the top four depths. Therefore, we used observations at 0.2 m as the near surface TS for the analysis. The observations were mainly from 1985–2011, and a third to a quarter of the stations also had observations from 1963–1976 and 1984. Sherstiukov (2012b) conducted a series of quality checks on the TS dataset. Each record was given a quality flag but no corrections. In this study, we corrected the obvious errors based on the quality flags but strove to avoid over-correction. Obvious errors corrected included sudden sign changes and significant value changes. We performed the correction by comparing the flagged records with the records on the preceding and the following days. On average, about one to two records of TS at 0.2 m depth were corrected for each station.
In Canada, daily TS was measured at about 80 stations across the country by Environment and Climate Change Canada. Most of these stations are in the south of 60 °N. TS was measured at depths of 0.05, 0.1, 0.2, 0.5, 1.0, and 1.5 m during various periods between 1958 and 2008, mainly 1964–1999. TS was recorded twice daily, morning (0800 h) and afternoon (1500 h). We only used morning observations in the analysis as there were more missing data in the afternoon observations (Qian et al 2011). In total, 70 stations have at least one year of complete observations for both TA and TS. Among these, 69 stations also have at least one year of snow depth observations.
The Global Terrestrial Network for Permafrost provides a comprehensive database for permafrost monitoring parameters, including ground temperatures at various depths, TA and active-layer thickness. We downloaded (performed in March 2017) data from sites with at least one year of complete observations of TA and/or ground temperatures at about 0.2 m depth. Some boreholes are near climate stations, so we estimated TA for these boreholes from the nearby climate station data if TA was not measured at the site. In total we compiled 145 boreholes with at least one year of complete observations of TA and ground temperatures at about 0.2 m depth (101 boreholes in Russia, 29 boreholes in Alaska, 15 boreholes in Canada). We also included 109 sites from recently published papers: 53 sites across the Mackenzie Valley Corridor in northwestern Canada (Duchesne et al 2014, Wolfe et al 2010); one site in Peel Plateau in northwestern Canada (averaged for two spruce forest observation sites) (O'Neill et al 2015); two sites for alluvial and uplands in the Kendall Island Bird Sanctuary in the outer Mackenzie Delta (averaged for seven and eight observation sites, respectively) (Morse et al 2012); three sites for black spruce forest, white spruce forest and open black spruce peatland, respectively, in the Great Slave Region (each site was averaged from three nearby observation sites) (Morse et al 2016); three sites for bog, fen and palsa, respectively, in the southern Hudson Bay Lowlands (each site was averaged from two nearby observation sites) (Ou et al 2016); 24 sites in Labrador and Quebec in eastern Canada (measurements at barren and rock sites were excluded in boreal regions and the sites very close to one another were averaged as one site) (Way and Lewkowicz 2018); 11 sites across permafrost regions in Canada (Throop et al 2012); one site in the Lena River Delta, Russia (Boike et al 2013); and 11 sites in southern Norway (Farbrot et al 2011). Together with observations at climate stations, we compiled 588 sites with at least one year of complete observations of both TA and TS. The longest dataset available is 38 years. There are 442 sites with at least five years of complete observations although the years may not be continuous. Figure 1(a) shows the distribution of the sites and the mean TA.
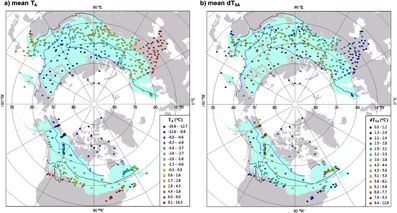
Figure 1. The distributions of (a) mean TA and (b) mean dTSA. The data are divided into 15 classes using natural breaks provided by ArcGIS. The grey area is for land or glaciers, and the light green area is for boreal regions, which is from Brandt (2009) for North America and Potapov et al (2008) for Eurasia. The blue and black curves are the southern boundaries of continuous and isolated patches of permafrost, respectively based on Brown et al (2002).
Download figure:
Standard image High-resolution imageUsing daily snow depth observations at climate stations, we calculated annual snow cover duration, winter mean snow depth (last December, January and February) and annual mean snow depth (sum of daily snow depths divided by the total number of days in a year). In the text, annual TA or annual mean TA (or other variables) is the average of a year at a site, and mean TA or mean annual TA (or other variables) is the average of all the years of observations at a site. Annual averages are based on calendar year except for the correlation analysis of annual snow conditions described in the last two paragraphs in section 3.4, where a year is defined from October 1st to September 30th in the following year. Correlation analysis is based on Pearson momentum correlation coefficients (R). Simple linear regressions were calculated based on least squares to estimate temporal trends and linear relations between two variables. We also calculated mean absolute deviation (MAD) to represent inter-annual variations for annual TA and TS. These statistics were calculated for sites with at least five years of complete observations. We used a marginal significance level (one-sided p < 0.1) in trends and correlation analysis to maximize the number of sites for spatial coverage. The general patterns are similar when we limited to sites with longer observations and higher statistical significance levels.
3. Results
3.1. Spatial distribution of mean dTSA
Mean TA decreases from south to north (figure 1(a)). While mean TS shares a similar pattern, it exhibits a greater variation than that of TA due to local variations in snow, soil and vegetation conditions. Figure 1(b) shows the spatial distribution of mean dTSA. Mean dTSA ranges from about 0.0 °C–12.9 °C, with an average of 4.4 °C. Mean dTSA shows a non-linear relationship with mean TA: It increases from less than 2 °C to up to 12.9 °C (with an average of 7.3 °C) until mean TA reaches about −10 °C, then it decreases to about 2 °C until mean TA is about 7 °C, after which it has no obvious trend (figure 2(a)). Mean dTSA is greatest in the low arctic and northern boreal regions. It decreases both northward and southward (figures 1(b) and 2). Because of these different patterns, the spatial gradients of mean TS and TA vary among the different biomes. The north-south gradient of mean TS is about one and a half times of the gradient of mean TA in the arctic, but only about two thirds of that of mean TA in boreal regions on average. In northern temperate regions, the spatial gradients of mean TS and TA are similar, especially in southern areas.
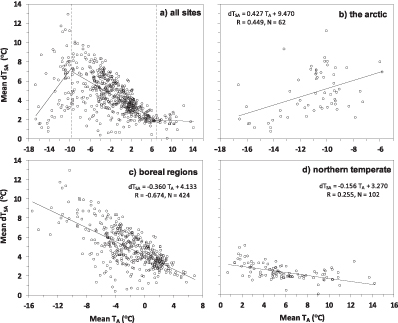
Figure 2. The distribution and linear regressions of mean dTSA with mean TA for (a) all the sites, (b) for the sites in the arctic, (c) in boreal regions, and (d) in northern temperate regions. Each circle represents one site (averaged for all the years of observations). The solid lines are linear regressions. In panel 'a', the two breakpoints (−9.6 and 7.1 °C of mean TA) were determined based on segmented linear regression analysis. The three linear regressions between dTSA and mean TA are dTSA = 0.72 TA + 14.42 (R = 0.463, N = 58) for mean TA < −9.6 °C, dTSA = −0.31 TA + 4.08 (R = −0.655, N = 501) for −9.6 ≤ TA< 7.1 °C, and dTSA = −0.00 TA + 1.91 (R = −0.014, N = 29) for mean TA ≥ 7.1 °C, respectively.
Download figure:
Standard image High-resolution image3.2. Temporal variations of annual TS and dTSA with TA
To investigate the response of TS to changes in TA, we calculated simple linear regressions and Pearson correlation coefficients between annual TS and annual TA, and between annual dTSA and annual TA based on the time series data for each site (table 1). Since TA is the primary driver of the variations in TS, annual TS is positively and significantly (p < 0.1) correlated with annual TA for 83% of the sites. However, the relationship between annual TS and TA varies with biomes. The R-values tend to be lower in boreal regions than in the arctic and the northern temperate regions (figure 3(a) and table 1). Annual dTSA is significantly (p < 0.1) but negatively correlated with TA for 83% of the sites, and the correlation tends to be stronger (closer to −1) in boreal regions than in the arctic and the northern temperate regions (figure 3(b) and table 1). This result indicates a weaker coupling between annual TS and TA associated with a stronger correlation between annual dTSA and TA in boreal regions than in the arctic and the northern temperate regions.
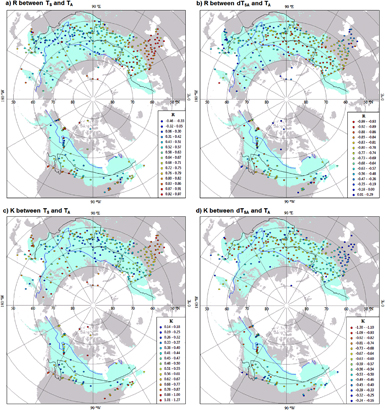
Figure 3. The spatial distributions of R and K calculated based on time series data for each site with at least five years of observations. (a) R between annual TS and annual TA; (b) R between annual dTSA and annual TA; (c) K between annual dTS and annual TA when the correlation is significant at p < 0.1; and (d) K between annual dTSA and annual TA when the correlation is significant at p < 0.1. For a site, the K between annual TS and annual TA equals the K between annual dTSA and annual TA minus 1. The data are divided into 15 classes using natural breaks provided by ArcGIS. The grey area is for land or glaciers, and the light green area is for boreal regions. The blue and black curves are the southern boundaries of continuous and isolated patches of permafrost, respectively.
Download figure:
Standard image High-resolution image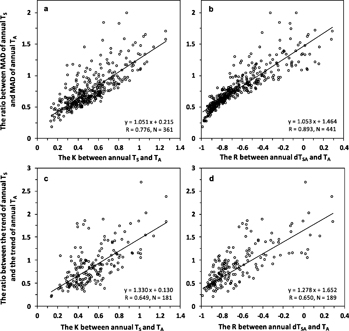
Figure 4. The distributions of the ratios between the mean absolute deviation (MAD) of annual TS and MAD of TA with (a) the K between annual TS and TA and (b) the R between annual dTS and TA. And the distributions of the ratios between the trend of annual TS and the trend of annual TA with (c) the K between annual TS and TA and (d) the R between annual dTS and TA. Each circle represents one site with significant correlations (p < 0.1) for the K between annual TS and TA and for the trends of annual TS and TA. They are calculated based on the time series of data for each site with at least five years of observations.
Download figure:
Standard image High-resolution imageSlope coefficients (K) of linear regressions between annual TS and TA are less than 1.0 for almost all the sites (only 11 sites are exceptions). The values of K in boreal regions are smaller than in the arctic and the northern temperate regions (figure 3(c), table 1). Conversely, the values of K between annual dTSA and TA are negative, and they are smaller (closer to −1) in boreal regions than in the arctic and the northern temperate regions (figure 3(d), table 1). This analysis suggests that annual TS is less responsive to changes in annual TA in boreal regions than in the arctic and the northern temperate regions. However, annual dTSA is more sensitive to changes in TA in boreal regions than in other regions.
3.3. Impacts of dTSA on the inter-annual variations and long-term trends of annual TS
A negative correlation between annual dTSA and TA or a smaller response of annual TS to the changes in annual TA has two implications. First, the inter-annual fluctuation of TS will be smaller than that of TA. Second, if there is a long-term increasing trend in annual TA, the increase of annual TS will be less than that of TA. To confirm these patterns, we calculated MAD and linear temporal trends for annual TS and TA based on the time series data for each site with at least five years of observations. The ratio between MAD of annual TS and MAD of annual TA increases linearly with the K between annual TS and TA and with the R between annual dTSA and TA (figures 4(a) and (b)). The ratio between the trend of annual TS and the trend of annual TA also increases linearly with the K between annual TS and TA and with the R between annual dTSA and TA (figures 4(c) and (d)). This result indicates that the inter-annual variation and the trend of TS are closely related to the response of TS to changes in annual TA and the correlation between dTSA and TA. When the response of annual TS to change in TA is small (small K-values), the inter-annual variation and the trend of TS are smaller than that of TA. Similarly, when annual dTSA and TA are strongly correlated, the inter-annual variation and the trend of TS are smaller than that of TA.
For different biomes, the ratio between MAD of annual TS and MAD of annual TA tends to be smaller in boreal regions than in the arctic and the northern temperate regions (table 2). Similarly, the ratio between the trend of annual TS and the trend of annual TA tends to be smaller in boreal regions than in the arctic and the northern temperate regions (table 2). These results are consistent with the weaker coupling between annual TS and TA (stronger correlation between annual dTSA and TA) and smaller K-values between annual TS and TA in the boreal than in the arctic and the northern temperate regions (table 1).
Table 1. The correlation between annual TS and annual TA and between annual dTSA and annual TA for sites with at least five years of observations.
| Biomes | The arctic | Boreal regions | Northern temperate | Whole area |
|---|---|---|---|---|
| Number of sites | 35 | 302 | 105 | 442 |
| Average observation years | 10.1 | 20.6 | 22.1 | 20.1 |
| Correlation between annual TS and annual TA | ||||
| Average (median) R | 0.66 (0.70) | 0.56 (0.61) | 0.74 (0.80) | 0.61 (0.67) |
| Number (and %) of sites with a significant (p < 0.1) correlation | 26 (74.3%) | 243 (80.5%) | 98 (93.3%) | 367 (83.0%) |
| Average (median) K when p < 0.1 | 0.68 (0.63) | 0.46 (0.64) | 0.63 (0.61) | 0.52 (0.48) |
| Correlation between annual dTSA and annual TA | ||||
| Average (median) R | −0.45 (−0.45) | −0.70 (−0.77) | −0.59 (−0.69) | −0.66 (−0.74) |
| Number (and %) of sites with a significant (p < 0.1) correlation | 17 (48.5%) | 269 (89.1%) | 81 (77.1%) | 367 (83.0%) |
| Average (median) K when p < 0.1 | −0.56 (−0.51) | −0.65 (−0.63) | −0.46 (−0.47) | −0.60 (−0.59) |
Table 2. The ratio between MAD of annual TS and MAD of annual TA, and the ratio between the trend of annual TS and the trend of annual TA when the trends are significant (p < 0.1) for both TS and TA.
| The arctic | Boreal regions | Northern temperate | Whole area | |
|---|---|---|---|---|
| The ratios between MAD of annual TS and MAD of annual TA | ||||
| Number of sites | 35 | 302 | 105 | 442 |
| Average observation years | 10.1 | 20.6 | 22.1 | 20.1 |
| Average (median) ratios | 1.00 (0.93) | 0.73 (0.66) | 0.83 (0.75) | 0.77 (0.70) |
| % of sites with the ratio < 1 | 57.1 | 84.8 | 81.0 | 81.7 |
| The ratios between the trend of annual TS and the trend of annual TA | ||||
| Number (and %) of sites with significant (p < 0.1) trends | 11 (31.4%) | 120 (39.7%) | 58 (55.2%) | 189 (42.8%) |
| Average observation years | 13.5 | 25.7 | 26.5 | 25.2 |
| Average (median) ratios | 1.00 (1.05) | 0.75 (0.70) | 0.91 (0.82) | 0.81 (0.79) |
| % of the sites with the ratio < 1 | 36.4 | 76.7 | 67.2 | 71.4 |
Table 3. Correlation analyses among annual mean snow depth, snow cover duration, annual TA and dTSA for climate stations with at least five years of complete observations.
| Biomes | The arctic | Boreal regions | Northern temperate | Whole area |
|---|---|---|---|---|
| Number of sites | 8 | 213 | 79 | 300 |
| Average observation years | 12.9 | 17.6 | 16.7 | 17.2 |
| Correlation between annual mean snow depth and annual snow cover duration | ||||
| Average (median) R | 0.48 (0.60) | 0.57 (0.61) | 0.66 (0.68) | 0.59 (0.63) |
| Number (and %) of sites with a significant (p < 0.1) correlation | 5 (62.5%) | 187 (87.8%) | 75 (94.9%) | 267 (89.0%) |
| Correlation between annual mean snow depth and annual mean TA | ||||
| Average (median) R | 0.07 (−0.02) | −0.25 (−0.30) | −0.48 (−0.46) | −0.30 (−0.34) |
| Number (and %) of sites with a significant (p < 0.1) correlation | 2 (25.0%) | 112 (52.6%) | 55 (69.6%) | 169 (56.3%) |
| Average (median) K when p < 0.1 (cm/°C) | 4.05 (4.05) | −1.10 (−1.37) | −1.08 (−0.86) | −1.03 (−1.23) |
| Correlation between annual snow cover duration and annual mean TA | ||||
| Average (median) R | −0.16 (−0.13) | −0.40 (−0.43) | −0.55 (−0.62) | −0.44 (−0.48) |
| Number (and %) of sites with a significant (p < 0.1) correlation | 1 (12.5%) | 147 (69.0%) | 66 (83.5%) | 214 (71.3%) |
| Average (median) K when p < 0.1 (d/°C) | −4.9 (−4.9) | −6.4 (−5.7) | −9.1 (−8.7) | −7.2 (−6.2) |
| Correlation between annual dTSA and annual mean snow depth | ||||
| Average (median) R | 0.52 (0.55) | 0.53 (0.60) | 0.54 (0.60) | 0.53 (0.60) |
| Number (and %) of sites with a significant (p < 0.1) correlation | 7 (87.5%) | 164 (77.0%) | 62 (78.5%) | 233 (77.7%) |
| Average (median) K when p < 0.1 (°C/cm) | 0.093 (0.089) | 0.183 (0.150) | 0.187 (0.156) | 0.182 (0.150) |
| Correlation between annual dTSA and annual snow cover duration | ||||
| Average (median) R | 0.15 (0.17) | 0.39 (0.45) | 0.43 (0.51) | 0.40 (0.46) |
| Number (and %) of sites with a significant (p < 0.1) correlation | 2 (25.0%) | 144 (67.6%) | 55 (69.6%) | 201 (67.0%) |
| Average (median) K when p < 0.1 (°C/d) | 0.055 (0.055) | 0.039 (0.035) | 0.018 (0.018) | 0.034 (0.034) |
3.4. The causes of the spatial and temporal differences in dTSA
Across the northern high latitudes, mean annual dTSA is closely correlated with mean winter dTSA (R = 0.894, N = 554) but the correlation with mean summer dTSA is poor and negative (R = −0.265, N = 554 sites), indicating that mean annual dTSA is mainly determined by winter conditions. Mean winter dTSA is negatively correlated with mean winter TA (R = −0.740, N = 554) while the correlation between mean summer dTSA and mean summer TA is poor (R = 0.358, N = 554).
Observations of TA, TS and snow depth at climate stations in Russia and Canada indicate that mean winter dTSA is correlated with mean winter snow depth (R = 0.661, N = 333 stations, figure 5(a)). Mean dTSA is also closely correlated with mean annual snow depth (R = 0.678, N = 329 stations, figure 5(b)). For stations with three to eight months of snow cover in a year, mean dTSA increases linearly with mean snow cover duration (R = 0.797, N = 295 stations) (figure 5(c)). Mean annual snow depth tends to be low when mean TA is very low or very high (figure 6(a)), and snow cover duration decreases with the increase in mean TA (figure 6(b)). Thus, the large dTSA in the low arctic and northern boreal regions is mainly due to the long duration of relatively thick snow cover in this region. In the high arctic, thin snow cover due to low snowfall, wind redistribution (Morse et al 2012, Palmer et al 2012) and development of wind slab (Derksen et al 2014) reduce the insulation effects on the ground. In the northern temperate regions, short duration of snow cover reduces annual dTSA.
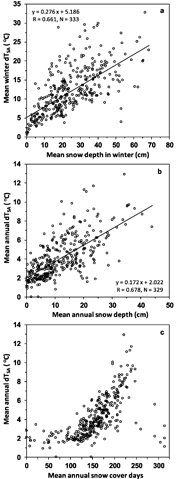
Figure 5. Scatter graphs (a) between mean winter dTSA and mean winter snow depth, (b) between mean annual dTSA and mean annual snow depth, and (c) between mean annual dTSA and mean annual snow cover duration. Each circle represents one site (averaged for all the years with data available).
Download figure:
Standard image High-resolution image
Figure 6. The distribution of mean TA with (a) mean annual snow depth, and (b) mean annual snow cover duration. Each circle represents one site (averaged for all the years with data available). The data are from 329 climate stations with TS observations in Russia and Canada.
Download figure:
Standard image High-resolution image
The year-to-year variation of annual dTSA is also positively correlated with snow depth and snow cover duration for most of the stations (table 3), indicating that snow condition has significant impacts on the temporal variation of annual dTSA. Annual mean snow depth and annual snow cover duration (from October 1st to September 30th in the following year) are also positively correlated to each other. Snow effects on the response of TS to changes in TA depend on the changes in snow conditions with TA (due to snowfall and snowmelt) and the consequent changes in dTSA. Annual snow depths and snow cover durations generally have negative correlations with annual TA, especially for snow cover durations (table 3) (except for some stations in Siberia and one station in northeast Canada where the correlations are positive). However, the strength of the correlations vary with biomes. In the arctic, the correlations between snow conditions (depth and duration) and annual TA are generally not statistically significant. The correlations are stronger (more negative) in the northern temperate than in boreal regions. However, annual dTSA is more sensitive (higher K-values) to changes in snow depth in boreal regions than in the northern temperate regions (table 3). This snow depth effect on dTSA probably is the main reason for the reduced response of annual TS to changes in TA in boreal regions.
Since the periods of observation are short, the temporal trends of dTSA and snow conditions are not significant for most of the stations. For stations with significant trends (p < 0.1) for both annual dTSA and snow conditions, the trends of annual dTSA are positively correlated with the trends of snow conditions (with winter mean snow depth: R = 0.865, N = 40 stations; with annual mean snow depth: R = 0.585, N = 46 stations; with annual snow cover duration: R = 0.669, N = 42 stations).
4. Discussion
The effects of snow on ground temperature (the surface offset) have been recognized in previous studies (Smith and Riseborough 2002, Zhang 2005, Palmer et al 2012). Several observation-based studies have assessed the differences between TS and TA and their temporal dynamics but only for limited sites and areas. Modelling studies can cover large areas, but their results vary widely due to model structure, resolutions and inputs (Lawrence and Slater 2010, Wang et al 2016). This study synthesizes a large number of observations across the northern high latitudes. The data show that there is a large offset between TS and TA in the low arctic and northern boreal regions across the circumpolar, but small offsets in the high arctic, southern boreal and northern temperate regions. In boreal regions, a thick and relatively long snow cover duration and its strong impacts on annual dTSA variation decouple TS and TA and dampen the response of TS to climate warming (increase in TA).
The results of this study agree qualitatively with previous observational analysis and modelling studies, which have shown that snow is the major factor differentiating mean TS from TA in permafrost regions (e.g. Smith and Riseborough 2002). The insulation effect of snow on annual TS is at least twice that of the shading and cooling effects of vegetation in summer (Matyshak et al 2015). When snow cover is thin or absent in winter, the annual mean dTSA can be very small (Lacelle et al 2016). Based on observations at ten sites across Canadian permafrost regions, Throop et al (2012) indicate that dTSA is the smallest in the arctic sites, and the largest in the boreal of the Mackenzie Valley. A modelling study by Lawrence and Slater (2010) shows that the warming of TS is less than that of TA for most of the northern high latitudes during 1950–2100. The ratio of the warming between TS and TA is smaller in the boreal than in the arctic and the northern temperate regions (figure 1(c) in Lawrence and Slater 2010).
Climate stations account for about half of the sites reported in this study. They are usually located in flat areas with short vegetation, which can be very different from natural conditions, especially in forest regions. In boreal regions, vegetation is denser and higher than in the arctic, organic layers and mosses are usually deep and wet, and ground ice is common in near surface permafrost. Thus, TS in natural boreal areas may be even lower and less responsive to changes in TA than measured at climate stations. On the other hand, arctic regions have low and sparse vegetation, and organic and mineral deposits are usually thin. Thus, the response of TS to changes in TA is likely to be direct and rapid (Throop et al 2012).
The results of this study are useful for understanding the current distribution of permafrost and its response to climate warming, for assessing the impacts of climate change on ecosystems and soil organic carbon, for improving models about snow effects on TS, and for reconstruction of historical climate based on ground temperature profiles at the northern high latitudes. For example, figure 2 and table 2 indicate that the increase of annual TS with time is smaller than that of TA in boreal regions. Thus, the warming and degradation of permafrost in boreal regions will be less than the estimates directly from TA. In contrast, near surface TS in arctic regions is highly responsive to changes in TA, therefore these regions can be very sensitive to climate warming. On the other hand, reconstructions of historical climate from deep ground temperature profiles would likely underestimate the changes in TA in boreal regions. For instance, the estimated warming of near-surface TS during 1950–2000 in Canada (Beltrami et al 2003) is smaller than that of TA observed at climate stations, especially in boreal regions (Vincent et al 2015, Zhang et al 2000).
Our results show the insulative effects of snow on TS at the circumpolar scale. The data also show strong site variations due to local and regional ground and climate conditions. Significant changes in snowfall could directly affect snow depth, thus altering dTSA and the response of TS to TA. Changes in soil and vegetation conditions due to fire disturbances and gradual responses to climate warming could also affect TS and its response to TA.
5. Conclusions
This study compiled TS and TA observations from 588 climate stations and boreholes across the northern high latitudes. This broad observational data coverage analyzed in this paper shows a large offset between mean TS and TA in the low arctic and northern boreal regions across the circumpolar north. The offset decreases both northward and southward. Thus, the north-south gradient of mean TS is about one and a half times of that of TA in the arctic, but only about two-thirds of TA in boreal regions. Further south, the spatial gradients of mean TS and TA are similar. This pattern is closely related to snow conditions. Thick and persistent snow cover and its strong impacts on annual dTSA in boreal regions weaken the coupling between annual TS and TA, and the response of annual TS to variation in annual TA is smaller in the boreal than in the arctic and the northern temperate regions. Consequently, the inter-annual variation and the trends of TS are smaller than that of TA in boreal regions. This systematic and significant differences in the relationship between TS and TA across the circumpolar north is important for understanding and assessing the impacts of climate change and for reconstruction of historical climate based on ground temperature profiles for the northern high latitudes.
Acknowledgements
The authors thank Steve Wolfe and Peter Morse for stimulating discussion and their careful review of the earlier versions of the paper. This study was funded by Polar Knowledge Canada Science and Technology Program (project 186). This study also contributes to a project affiliated to the Arctic Boreal Vulnerability Experiment (ABoVE), a NASA Terrestrial Ecology program.