Big Data visualization made simple using video infographics
Sruthi - April 13, 2016 - Leave your thoughts.
- It is estimated 2.5 quintillion bytes of data are created every day.
- Most of the US companies have at least 100 terabytes of data stored.
- The New York Stock Exchange captures 1 TB of trade information in every session.
- As of 2011, the global size of healthcare was 150 Exabytes.
Data has always existed amongst us. And, as we continue to stretch the boundaries of innovation in every single domain (From Airline to Writing instruments!) we will be extracting even more Big Data. (From such diverse sources such as mobile devices, systems, sensors and social media websites.)
However, data’s abeyant value is unlocked only when it is leveraged to drive decision making. These high volumes of fast-moving data must go through efficient processes to turn itself into meaningful insights.
The challenge here is to ensure the patterns and trends that is extracted out of data provides actionable intelligence for users.
A HR executive requires knowledge of employee demographics, talent mobility data and so on. A marketer needs marketing insights to invest in the appropriate promotional.A consumer would be happy to have the latest information on the coolest devices available.
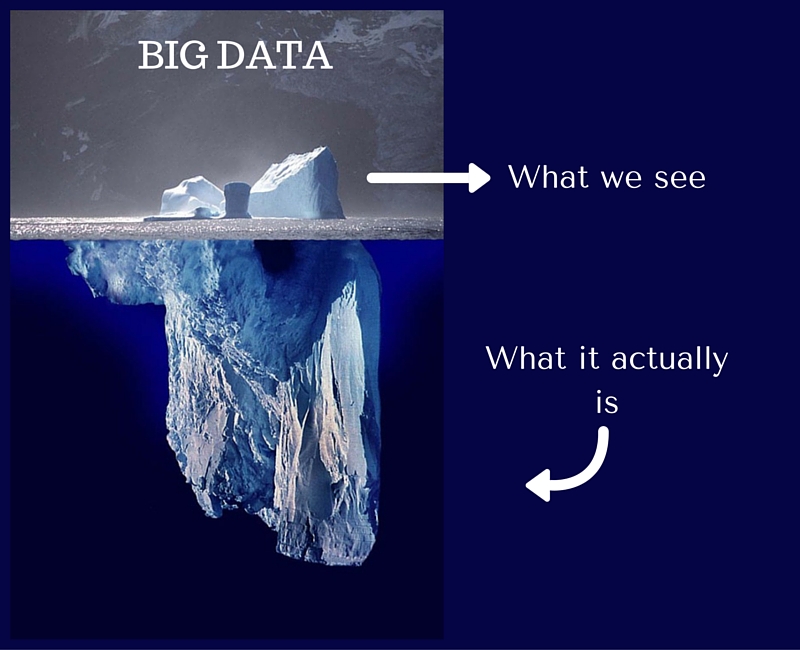
Even if you have the access to all the important data, the real struggle comes when you have to actually “convey” the data and its meaning to the concerned demographics. And, this is where data analytics and data visualisation comes in. Data visualization occurs when we filter this information, which is often complex and fragmented, into easily digestible snapshots.
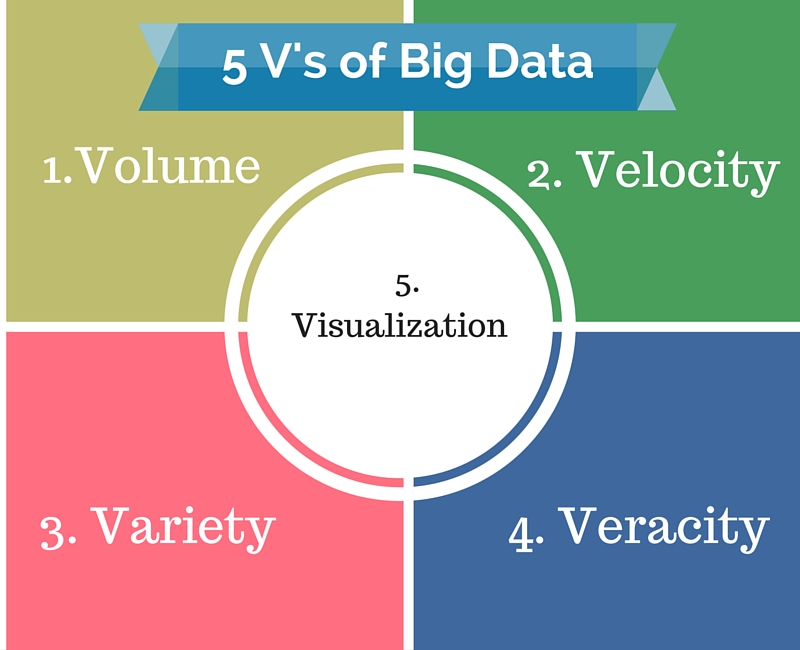
Data visualization has to be explanatory and exploratory. It is no more just 4v’s of big data. Adding “visualisation” to the list, it is now the 5vs of Big Data.
The journalist-cum-data-detective David McCandless, metaphorically emphasizes the beauty of data visualization. Here is an excerpt
(“Data is the new soil. Personally it feels like a fertile and creative medium. Over the years, huge amount of information and data have been stored online. We irrigate this data with networks and connectivity, and it’s been worked and tilled by unpaid workers and governments. But it’s a really fertile medium, and it feels like visualizations, infographics, and data visualizations, they feel like flowers blooming from this creative medium. I hope to see more evolution on the presentation of such data”)
When necessity dawned upon data visualization, graphs and charts came to the rescue. Ever since then, data visualization techniques have also been evolving. Infographics had been all over the internet now. As in for its popularity, infographics search volumes had shown an 800% increase between 2010 and 2012. This is suffice to show that it had worked to a certain extent. But, can there be a better alternative?
Video as an alternative
Attention spans have fallen from 12 seconds in 2008 to 8 seconds in 2015. In the age of instant gratification, diminished attention span is no surprise. People are now into choosing quick and easy ways to grasp information, irrespective of whether they would like to retain it in memory or not. It’s also because there’s a whole lot to choose from nowadays. Most of which isn’t something they may not be especially interested in.
Videos help address the issue of shrinking attention span. Interestingly, when watching a video, you have to give the video at least a few seconds of your time in order to determine that. This is the reason why videos are the most preferable media and a people’s choice of communication.
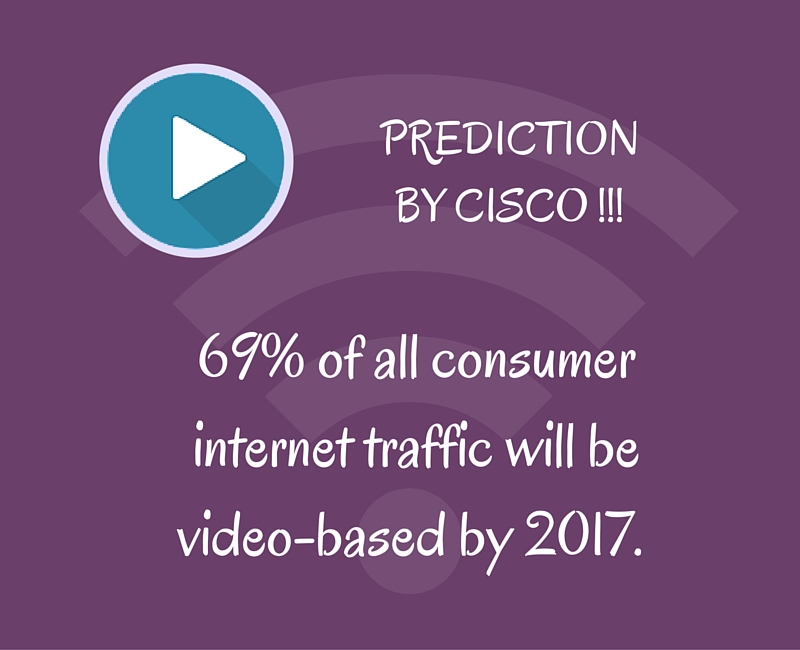
There is an explosion of video usage across the digital sphere; a startling fact reinforced by Cisco’s prediction is that 69% of all consumer internet traffic will be video-based by 2017.
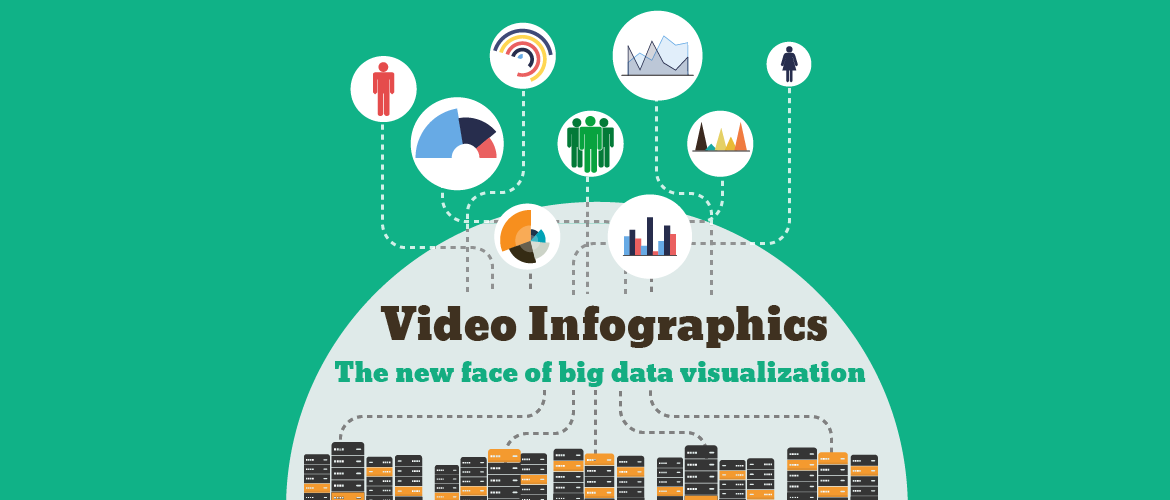
What are video infographics and why is it beneficial?
Video infographics is nothing but videos that are made using the data from the patterns and trends, graphs and charts.
Consumable: It is an obvious reason why filmmakers make movies out of best seller books. They know for a fact that the story was appreciated by a certain mass of a society and the part of the society that had not read the book can enjoy the story through a video format. This is because videos are the most accepted media of this era.
Retainable: Big data needs to be retained. Because, its purpose lies in analysing the insights and making important decisions. With moving charts and animated numbers, the viewers can easily grasp the transition between the numbers and concentrate on the figures. Infographics to a certain extent can only present the data, but video infographics can make you grasp, understand, identify, analyze and retain.
Tell a story: Video has a storytelling format unknowingly. It is a medium which can bring an emotional connection in the viewer's mind, lest comes engaging them. It builds a personal connection with the storyteller. Video infographics can tell a story with numbers. They can connect to the viewers on a deeper level and convey its purpose effectively.
They can drive the viewers on making the important decisions based on the big data. This is because it is not the rational side of the mind that takes decisions; it is the emotional side of the mind. When data and stories are combined, it drives the viewers to make decisions based on intellect as well as with emotion.
Ease of applicability: Anybody can use video infographics. From marketers, businessmen to storytellers to a common man, video infographics can be used by all.
How can video infographics are used in big data industry.
Video infographics as a tool leverages data visualisation and storytelling to present patterns and trends from Big Data analytics.
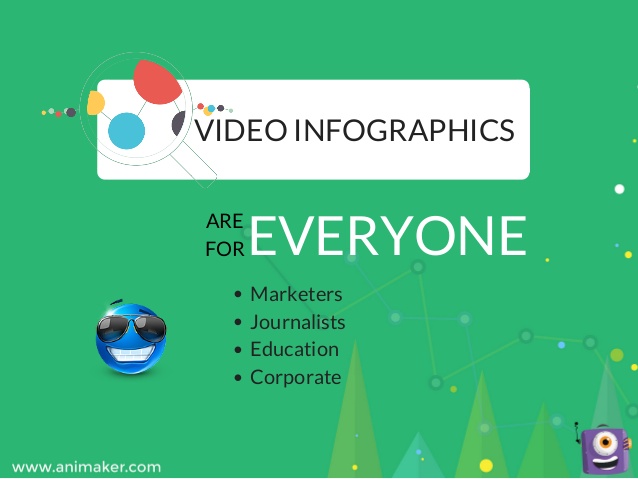
1. Marketers
Marketing is no more advertising as it used to be. This is because the customers have become technology savvy and smarter. To grab their attention, marketers need to convince them with the facts (big data). Big data is not about the statistics. There is a story within the numbers waiting to be told. Using video infographics, you could rivet their attention and convey the story behind the numbers in a creative way. Data visualisations using video infographics could accomplish the following:
2. Journalists:
Journalists are always on the lookout for data visualisation techniques. Because, they have a large amount of data to represent and to show, from weather reports, to census, inflation rate, to a presence of a tremor, or a death toll, or for political polls, everything involves statistics. With video infographics, journalists can obtain a handy tool to represent the data. Even to spread awareness on any issue, a video Infographic can easily illustrate data effortlessly to large masses in a language they can understand.
3. Educators:
“If history was taught in the form of stories, it would never have been forgotten”. Now, educators have an opportunity to make great stories out of their syllabus. Using video infographics, educators can teach students, the history of the civil war, the habitat, the states, the continents, its culture, the process, and the statistics in a way the students can understand. We have highlighted a few ways of using video infographics for various causes. Check it out.
Importance of water: How many of you would have overlooked the importance of water. Have you thought it as an inextinguishable resource? How carefully have you used it? This video can convey you the usage, abundance and uncovers some hidden facts about water.
Amazing food facts: How much cautious are you about your food habits? This video will give you some interesting facts about the food you consume.
The girl effect: This video educates the society about the problems faced by adolescent girls. How can you consider helping them?
Do you have any more ideas to use video infographics as a data visualisation in a far useful way? If so, please do share your ideas with us.
If you want to create an infographic video, check out this detailed article for your reference. Get started and tell your story using Animaker now!