Find a Job You Really Want In

Kids are a gift, but you know what? Some people don’t like gifts.
Children are incredibly difficult to have and expensive to raise, and the choice to have one should not be made lightly — and what’s more, the choice to not have one is increasingly being made more often than not.
Using PUMS data from the US Census Bureau, we looked at data for working women aged 45 or over who held jobs between 2011-2015 in order to see in which jobs women were least likely to have children. To get started, here are the top ten least likely:
- Optometrists
- Chemical Engineers
- Dentists
- Economists
- Physical Scientists, All Other
- Physicians And Surgeons
- Miscellaneous Engineers, Including Nuclear Engineers
- Physical Therapists
- Computer And Information Research Scientists
- Urban And Regional Planners
There are a number of factors that go into someone deciding whether or not to have children, and it should come as little surprise that jobs are one of the biggest considerations.
Comprehensive paid leave can be tough to find in the US, and the longer a person chooses to spend away from their job, caring for their child, is that much further away they might get from feeling satisfied with their career.
We’ve written before about why women who are in certain jobs are less likely than others to have children at a young age. But what about over the course a woman’s entire career? Are there certain jobs wherein women are just never going to have children at all, no matter their age?
The answer, as it turns out, is yes.
How We Determined The Careers Women Donât Have Children
Let’s start with the data itself. Here’s a graph showing in which industries women are least likely to have (or to have had) children after the age of 45:
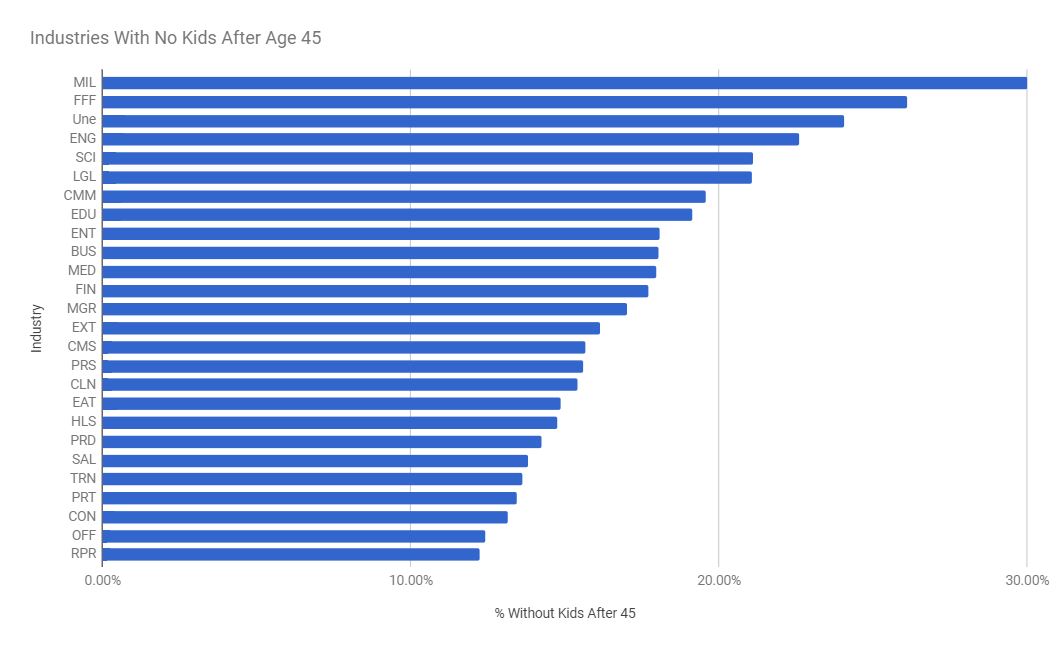
Military wins out over all others, which may a bit of a surprise to those in the field given the military’s high degree of marriage rates. The idea of starting a family is integral to the value system of the American military, and early-in-life marriages are often encouraged, leading to more opportunities for children — but from this chart, it’s pretty clear that those opportunities exist mostly for men in the industry, not for the women, who unlike the men are actually less likely to have children.
Other big industries without kids include forestry and agricultural workers, legal workers, and also STEM-based industries like science and engineering.
But that’s a look at these industries as a whole — the data tells a slightly different story when you look at individual careers within these industries.
The chart below — which you can also find at the top of the article — shows the individual jobs that most frequently have children after the age of 45:
Optometrists take the top spot here, followed closely by dentists, physical scientists, and engineers. In fact, despite the military’s overwhelming influence on the industry chart, it doesn’t show up on the jobs chart until number 9.
It seems clear from these charts that while the certain industries have lower likelihoods than others of women workers having children, those rates aren’t even across jobs in each industry — instead, it’s collected across a few different jobs in each industry.
Let’s do a quick breakdown of our top ten:
1. Optometrists
% Without Kids After 45: 47.37%
Optometry is a medical profession involving the study of and care for the human eye — while the field began primarily as a means of accurately prescribing corrective lenses, it’s grown to include detecting diseases and providing treatments such as the hilariously invasive and very sci-fi procedure known as laser eye surgery.
2. Chemical Engineers
% Without Kids After 45: 42.31%
An engineering branch focused on using scientific knowledge combined with applied mathematics in order to manipulate chemicals, Chemical Engineering is an excellent career fit for those who as children liked to touch things they weren’t supposed to.
3. Dentists
% Without Kids After 45: 37.50%
Dentists work to study teeth as well as diagnose and treat various mouth-related illnesses and are otherwise best known as the most terrifying variety of surgeon imaginable. It’s not your fault, dentists. Teeth are scary.
4. Economists
% Without Kids After 45: 34.85%
Economists study the field of economics, which seeks to observe and theorize on the ways that goods are produced and distributed, a field which absolutely must be more interesting than it sounds.
5. Physical Scientists, All Other
% Without Kids After 45: 34.29%
Physical science is the study of non-living systems, which can include everything from acids to crystals to nuclear energy and can even include the study of other planets.
6. Physicians And Surgeons
% Without Kids After 45: 34.27%
Physicians and Surgeons are both medical practitioners — physicians focus on studying and diagnosing illnesses and injuries in order to promote good health, while surgeons open up human bodies in order to alter, move, or remove pieces of said bodies.
7. Miscellaneous Engineers, Including Nuclear Engineers
% Without Kids After 45: 32.86%
This is the category for all those other engineers, the ones that don’t get as much attention as the more bigshot engineering disciplines. This includes engineers like Nuclear Engineers, Biological Engineers, Big Engineers, Small Engineers, Old-Timey Train Conductors, and of course also Structural Engineers.
8. Physical Therapists
% Without Kids After 45: 32.55%
Physical Therapists work to help patients who have been injured or gone through a medical procedure lessen their pain while also helping them get back some of their mobility over time.
9. Computer And Information Research Scientists
% Without Kids After 45: 32.14%
Another contender for the nerdiest career option on our list, Computer and Information Research Scientists think of innovative ways to make use of existing computer technologies as well as invent brand new technologies.
10. Urban And Regional Planners
% Without Kids After 45: 31.08%
Urban planning is used to develop and use land in a way that takes into account things like growth, infrastructure, and public welfare in order to ensure that the land is used responsibly and (more recently) sustainably.
Why These Jobs?
There’s something you might have noticed about a lot of these industries wherein women tend to have fewer children — for the most part, they’re science, technology, business, or military-based positions. These are all industries where men still have an overwhelming presence, both in the general population and in terms of industry leaders.
They’re STEM fields, in other words.

For those unaware, STEM is an acronym that stands for Science, Technology, Engineering, and Mathematics. The term itself is used mostly in the education field when it comes to talking about fields besides business or the humanities.
Historically, women have had very low numbers in these fields, mostly because they were simply not allowed to work in them outside of the last one or two hundred years. While women are breaking into these fields with greater and greater frequencies, these are still areas where progress has been markedly slow. But why might that have an effect on the likelihood of a woman in one of these industries having children?
We’re not scientists, but we have a few theories. Anne-Marie Slaughter wrote a now-famous article for the Atlantic called “Why Women Still Can’t Have It All.” Written in 2012, the article was extremely controversial when it came out.

The title alone accounted for much of this, but the article’s thesis was also troubling to many. Slaughter talked about the way that both men and women want to “have it all,” which she took to mean having an ability to have a fulfilling family and work life. It was distantly possible, Slaughter admitted, for women to have it all — but not at this point in history.
At the time, Slaughter argued that it was going to take a significant cultural shift in women’s favor in order to make “having it all” a real possibility for them. At one point, she writes that one way to do it might be in closing “the leadership gap,” “to elect a woman president and 50 women senators,” that this might be enough to start shifting society toward something wherein society genuinely works to improve the lives of women as well as men, rather than (as has historically been the case) just the men.
Slaughter has backtracked a little in recent years — Slaughter now believes that no one in the world can have it all, including men. There’s just too much that goes into the childcare process.
Paid Leave and Competition
So what specifically is getting in the way of women “having it all”? Slaughter points to a few of these in her own article, but there are a few other connections that might be drawn as well.
Many point to the proliferation of paid leave programs as being evidence of society getting better for women who want to both work and have children at the same time. But, as Slaughter also points out in her article, even the best possible version of this policy isn’t always enough.
Taking a heteronormative couple as the example, assuming that both a husband and wife are able to get paid family leave (which is not yet guaranteed by any national policy in the US), then the couple might be lucky enough to get 12 weeks of paid leave to take care of their child.
Ask any parent, new or not — three months is not a lot of time to spend with a child before returning to work, and there is evidence that an entire year would be significantly better when it comes to a parent bonding with their child.

STEM fields are also some of the most competitive in the world, particularly the ones related to the medical field. A massive amount of education is required just to break in, and once inside, the field takes long hours and huge commitment in order to be successful.
The point of all this is that, while it’s totally possible to have a child and work in a demanding field and balance both of these obligations perfectly, it’s an extremely difficult thing to do. And historically speaking, women have always gotten the shortest end of the stick in this regard — there are a lot of cultural expectations in place that can make staying in the workforce a daunting proposition.
So while it’s very likely that women today can in fact “have it all” in the sense that Anne-Marie Slaughter talked about, it’s also true that having it all comes with a lot of work and obligations. And there’s nothing wrong with having, or wanting, just a little bit less — what can be difficult is when it feels like that decision is being made for you.
Anyway, go science.
Here’s an extended chart of jobs with the lowest likelihoods of having children after the age of 45:
| Job Description | % Without Kids After 45 |
|---|---|
| MED-Optometrists | 47.37% |
| ENG-Chemical Engineers | 42.31% |
| MED-Dentists | 37.50% |
| SCI-Economists | 34.85% |
| SCI-Physical Scientists, All Other | 34.29% |
| MED-Physicians And Surgeons | 34.27% |
| ENG-Miscellaneous Engineers, Including Nuclear Engineers | 32.86% |
| MED-Physical Therapists | 32.55% |
| CMM-Computer And Information Research Scientists | 32.14% |
| SCI-Urban And Regional Planners | 31.08% |
| RPR-Bus And Truck Mechanics And Diesel Engine Specialists | 30.77% |
| MED-Veterinarians | 29.36% |
| BUS-Market Research Analysts And Marketing Specialists | 28.89% |
| MED-Occupational Therapists | 28.83% |
| MED-Pharmacists | 28.75% |
| LGL-Lawyers, And Judges, Magistrates, And Other Judicial | 28.71% |
| MIL-Military, Rank Not Specified ** | 28.57% |
| FFF-Miscellaneous Agricultural Workers, Including Animal | 27.56% |
| MGR-Natural Sciences Managers | 27.54% |
| PRT-Firefighters | 27.38% |
| LGL-Judicial Law Clerks | 27.27% |
| MED-Audiologists | 27.06% |
| MGR-Architectural And Engineering Managers | 26.56% |
| FFF-Graders And Sorters, Agricultural Products | 26.15% |
| ENG-Electrical And Electronics Engineers | 26.09% |
| SCI-Agricultural And Food Scientists | 26.00% |
| ENG-Mechanical Engineers | 25.83% |
| CMM-Actuaries | 25.64% |
| ENG-Industrial Engineers, Including Health And Safety | 25.62% |
| CMM-Miscellaneous Mathematical Science Occupations, | 25.37% |
| ENG-Civil Engineers | 25.32% |
| CMM-Software Developers, Applications And Systems Software | 25.19% |
| SCI-Medical Scientists, And Life Scientists, All Other | 25.05% |
| ENG-Computer Hardware Engineers | 25.00% |
| MGR-Marketing And Sales Managers | 24.80% |
| PRD-Chemical Processing Machine Setters, Operators, And | 24.39% |
| ENT-Photographers | 24.13% |
| CON-Pipelayers, Plumbers, Pipefitters, And Steamfitters | 24.07% |
| Unemployed And Last Worked 5 Years Ago Or Earlier Or Never | 24.06% |
| MED-Chiropractors | 24.04% |
| ENG-Architects, Except Naval | 24.02% |
| CMM-Web Developers | 23.86% |
| FFF-Forest And Conservation Workers | 23.81% |
| SAL-Securities, Commodities, And Financial Services Sales | 23.59% |
| FIN-Financial Analysts | 23.41% |
| MED-Dental Hygienists | 22.54% |
| EDU-Preschool And Kindergarten Teachers | 22.50% |
| RPR-Aircraft Mechanics And Service Technicians | 22.22% |
| ENT-Producers And Directors | 22.17% |
| SCI-Miscellaneous Social Scientists, Including Survey | 22.16% |
| PRS-Miscellaneous Personal Appearance Workers | 22.11% |
| SCI-Biological Scientists | 22.03% |
| TRN-Aircraft Pilots And Flight Engineers | 22.00% |
| FIN-Credit Analysts | 21.95% |
| ENG-Environmental Engineers | 21.95% |
| ENT-Writers And Authors | 21.82% |
| ENT-Miscellaneous Media And Communication Workers | 21.72% |
| BUS-Fundraisers | 21.70% |
| PRD-Extruding, Forming, Pressing, And Compacting Machine | 21.62% |
| MGR-Public Relations And Fundraising Managers | 21.60% |
| PRD-Adhesive Bonding Machine Operators And Tenders | 21.43% |
| PRD-Pressers, Textile, Garment, And Related Materials | 21.40% |
| CMS-Probation Officers And Correctional Treatment | 21.22% |
| MED-Other Healthcare Practitioners And Technical | 21.12% |
| ENT-News Analysts, Reporters And Correspondents | 20.98% |
| EDU-Secondary School Teachers | 20.92% |
| ENT-Announcers | 20.90% |
| FIN-Personal Financial Advisors | 20.85% |
| EDU-Teacher Assistants | 20.84% |
| BUS-Agents And Business Managers Of Artists, Performers, | 20.80% |
| ENT-Public Relations Specialists | 20.68% |
| SAL-Sales Representatives, Wholesale And Manufacturing | 20.59% |
| MED-Other Therapists, Including Exercise Physiologists | 20.48% |
| SCI-Environmental Scientists And Geoscientists | 20.44% |
| MED-Speech-Language Pathologists | 20.30% |
| TRN-Packers And Packagers, Hand | 20.21% |
| CMM-Computer Programmers | 20.18% |
| PRD-Miscellaneous Woodworkers, Including Model Makers And | 20.00% |
| FIN-Financial Specialists, All Other | 20.00% |
| PRS-Childcare Workers | 19.92% |
| EDU-Elementary And Middle School Teachers | 19.90% |
| MGR-Construction Managers | 19.82% |
| MGR-Computer And Information Systems Managers | 19.82% |
| TRN-Flight Attendants | 19.76% |
| ENT-Actors | 19.74% |
| SCI-Chemists And Materials Scientists | 19.64% |
| ENG-Aerospace Engineers | 19.64% |
| MED-Radiation Therapists | 19.51% |
| CMM-Computer Systems Analysts | 19.41% |
| CON-Construction And Building Inspectors | 19.32% |
| CMM-Computer Occupations, All Other | 19.29% |
| MED-Physician Assistants | 19.26% |
| RPR-Automotive Body And Related Repairers | 19.23% |
| BUS-Human Resources Workers | 19.20% |
| CON-Hazardous Materials Removal Workers | 19.15% |
| SCI-Biological Technicians | 19.12% |
| PRS-Recreation And Fitness Workers | 19.08% |
| FIN-Accountants And Auditors | 19.06% |
| HLS-Phlebotomists | 18.96% |
| BUS-Compliance Officers | 18.90% |
| OFF-Cargo And Freight Agents | 18.75% |
| MED-Dietitians And Nutritionists | 18.72% |
| EDU-Special Education Teachers | 18.67% |
| MGR-Advertising And Promotions Managers | 18.58% |
| PRD-Miscellaneous Plant And System Operators | 18.52% |
| PRS-First-Line Supervisors Of Personal Service Workers | 18.49% |
| HLS-Medical Assistants | 18.47% |
| BUS-Meeting, Convention, And Event Planners | 18.44% |
| PRD-Helpers-Production Workers | 18.42% |
| MED-Diagnostic Related Technologists And Technicians | 18.42% |
| PRS-First-Line Supervisors Of Gaming Workers | 18.24% |
| CMS-Directors, Religious Activities And Education | 18.18% |
| MGR-Financial Managers | 18.15% |
| ENT-Editors | 18.15% |
| MED-Nurse Practitioners, And Nurse Midwives | 18.07% |
| BUS-Management Analysts | 18.05% |
| RPR-Telecommunications Line Installers And Repairers | 18.03% |
| MGR-General And Operations Managers | 18.02% |
| ENT-Designers | 18.01% |
| OFF-Brokerage Clerks | 18.00% |
| PRT-Detectives And Criminal Investigators | 17.99% |
| PRT-Police Officers | 17.99% |
| BUS-Logisticians | 17.97% |
| PRD-Miscellaneous Textile, Apparel, And Furnishings | 17.89% |
| SAL-Sales Representatives, Services, All Other | 17.88% |
| HLS-Physical Therapist Assistants And Aides | 17.80% |
| PRD-Packaging And Filling Machine Operators And Tenders | 17.76% |
| PRD-Butchers And Other Meat, Poultry, And Fish Processing | 17.58% |
| MGR-Miscellaneous Managers, Including Funeral Service | 17.46% |
| MED-Miscellaneous Health Technologists And Technicians | 17.45% |
| SAL-First-Line Supervisors Of Non-Retail Sales Workers | 17.43% |
| PRD-Medical, Dental, And Ophthalmic Laboratory Technicians | 17.43% |
| CMS-Miscellaneous Community And Social Service Specialists, | 17.41% |
| CMS-Social Workers | 17.41% |
| SCI-Geological And Petroleum Technicians, And Nuclear | 17.39% |
| BUS-Wholesale And Retail Buyers, Except Farm Products | 17.39% |
| EAT-Miscellaneous Food Preparation And Serving Related | 17.36% |
| EDU-Postsecondary Teachers | 17.23% |
| MGR-Education Administrators | 17.22% |
| HLS-Dental Assistants | 17.19% |
| SAL-Door-To-Door Sales Workers, News And Street Vendors, | 17.17% |
| SAL-Advertising Sales Agents | 17.13% |
| EAT-Food Preparation Workers | 16.98% |
| OFF-Financial Clerks, All Other | 16.92% |
| PRD-Jewelers And Precious Stone And Metal Workers | 16.90% |
| BUS-Claims Adjusters, Appraisers, Examiners, And | 16.85% |
| EAT-Chefs And Head Cooks | 16.81% |
| MGR-Compensation And Benefits Managers | 16.81% |
| ENG-Drafters | 16.74% |
| PRT-First_Line Supervisors Of Fire Fighting And Prevention | 16.67% |
| SCI-Psychologists | 16.53% |
| PRT-Private Detectives And Investigators | 16.53% |
| CLN-Maids And Housekeeping Cleaners | 16.49% |
| MED-Clinical Laboratory Technologists And Technicians | 16.48% |
| CMM-Computer Network Architects | 16.42% |
| PRD-Food Batchmakers | 16.41% |
| MED-Registered Nurses | 16.32% |
| CON-First-Line Supervisors Of Construction Trades And | 16.29% |
| MGR-Chief Executives And Legislators | 16.28% |
| PRT-Miscellaneous Law Enforcement Workers | 16.22% |
| MED-Nurse Anesthetists | 16.22% |
| CMM-Operations Research Analysts | 16.18% |
| SAL-Insurance Sales Agents | 16.11% |
| ENG-Engineering Technicians, Except Drafters | 16.04% |
| PRD-Furniture Finishers | 16.00% |
| TRN-Miscellaneous Transportation Workers, Including Bridge | 16.00% |
| BUS-Business Operations Specialists, All Other | 15.97% |
| CMM-Network And Computer Systems Administrators | 15.96% |
| MGR-Medical And Health Services Managers | 15.92% |
| LGL-Paralegals And Legal Assistants | 15.91% |
| BUS-Compensation, Benefits, And Job Analysis Specialists | 15.82% |
| SCI-Miscellaneous Life, Physical, And Social Science | 15.79% |
| PRD-Bakers | 15.78% |
| EAT-First_Line Supervisors Of Food Preparation And Serving | 15.74% |
| MGR-Human Resources Managers | 15.73% |
| ENT-Television, Video, And Motion Picture Camera Operators | 15.69% |
| EDU-Other Education, Training, And Library Workers | 15.67% |
| MGR-Industrial Production Managers | 15.65% |
| ENG-Materials Engineers | 15.63% |
| RPR-Computer, Automated Teller, And Office Machine Repairers | 15.63% |
| MGR-Food Service Managers | 15.62% |
| PRT-First-Line Supervisors Of Correctional Officers | 15.56% |
| MED-Opticians, Dispensing | 15.52% |
| MGR-Training And Development Managers | 15.47% |
| FIN-Credit Counselors And Loan Officers | 15.44% |
| PRD-Food Processing Workers, All Other | 15.43% |
| SAL-Sales And Related Workers, All Other | 15.33% |
| EAT-Waiters And Waitresses | 15.33% |
| MED-Health Practitioner Support Technologists And | 15.30% |
| MED-Respiratory Therapists | 15.25% |
| OFF-Procurement Clerks | 15.14% |
| PRT-Bailiffs, Correctional Officers, And Jailers | 15.13% |
| ENT-Technical Writers | 15.12% |
| EAT-Dishwashers | 15.09% |
| EDU-Archivists, Curators, And Museum Technicians | 15.09% |
| PRD-Electrical, Electronics, And Electromechanical | 15.08% |
| OFF-Weighers, Measurers, Checkers, And Samplers, | 15.02% |
| MGR-Administrative Services Managers | 14.97% |
| PRS-Gaming Services Workers | 14.96% |
| PRD-Laundry And Dry-Cleaning Workers | 14.93% |
| MGR-Social And Community Service Managers | 14.91% |
| FFF-First-Line Supervisors Of Farming, Fishing, And Forestry | 14.89% |
| CMS-Counselors | 14.87% |
| FIN-Insurance Underwriters | 14.87% |
| HLS-Occupational Therapy Assistants And Aides | 14.77% |
| OFF-Customer Service Representatives | 14.77% |
| EDU-Other Teachers And Instructors | 14.77% |
| ENT-Athletes, Coaches, Umpires, And Related Workers | 14.74% |
| ENT-Artists And Related Workers | 14.66% |
| PRD-Miscellaneous Production Workers, Including Semiconductor | 14.58% |
| OFF-Billing And Posting Clerks | 14.57% |
| EAT-Cooks | 14.57% |
| OFF-Loan Interviewers And Clerks | 14.55% |
| PRT-First_Line Supervisors Of Police And Detectives | 14.52% |
| TRN-Parking Lot Attendants | 14.49% |
| PRS-Hairdressers, Hairstylists, And Cosmetologists | 14.47% |
| MGR-Transportation, Storage, And Distribution Managers | 14.46% |
| OFF-Human Resources Assistants, Except Payroll And | 14.45% |
| MED-Emergency Medical Technicians And Paramedics | 14.44% |
| PRD-Sewing Machine Operators | 14.44% |
| CMM-Computer Support Specialists | 14.43% |
| CLN-First-Line Supervisors Of Landscaping, Lawn Service, And | 14.41% |
| OFF-Insurance Claims And Policy Processing Clerks | 14.35% |
| CON-Construction Equipment Operators, Except Paving, | 14.29% |
| RPR-First-Line Supervisors Of Mechanics, Installers, And | 14.29% |
| TRN-Industrial Truck And Tractor Operators | 14.23% |
| MGR-Purchasing Managers | 14.23% |
| CMS-Social And Human Service Assistants | 14.21% |
| CLN-Janitors And Building Cleaners | 14.15% |
| OFF-Shipping, Receiving, And Traffic Clerks | 14.13% |
| TRN-Supervisors Of Transportation And Material Moving | 14.10% |
| PRD-Inspectors, Testers, Sorters, Samplers, And Weighers | 14.09% |
| SAL-Real Estate Brokers And Sales Agents | 13.95% |
| PRD-Miscellaneous Assemblers And Fabricators | 13.94% |
| SCI-Chemical Technicians | 13.93% |
| HLS-Nursing, Psychiatric, And Home Health Aides | 13.91% |
| HLS-Medical Transcriptionists | 13.82% |
| SAL-First-Line Supervisors Of Retail Sales Workers | 13.81% |
| EAT-Combined Food Preparation And Serving Workers, | 13.80% |
| TRN-Air Traffic Controllers And Airfield Operations | 13.73% |
| PRD-Computer Control Programmers And Operators | 13.64% |
| CMM-Database Administrators | 13.61% |
| OFF-Proofreaders And Copy Markers | 13.59% |
| BUS-Cost Estimators | 13.56% |
| OFF-Reservation And Transportation Ticket Agents And Travel | 13.55% |
| OFF-First-Line Supervisors Of Office And Administrative | 13.50% |
| OFF-Data Entry Keyers | 13.47% |
| OFF-Computer Operators | 13.46% |
| HLS-Massage Therapists | 13.42% |
| MGR-Lodging Managers | 13.40% |
| CLN-Grounds Maintenance Workers | 13.36% |
| LGL-Miscellaneous Legal Support Workers | 13.36% |
| OFF-Meter Readers, Utilities | 13.33% |
| OFF-Correspondence Clerks And Order Clerks | 13.29% |
| PRD-Miscellaneous Metal Workers And Plastic Workers, Including | 13.27% |
| OFF-Stock Clerks And Order Fillers | 13.23% |
| OFF-Production, Planning, And Expediting Clerks | 13.22% |
| MGR-Property, Real Estate, And Community Association | 13.21% |
| CMM-Information Security Analysts | 13.13% |
| PRD-Sawing Machine Setters, Operators, And Tenders, Wood | 13.04% |
| EDU-Library Technicians | 13.01% |
| PRS-Barbers | 12.97% |
| OFF-Postal Service Mail Sorters, Processors, And Processing | 12.94% |
| OFF-Postal Service Mail Carriers | 12.94% |
| CLN-First-Line Supervisors Of Housekeeping And Janitorial | 12.90% |
| PRD-Molders, Shapers, And Casters, Except Metal And Plastic | 12.90% |
| EAT-Food Servers, Nonrestaurant | 12.88% |
| TRN-Cleaners Of Vehicles And Equipment | 12.84% |
| SAL-Telemarketers | 12.83% |
| TRN-Miscellaneous Material Moving Workers, Including | 12.82% |
| MED-Recreational Therapists | 12.82% |
| OFF-Statistical Assistants | 12.82% |
| PRD-Printing Press Operators | 12.79% |
| FIN-Appraisers And Assessors Of Real Estate | 12.77% |
| OFF-Miscellaneous Office And Administrative Support | 12.75% |
| PRD-Upholsterers | 12.66% |
| OFF-Bookkeeping, Accounting, And Auditing Clerks | 12.63% |
| PRS-Personal Care Aides | 12.56% |
| OFF-Office Clerks, General | 12.56% |
| OFF-Couriers And Messengers | 12.53% |
| CLN-Pest Control Workers | 12.50% |
| OFF-Credit Authorizers, Checkers, And Clerks | 12.50% |
| PRD-Shoe And Leather Workers | 12.50% |
| RPR-Coin, Vending, And Amusement Machine Servicers And | 12.50% |
| CON-Construction Laborers | 12.44% |
| MED-Medical Records And Health Information Technicians | 12.39% |
| BUS-Purchasing Agents, Except Wholesale, Retail, And Farm | 12.35% |
| OFF-Eligibility Interviewers, Government Programs | 12.35% |
| PRD-First-Line Supervisors Of Production And Operating | 12.27% |
| OFF-Payroll And Timekeeping Clerks | 12.25% |
| HLS-Veterinary Assistants And Laboratory Animal Caretakers | 12.24% |
| PRS-Personal Care And Service Workers, All Other | 12.22% |
| HLS-Healthcare Support Workers, All Other, Including | 12.19% |
| BUS-Training And Development Specialists | 12.16% |
| OFF-Office Machine Operators, Except Computer | 12.15% |
| HLS-Pharmacy Aides | 12.14% |
| SAL-Retail Salespersons | 12.11% |
| OFF-Library Assistants, Clerical | 12.04% |
| TRN-Bus Drivers | 12.03% |
| PRD-Food Cooking Machine Operators And Tenders | 12.00% |
| PRS-Nonfarm Animal Caretakers | 11.96% |
| EAT-Counter Attendants, Cafeteria, Food Concession, And | 11.96% |
| PRD-Machine Tool Cutting Setters, Operators, And Tenders, Metal | 11.92% |
| PRD-Cutting Workers | 11.80% |
| RPR-Automotive Service Technicians And Mechanics | 11.76% |
| EDU-Librarians | 11.76% |
| OFF-Word Processors And Typists | 11.71% |
| OFF-Information And Record Clerks, All Other | 11.71% |
| ENT-Broadcast And Sound Engineering Technicians And Radio | 11.69% |
| PRD-Tailors, Dressmakers, And Sewers | 11.67% |
| OFF-Postal Service Clerks | 11.67% |
| PRD-Painting Workers | 11.57% |
| PRT-Security Guards And Gaming Surveillance Officers | 11.56% |
| PRT-Fire Inspectors | 11.54% |
| MED-Licensed Practical And Licensed Vocational Nurses | 11.52% |
| TRN-Transportation Attendants, Except Flight Attendants | 11.50% |
| CON-Painters And Paperhangers | 11.50% |
| SAL-Cashiers | 11.49% |
| OFF-Secretaries And Administrative Assistants | 11.49% |
| OFF-Court, Municipal, And License Clerks | 11.49% |
| PRD-Crushing, Grinding, Polishing, Mixing, And Blending | 11.48% |
| TRN-Laborers And Freight, Stock, And Material Movers, Hand | 11.40% |
| ENT-Entertainers And Performers, Sports And Related | 11.33% |
| OFF-Mail Clerks And Mail Machine Operators, Except Postal | 11.31% |
| MGR-Farmers, Ranchers, And Other Agricultural Managers | 11.29% |
| ENT-Musicians, Singers, And Related Workers | 11.28% |
| PRT-First-Line Supervisors Of Protective Service Workers, | 11.28% |
| OFF-File Clerks | 11.24% |
| OFF-Tellers | 11.11% |
| CMS-Clergy | 11.00% |
| OFF-Interviewers, Except Eligibility And Loan | 10.99% |
| TRN-Taxi Drivers And Chauffeurs | 10.98% |
| PRS-Residential Advisors | 10.94% |
| SAL-Travel Agents | 10.91% |
| SCI-Agricultural And Food Science Technicians | 10.89% |
| CMS-Religious Workers, All Other | 10.79% |
| FIN-Budget Analysts | 10.75% |
| SCI-Conservation Scientists And Foresters | 10.71% |
| FFF-Agricultural Inspectors | 10.64% |
| OFF-Bill And Account Collectors | 10.61% |
| RPR-Precision Instrument And Equipment Repairers | 10.61% |
| CON-Carpenters | 10.57% |
| TRN-Transportation Inspectors | 10.53% |
| FIN-Financial Examiners | 10.53% |
| EAT-Bartenders | 10.51% |
| RPR-Industrial And Refractory Machinery Mechanics | 10.48% |
| ENG-Surveying And Mapping Technicians | 10.45% |
| FIN-Tax Preparers | 10.44% |
| PRS-Animal Trainers | 10.44% |
| RPR-Maintenance And Repair Workers, General | 10.37% |
| MGR-Emergency Management Directors | 10.34% |
| PRD-Textile Winding, Twisting, And Drawing Out Machine | 10.34% |
| PRD-Welding, Soldering, And Brazing Workers | 10.28% |
| PRD-Photographic Process Workers And Processing Machine | 10.22% |
| ENG-Surveyors, Cartographers, And Photogrammetrists | 10.17% |
| PRD-Prepress Technicians And Workers | 10.12% |
| OFF-Receptionists And Information Clerks | 10.05% |
| FIN-Tax Examiners And Collectors, And Revenue Agents | 10.00% |
| MED-Health Diagnosing And Treating Practitioners, All Other | 9.76% |
| TRN-Driver Sales Workers And Truck Drivers | 9.66% |
| OFF-Dispatchers | 9.54% |
| OFF-Hotel, Motel, And Resort Desk Clerks | 9.47% |
| SAL-Counter And Rental Clerks | 9.29% |
| PRS-Miscellaneous Entertainment Attendants And Related | 9.23% |
| PRD-Machinists | 9.17% |
| PRT-Transportation Security Screeners | 9.09% |
| PRD-Model Makers, Patternmakers, And Molding Machine Setters, | 8.96% |
| PRT-Crossing Guards | 8.71% |
| OFF-New Accounts Clerks | 8.60% |
| PRD-Water And Wastewater Treatment Plant And System | 8.57% |
| CON-Electricians | 8.54% |
| OFF-Communications Equipment Operators, All Other | 8.33% |
| PRD-Paper Goods Machine Setters, Operators, And Tenders | 8.33% |
| TRN-Refuse And Recyclable Material Collectors | 8.33% |
| PRD-Stationary Engineers And Boiler Operators | 8.33% |
| PRS-Morticians, Undertakers, And Funeral Directors | 8.33% |
| PRT-Lifeguards And Other Recreational, And All Other | 8.26% |
| TRN-Motor Vehicle Operators, All Other | 8.14% |
| PRS-Baggage Porters, Bellhops, And Concierges | 8.00% |
| OFF-Telephone Operators | 7.82% |
| EAT-Hosts And Hostesses, Restaurant, Lounge, And Coffee Shop | 7.63% |
| CON-Drywall Installers, Ceiling Tile Installers, And Tapers | 7.41% |
| PRD-Print Binding And Finishing Workers | 7.37% |
| SAL-Parts Salespersons | 7.32% |
| RPR-Miscellaneous Installation, Maintenance, And Repair | 7.28% |
| MGR-Gaming Managers | 7.14% |
| PRS-Ushers, Lobby Attendants, And Ticket Takers | 6.92% |
| PRS-Tour And Travel Guides | 6.86% |
| PRD-Etchers And Engravers | 6.67% |
| TRN-Machine Feeders And Offbearers | 6.45% |
| TRN-Automotive And Watercraft Service Attendants | 6.45% |
| PRD-Textile Knitting And Weaving Machine Setters, | 6.25% |
| PRS-Embalmers And Funeral Attendants | 6.25% |
| SAL-Models, Demonstrators, And Product Promoters | 6.20% |
| RPR-Radio And Telecommunications Equipment Installers And | 5.33% |
| CON-Sheet Metal Workers | 4.55% |
| TRN-Locomotive Engineers And Operators | 4.55% |
| PRD-Power Plant Operators, Distributors, And Dispatchers | 4.55% |
| PRD-Textile Bleaching And Dyeing, And Cutting Machine | 4.35% |
| ENT-Dancers And Choreographers | 3.85% |
| RPR-Heating, Air Conditioning, And Refrigeration Mechanics | 3.70% |
| PRD-Woodworking Machine Setters, Operators, And Tenders, | 3.57% |
| OFF-Switchboard Operators, Including Answering Service | 3.42% |
| PRD-Extruding And Drawing Machine Setters, Operators, And | 0.00% |
| PRT-Animal Control Workers | 0.00% |
| FFF-Fishing And Hunting Workers | 0.00% |
| OFF-Gaming Cage Workers | 0.00% |
Author
Ryan Morris was a writer for the Zippia Advice blog who tried to make the job process a little more entertaining for all those involved. He obtained his BA and Masters from Appalachian State University.