


Are you struggling to create Instagram reports for your clients?
Without a clear strategy and specific tools, this can be unbelievably hard sometimes.
This article will show you a step-by-step guide on how to design Instagram reports for your clients and what insights you need to include.
I've also included a free Instagram report template to help you save time and a lot of energy.
Let's start!
Instagram analytics data and reports
- Define social media KPIs
- Prioritize Instagram KPIs
- Choose the right Instagram metrics for your report
- Add a detailed competitors audit
- Include actionable insights
1. What is an Instagram analytics report?
An Instagram analytics report is an overview of how your Instagram account is performing and how successful your current content strategy is in achieving your social media objectives.
Creating comprehensive Instagram reports sits among the top-priority tasks for social media managers, according to our study.

A comprehensive Instagram analysis can be very helpful for winning pitches and expanding your client’s portfolio or keeping current clients in the loop with the results of your work and the gains achieved for them.
Consequently, Instagram analytics reports are a powerful marketing resource for brands doing Instagram marketing.
Instagram analytics reports are equally useful to help brands identify their most successful campaigns and influencer partnerships.
Ultimately, these insights can greatly contribute to creating a more consolidated strategy in the future.
While putting together an Instagram analytics report is time and energy-consuming, you can always rely on a third-party social media analytics app to give you a hand with all the data gathering.
Socialinsider, for example, is a social media analytics tool that offers pitch-ready Instagram reports with just a few clicks.
2. How to create an Instagram analytics report?
To create comprehensive analytics reports for Instagram, you first need to decide which metrics to track and highlight in your reporting. You can start by defining your social media KPIs, prioritizing them, then selecting the most relevant metrics for any particular client or scenario.
Define social media KPIs
Definining social media KPIs help brands and individuals understand how well their campaigns or social media posts perform and whether they might need to change their strategy or not.
Before starting doing your social media report, think of the KPIs for the profiles you manage on behalf of your clients.
Instagram KPIs help you measure how effective a business is in achieving its set objectives on Instagram. It helps you know whether you are taking your client in the right direction.
Prioritize Instagram KPIs
-
Engagement
If you want to boost your client's engagement on Instagram, you must know when and what to post.
For instance, if you post when most of your target followers are not active, you will get less engagement.
You need to know when your target audiences are active and post at that particular time.
Here are some actionable insights to help you increase engagement on Instagram:
- Post up to 5 stories per day - this ensures a retention rate of over 70%.
- Use Instagram Reels - this post type generates an average engagement rate of 1.23%,which is at least double compared to the other post types
- Engage with your community - when someone leaves you a comment, make sure you take your time and respond to them.
- Go live - people get notified when your brand is live on Instagram, giving you more exposure.
-
Lead generation
One of the main goals of marketing a company on Instagram is to boost your lead generation.
The quality of leads you are generating will show you if your marketing strategies are working or there's something that you need to change.
If you employ the right marketing techniques, then more people will click the link to your website and take the action that you ask them to.
If you want to get more leads on Instagram, then you must focus your efforts on creating engaging content for your current and future followers.
You also need to include a compelling call to action that will make people further engage with your content , such as:
- link in bio
- check the link in bio
- comment below
- save this post for later
- etc.
Remember, now you can include up to 5 links in your Instagram bio, so take full advantage of this feature to direct your customers towards key pages on your website.

-
Sales generation
Leads that don't translate to sales are not useful. Sales generation is significant, especially if your client's Instagram account promotes products.
Remember that every month 130 million Instagram accounts tap on a shopping post to learn more about products.
With features like the checkout, users can buy a product they like without leaving the app.
Make sure you encourage your audience to explore your products by posting high-quality and engaging content, responding to everything, including a call to action, sharing Instagram stories, among many others.

-
Brand awareness
One of the most effective ways to increase brand awareness is by using branded hashtags.
Not only do Instagram posts with branded hashtags get more engagement, but they also make your post more discoverable.
Hashtags on Instagram can be compared to keywords on search engine optimization.
Now let's discover the most critical metrics you need to track every month, and include in your Instagram reports.
Choose the right Instagram metrics for your report
Once you have the KPIs established, dive deeper and add these Instagram metrics when you start the social media reporting process for your clients:
-
Engagement rate by followers
The engagement rate by followers measures the number of people who have engaged with your posts.
Average engagement rate per post by followers is calculated as percentage of the sum the number of likes and comments that your post has received, divided by number of posts for a specific time range, all divided by number of followers.

Engagement rate from a single post can help you determine what your followers prefer and things they don't.
This is very important because it will help you change your strategies and only post the content your audience can relate to and engage with most.
-
Engagement rate by reach
Another important metric is engagement rate by reach.
Average engagement rate per post by reach is calculated as percentage of sum of all your likes and comments divided by number of posts, all divided by reach.
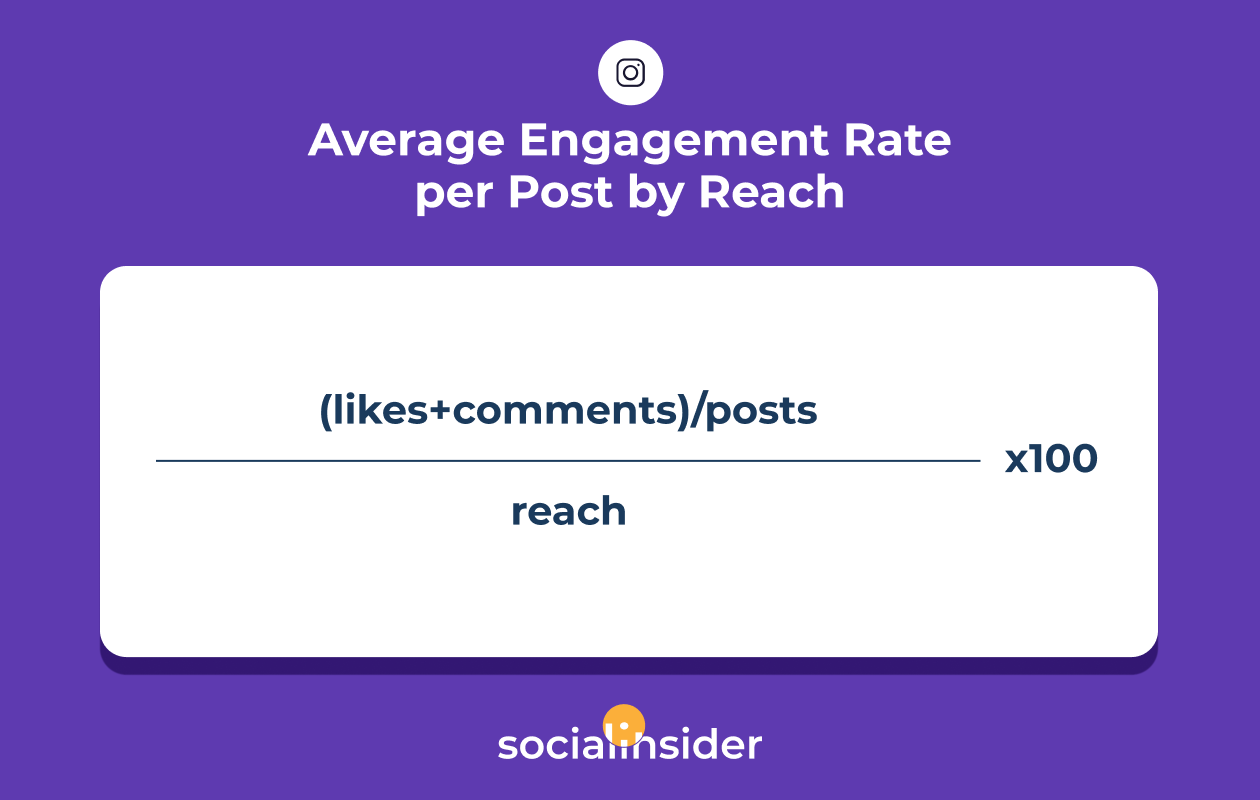
It is essential to calculate these two metrics to know how your client's account is performing.
This way, you will also gain insights that you'll need to implement to improve the engagement rate and engagement on reach.
-
Instagram impressions
The impressions metric refers to the number of times your posts/Stories/profile has been viewed during a selected period.
For example: if one person has seen your post 10 times, this will be counted as 1 reach and 10 impressions.
In Socialinsider, you can see how many impressions (organic & paid) your posts are generating, but you can also track the evolution of your Reels impressions:

-
Instagram reach
Reach metric measures the percentage of your followers who have viewed your content.
Reach is different from impressions because it only counts the unique number of users who have seen your content.
For instance, if one user has seen your content five times, then it will only count as one as opposed to the impression, which will count as five.
Using an analytics tool like Socialinsider, you can see which Instagram post types have the highest reach:

-
Average reach rate per post
The average reach rate per post represents the average reach rate of ALL your posts published in a selected time period.
It is calculated as a percentage of number of unique accounts that have seen your postings divided by the number of followers for a specific time range.
-
Instagram followers growth
The number of followers that your clients have determines how frequently your content appears on the user's feed section.
If you have more followers, then it means that your content is appearing more on the user's feeds.
The number of followers also determines the impact that your client's brand has on Instagram users.
If you have more followers, then it means that your brand positively impacts many Instagram users. Slow follower growth means that you need to go back to the drawing board and re-strategize.
It is important to mention here that the Instagram native app doesn’t give you this metric, but using Socialinsider, you'll see a chart showing you one of the most useful metrics for your strategy.
If the number of your followers is increasing, this means you are doing a great job.

-
Saves on Instagram
Saves are the number of saves that your post has gathered.
This metric is important because if someone saved your post, it means they found that information useful for them and they are likely to return to it at a later date, or even share it with others.
If the number of saves is high, keep up the great job, but if you have no saves - change something in your strategy.

If you look at the above photos, you'll see that one of my posts got one save and the other 30.
Also, more people visited yours profile after seeing this photo, engaged with it, and clicked the link on your website.
To know exactly which posts are generating the highest number of saves, you can sort your Posts lists in Socialinsider:

-
Top performing posts on Instagram
Measuring the most engaging posts helps you determine which posts are performing well on Instagram.
You can see which ones are performing by using the Instagram insights native app:
If you wish to take a look at more aggregated data, you can try a third-party social media analytics tool like Socialinsider, to see which are your best-performing posts overall.

-
Website clicks
Website taps are the number of taps on the website in your Instagram profile.
You can find this metric directly from the native app.

-
Story reach rate on Instagram
Just as its name suggests, story views measure the number of people who have viewed your stories on Instagram.
This metric will give you an insight into how users interact with the Instagram Stories you post on your client's Instagram account.
If there are fewer views and engagement, then it means that most users are not resonating well with your stories.
More views, on the other hand, means that most users are relating well with your Stories.
The information that you get from this metric can help you make necessary changes in your stories to improve user engagement.
The story reach metric is computed as a percentage by dividing the Stories' viewers by the total number of followers.
In Socialinsider, you can easily see how your peak reach for Stories fluctuates from one day to the next:

You can corelate this data with what type of content you posted that day and find out what resonates best with your audience.
-
Story exits on Instagram
This metric shows how many people left your Story without watching it to the end.
Exits happen when:
- Users closed Instagram while viewing your Story.
- Users have clicked on the X on the top-right corner of your Story.
- Users have swiped down returning on the feed.
Include a detailed competitors audit
Competitors audit is a concept that helps to identify and evaluate your competitors' strategies to determine their strengths and weaknesses and compare them to the methods that you use.
This is something every client wants to see in their social media report.
If you want to take your clients' Instagram marketing plan to another level, it is crucial to conduct a competitor’s analysis.
It will help you know where your competitors are at the moment and what strategies they are using.
Here are four steps on how to do a competitors audit on Instagram:
1. Analyze your competitors' profiles
Crucial things to consider when analyzing your competitor’s followers for your social media reporting include the number of followers they have, how their profile picture looks, the strategies they are using to market their business, and what they have written in their bio.
By analyzing your competitors' social media profiles, you will know their marketing strategies and what you need to do to outshine them.
2. Describe their profile, theme, bio, and CTA used
Carefully analyze your competitor's profile, bio, theme, and CTAs used and compare them with what you have for your client.

3. Analyze your competitors' content strategy
Consider analyzing your competitors' content strategy, including how they write and the type of content they post.
Analyze if they are using more video content, or maybe they are posting only images. Are they using Instagram Stories?
Answer all these questions and take a look at their engagement.
If their content has a high engagement rate, then it means that their writing style is appealing to users.
To have a quick but insightful look at your competitors and see how you stack up to them, you can use the Benchmarks feature in Socialinsider:


4. Identify the influencers your competitors are working with
Influencers play a significant role in determining the success of a business on Instagram. Take your time to determine the influencer that your competitors are working with and their impact on their business.
Include actionable insights
Your Instagram report will not be complete without actionable insights.
Collecting data is very important but is not enough. Data without insight is worthless.
If you want to ensure that the job is well done for your client, you need to assign meaning to the collected data, and that is where actionable insight comes in.
Actionable insights help to drive change and influence future decision-making.
Insights work as a blueprint and describe what should be done and how it should be done to achieve success.

As a social media manager, you need to add some actionable insights based on KPI and actions.
This should be featured in your reports. Here are some examples:
- If you want to increase your page followers, you should to post more carousels.
- If you want your followers to interact with your brand, you should start creating Instagram Stories.
- Set up to go live on Instagram once a month for creating a connection with your audience.
- Make sure you use all Instagram features available in [current year].
3. Choose an easy-to-understand Instagram analytics report structure
When creating your Instagram insights reports, it’s very important to include all the relevant KPIs that can help you improve your brand’s content strategy and social performance in the future.
The more detailed your Instagram performance report is, the better.
However, keep in mind there will be situations when you’ll have to present these performance reports to your clients.
Therefore, it’s imperative to keep them logical and on point.
Following a certain structure, going from more general Instagram account performance insights to audience demographics data and individual post performance stats may prove to be the most successful frame there is.
That’s because it will offer your clients the context needed to understand the data more deeply.
-
Begin with account performance data
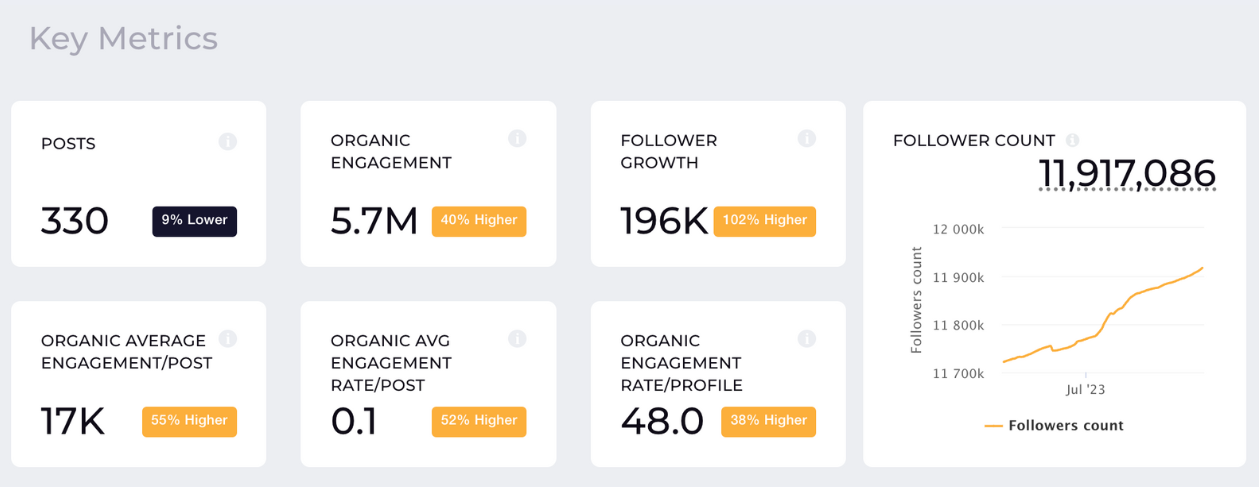
When doing your Instagram analytics reports, it’s recommended to display KPIs like followers growth and engagement rate at the beginning of your analysis.
Starting your Instagram insights reports with an overview of your Instagram account’s data is indicated as it offers a general idea of whether or not your profile faced major changes in performance within a selected timeframe.
The key metrics section in your Socialinsider Instagram dashboard should be a great starting place for this:
-
Continue with audience demographics insights
After discovering how your Instagram account performs overall - in the next section of your Instagram insights report, you’ll need to focus on your community.
Audience demographics insights are the spark that will help you fuel an effective social media strategy optimization.
That’s because once you know more about your followers, you’re one step closer to creating Instagram posts more tailored to their preferences.
To start, your audience demographics data can help you improve your posting schedule, to be more aligned with your followers’ activity program.
Furthermore, your audience demographics analytics can reveal precious information that will help you create more specific audience segments for your ads and run more effective paid campaigns.

-
Don't forget about individual posts performance stats
Whenever you did a major swap in your content strategy - like replacing more images with carousels or, even better, experimenting with Instagram Reels, you may have noticed some changes in your engagement, reach, or impressions average values.
If a certain post type or concept led to drops or spikes in your Instagram metrics, you need to identify them in order to know what to avoid or - quite the opposite - use more.
Therefore, individual posts’ performance stats are another key element of your Instagram analytics reports that are easier to understand and interpret once you know more about your audience.
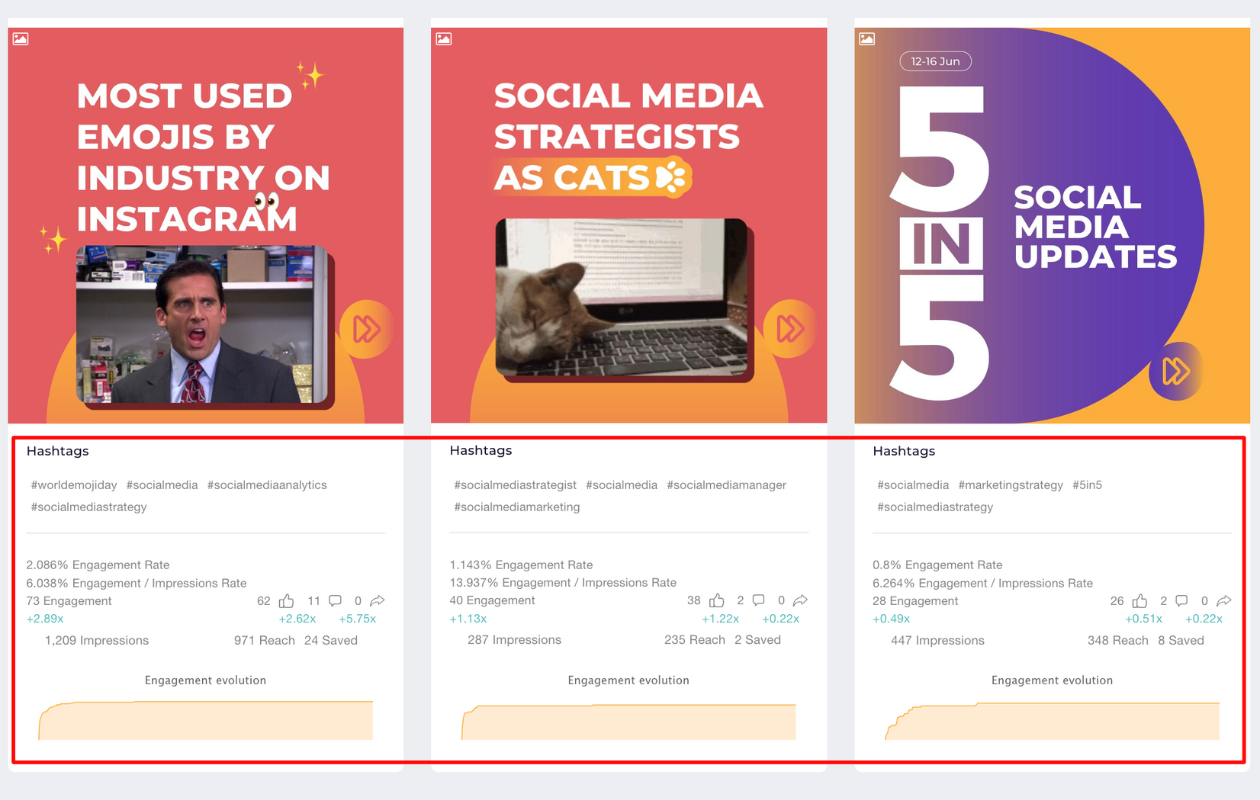
Individual posts' performance data should be included in your Instagram analytics reports since it offers plenty of helpful insights, like what type of content should be boosted for greater reach or engagement.
4. Free Instagram reports templates
Checking various social media reporting templates may help your better understand what you should include in your reports. Or, who knows, you may get some design ideas to make your own reports more appealing.
Depending on your clients', they may want to see their social performance in PDF, PowerPoint, or Excel.
We're sharing Socialinsider’s social media reporting templates as a starting point for your reporting to help you out.
Final thoughts
Instagram is considered the best social media platform for business because of its ability to market your brand and help you connect with your target audience.
If you want your client's brand to thrive on Instagram, you need to track the performance monthly or quarterly, export the metrics into a presentation-ready report and showcase your results.
Tracking the right metrics will help you know how your client brand is performing, how your client's competitors are performing what they are up to, and strategies to implement to ensure that your client's brand performs well on Instagram.


