
As a web designer, you take several user experience components into account when working on a website: its layout, microcopy, usability and intuitiveness. After all, those components play a major role in how visitors perceive your brand as well as how you’d like for them to navigate your site.
But how often do you consider the site’s load time? How often do you consider design elements with regard to their affect on performance? If you’re like most designers, not often enough.
Optimizing your site’s performance is paramount in the modern web. It should be no surprise people like fast loading sites and so does Google. And although this is something that a great designer should consider during the earliest stages of design, the reality is that we most often fix the problem after the fact.
With this in mind, let’s learn how to (accurately) analyze your site’s page load time using WebPagetest. We’ll start by explaining what WebPagetest is and what you can do with it. Next, we’ll teach you how to interpret its test results and share some tips to help you optimize website performance.
What is WebPageTest and what does it do?
WebPagetest is a free tool that helps you identify why your site is slow and what steps you can take to optimize its performance.
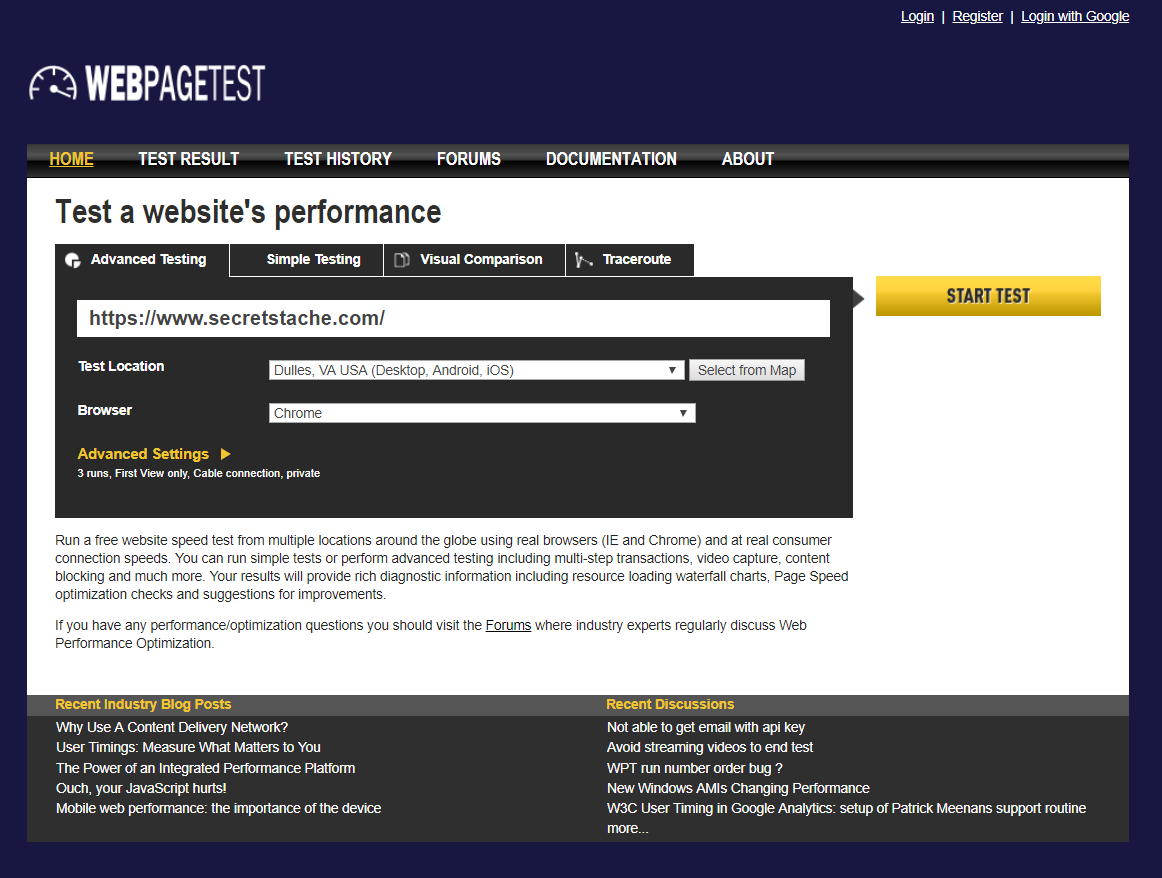
It lets you measure and track different metrics that tell you where your site has bottlenecks regarding speed. In addition to this, WebPagetest helps you understand what visitors experience when they visit your site for the first time and subsequent visits.
One of the best things about WebPagetest is that it allows you to configure custom settings and get accurate results. You also have the option to run concurrent tests and get an average of the test results. For this article, we’ll work with the default settings and take a look at the most critical data.
Interpreting the WebPagetest grades
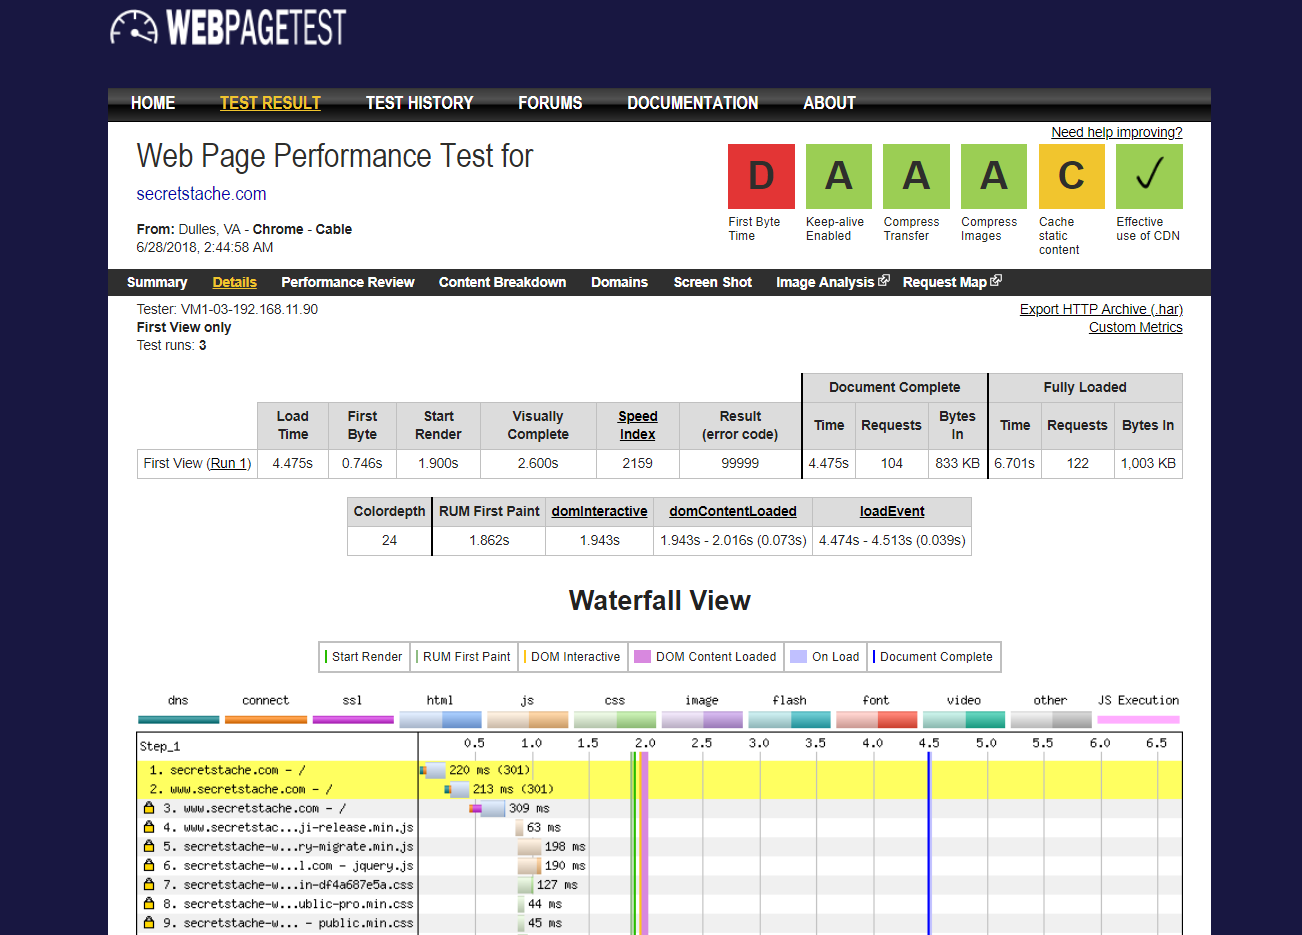
Once you run a test, you’ll see a screen displaying various test results. Starting from the top, you’ll see letter grades.
Here’s what they mean:
- First Byte Time. This grade represents the time it takes for the hosting server to respond to a user accessing the page. Most of the time, the First Byte Time is driven by your hosting company.
- Keep-alive Enabled. Keep-alive enabled (also known as a persistent connection) is simply a communication between the server and the client that says: “You can grab multiple files at a time.” The benefit of this is that when you download multiple files concurrently, your site loads faster.
- Compress Transfer. The compress transfer grade reflects your file sizes. Bigger file sizes will give you a poor grade whereas you’ll get a much better grade if your file sizes are small. Having GZIP compression enabled gives you better results. Simply put, large images have large files, large files slow down your site, and a slow site leads to poor performance.
- Compress Images. Compressing images helps reduce the website’s size and removes image metadata. If you have an image-intensive website, compressing them can have a huge impact on site speed.
- Cache static content. Having a cache enabled to store static content (such as images and JavaScript) will make your site load faster on return visits. The cache is stored on the user’s browser. When a visitor returns to your site, they can simply load a cached version of static content instead of waiting for your site to load it every time.
- Effective use of CDN. If you’re using a content delivery network (CDN) on your website, you’ll get a checkmark in this box.
Most of these grades are based on percentages and are affected by external factors. For instance, if you’re using Google Fonts on your website, then they’re coming from a CDN. If the CDN is slow on any given day, your site will be slow, too. The same goes for various tracking scripts such as Google Analytics and Facebook Pixel.
For this reason, it’s important to dig deeper and understand what’s happening behind the scenes. Instead of focusing on getting straight A’s across the board, you should evaluate the underlying factors. These factors are listed in the Performance Results (Median Run) table directly below.
Understanding the performance results (Median Run) table
The Performance Results (Median Run) table gives you the median (average) results of the three tests we ran. As shown in the table below, it calculates the averages of the First View and the Repeat View.

The First View result emulates the test of a user who visits your website for the first time. What this implies is that they’re using a browser that hasn’t yet stored cookies and has an empty cache.
A cache is a place where data is stored temporarily. When you visit a website, its static data is stored in your browser’s cache. When you return to the website, your browser will need to receive less information from the site since a good portion of it is already stored in its cache. This results in a faster page load time.
The Repeat View result emulates the test of a user who visited your site, left, and then came back to it. It should be faster than the First View results, as a result of the cache.
#1: Load time
The Load Time is how long it takes to get to a point where enough content is loaded on your website for the user to interact with it.
A website can be functional, i.e. a user can interact with it before it fully loads. Generally, the web page’s code and images are rendered before the site fully loads allowing users to scroll and interact with the site.
For instance, if a site fully loads after 7 seconds, it can become interactive after 3.5 seconds. The rest of the time is usually taken up by third-party scripts (such as Google Analytics and Facebook Pixel Tracking), which is why it’s important where you put them in your code. We’ll discuss this again in the next section.
You want the Load Time to be under 2 seconds. You can reduce your site’s Load Time by optimizing images, leveraging browser caching, enabling GZIP compression, optimizing your CSS, and much more.
#2: First byte time
The First Byte Time is also known as the Time To First Byte (TTFB). As the name indicates, it is the time it takes from when a user request is made to the server, to the time it takes for the user’s browser to receive the first byte of response.
A byte is a unit of memory. When someone tries to access your website, that person’s browser requests information (bytes) from a server.
Generally speaking, you want this value to be less than 500 ms though Google recommends 200 ms.
You can improve the TTFB by using CDNs and optimizing back-end infrastructure performance and software performance.
#3: Start render
Start Render indicates how long it takes for the user’s browser to display content on the web page, i.e. the point where a blank page is no longer … blank. The content can be anything.
Ideally, you want this value to be under 1 second.
This metric isn’t always easy to optimize since external factors, like Google Fonts, sometimes influence it. That said, if your Start Render value is over 1.5 seconds in the Repeat View row, you’ll want to see which site elements you can control to reduce it.
Start by focusing on the resources loaded in the HEAD of your web page. Having fewer resources in the HEAD will help you reduce the Start Render time significantly. Although many scripts suggest being loaded in the head, it’s not necessary. Consider moving them to the footer (right before the closing </body> tag).
#4: Fully loaded time
As the name suggests, this is the time it takes to load every element on your web page. It includes code, images, external (tracking) scripts, ads, etc.
As long as you take measures to fix render-blocking elements above the fold, your web page’s Fully Loaded Time can be over 7 seconds. You can remove render-blocking JavaScript and render-blocking CSS to reduce the time it takes your web page to load fully.
Render-blocking elements can be anything that delays the important visual elements (like text and images) on your site from being displayed. Scripts, stylesheets, and HTML imports are the most common render-blocking elements on web pages.
If you’re like most designers, you might have noticed that sometimes you include design elements into web pages that are likely to use more resources than average. This could be because it requires an image, some fancy CSS, or even JavaScript. For instance, the number of DOM elements you use directly affect site performance. The fewer times you trigger layout, the better.
Ask yourself this: does the element’s existence push the UI forward in a meaningful way or is it just design for design’s sake? The more elements you let slide, the slower your site will become over time.
#5: Requests
This is the number of images, CSS files, JavaScript files, and other elements that the server needs to request to display your full web page. All of the files your website includes need to be downloaded to the visitor’s browser when they access it. On average, this number is around 140. Generally, the lower the number of requests the better.
In the table shown above, you’ll notice that on the Repeat View, the requests made dropped from 105 to 12 because of caching. When a visitor returns to your website, most of the static content (images, JavaScript, etc.) is already stored in their cache and, therefore, doesn’t have to be requested again.
To decrease the number of requests, you can simply remove unnecessary images from your web page, reduce the number of external scripts, make JavaScript asynchronous, and combine multiple CSS files into a single file. Doing so allows you to download files in parallel with other resources, which then gives you faster page load times.
#6: Bytes in
Bytes In is more commonly referred to as the page size. It’s the total amount of data that the user’s browser has to download to load the web page. Ideally, you want your page size to be around the 500KB mark. If your site is a few MBs (1MB to 2MB), you’ll have to take steps to decrease the page size if you want your site to load fast.
There are many ways you can reduce your page size:
- Use CSS sprites.
- Optimize your images.
- Host videos on third-party websites.
- Minify HTML, CSS and JavaScript.
Let’s take minification as an example. A lot of the time the code we write is easy for us to read because of white space, new lines and comments. These unnecessary characters cost us in performance. Code minification is all about removing these unnecessary characters to reduce the file size. This way, the amount of data that is downloaded to the browser is significantly less than pre-minification.
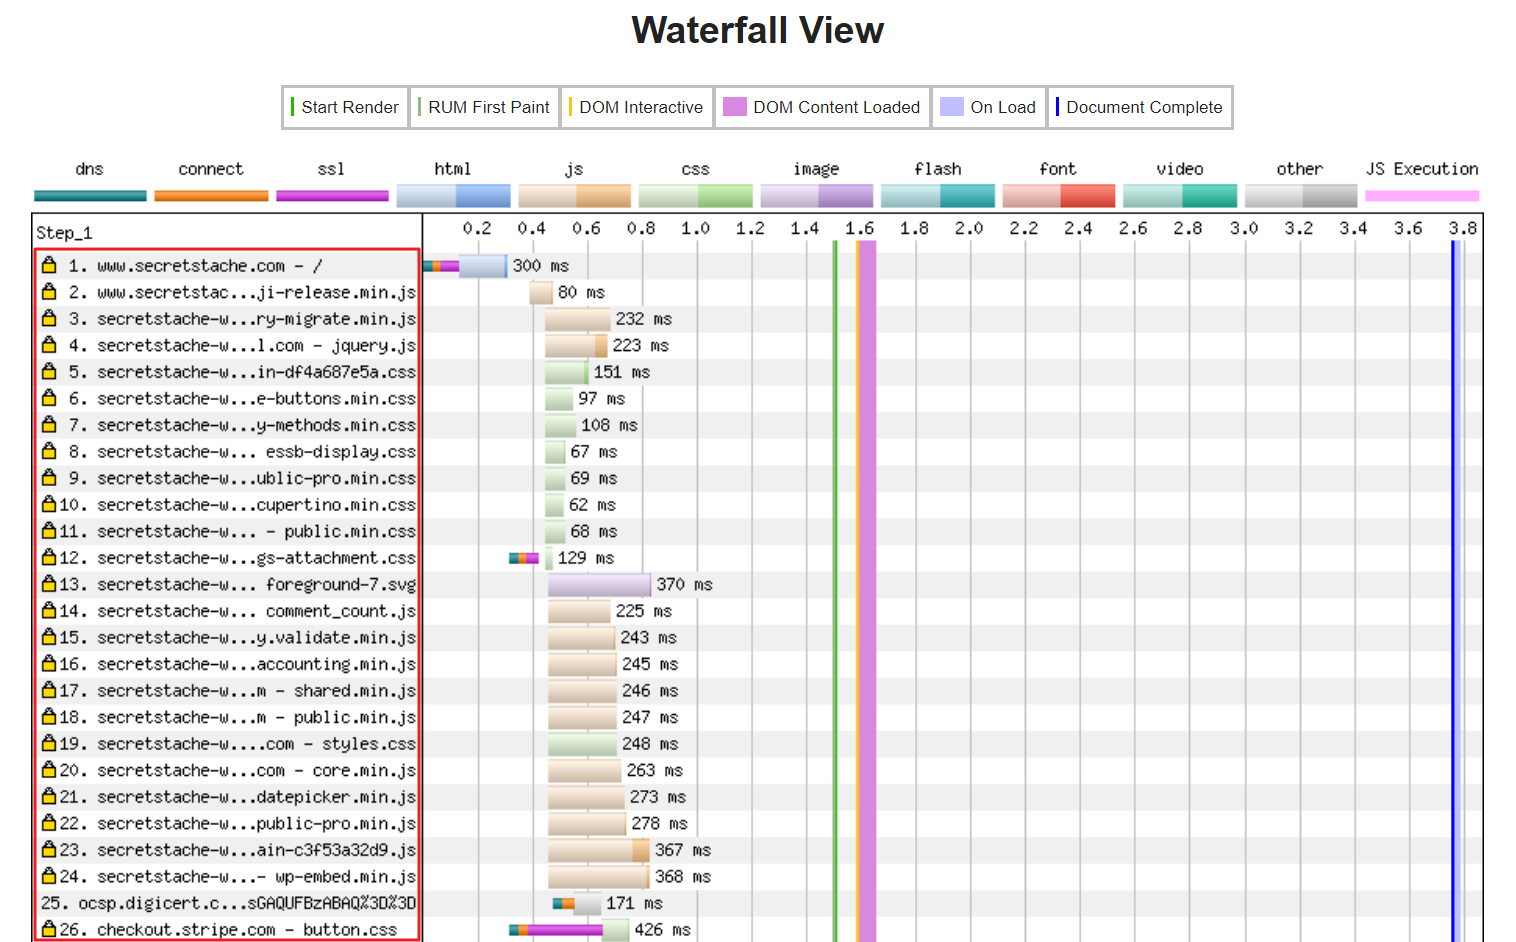
Interpreting the waterfall schema results
The waterfall chart illustrates which resources were loaded by a user’s browser to load the web page. The vertical axis represents the order in which the resources loaded (top to bottom) and the horizontal axis charts the time, i.e. how long it took for a resource to load fully.
Simply put, the waterfall chart shows you every element that loads on your website, in which order it’s loaded, and how long it takes to fully load. It helps you identify bottlenecks that cause your web page to load slowly. The three elements that impact your site’s speed the most are CSS, JavaScript and images.
Length of bars
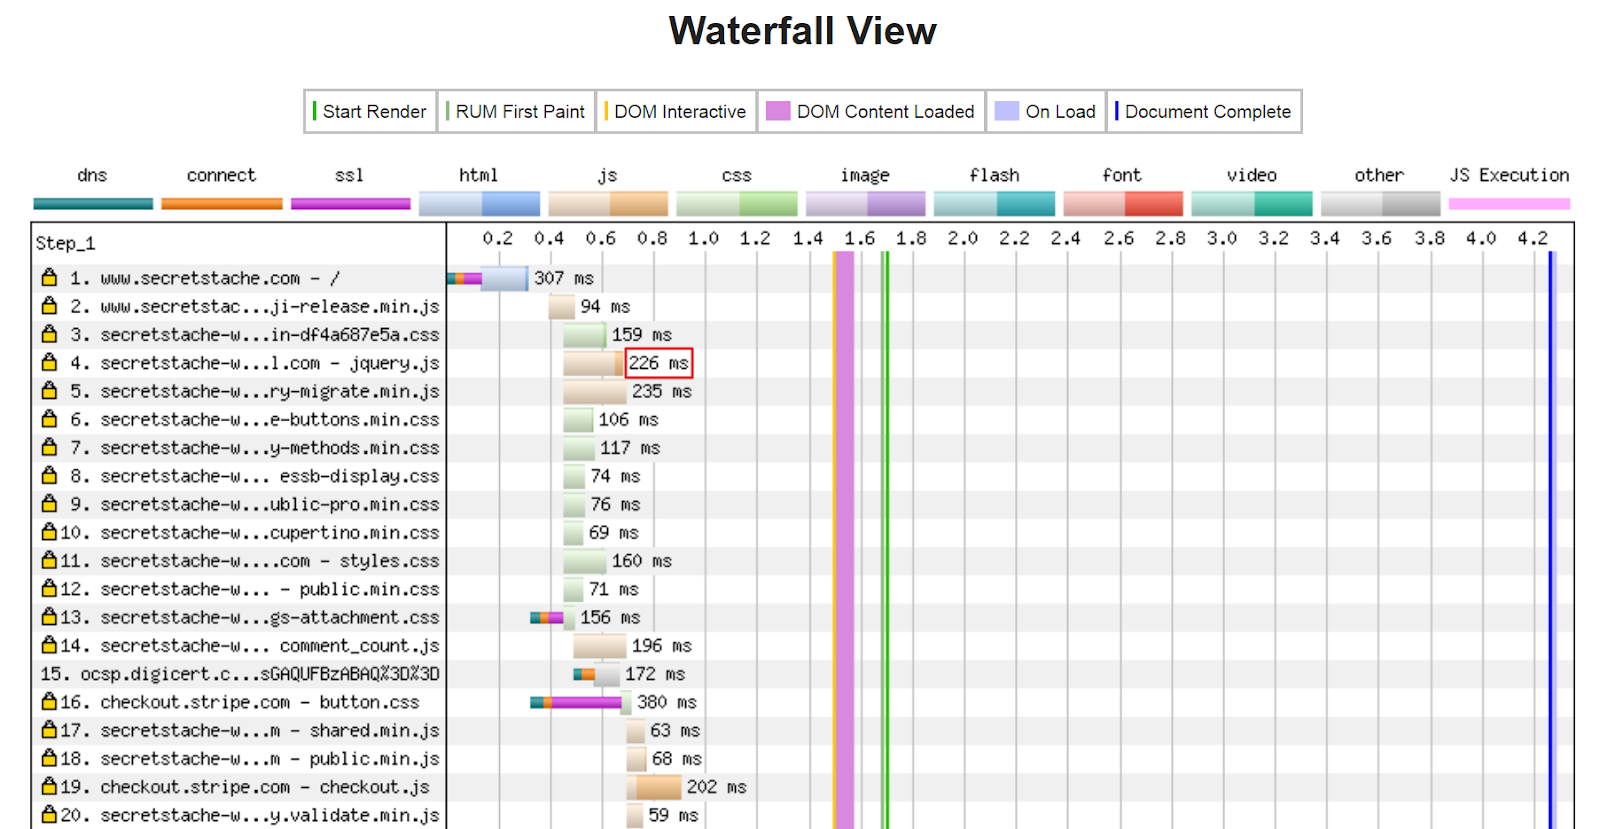
The length of the bars in the waterfall chart is to scale. So, when you’re making changes to your site to reduce page load times, you should refer to the number at the end of the bar to see if there’s a change in the element’s speed.
For example, the first bar will almost always be your host putting your page’s HTML document together. If your site loads in 15 seconds and reduce it to 10 seconds, the length of the bar might be twice as long as it was before but the number at the end of the bar might remain the same.
Order of elements
The order in which your elements load makes a huge difference to your site’s perceived speed. For instance, if you have a bunch of render-blocking elements above your images, your site’s visitors will most likely see a blank screen until those elements load.
It’s essential that you reorder the elements in a way that visual elements (like images) load before the CSS and JavaScript.
Conclusion
Site performance is user experience.
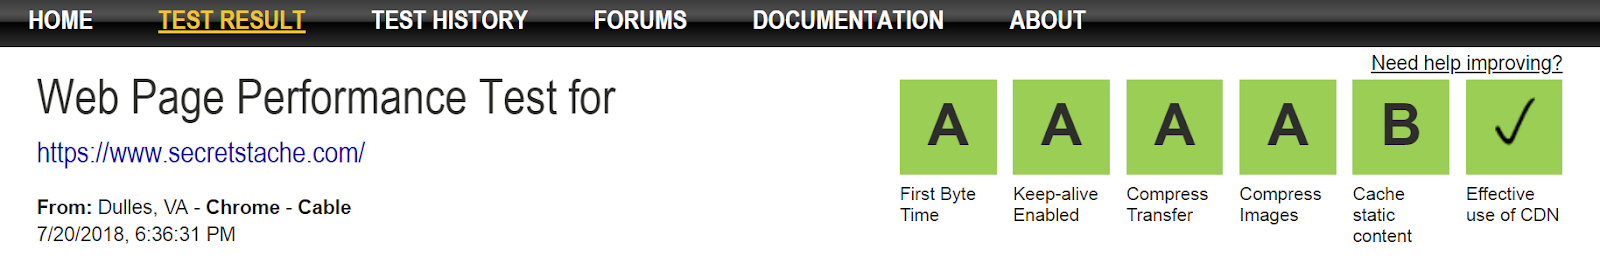
The goal isn’t to get your site to load in under two seconds right away. Instead, you should analyze your site using WebPagetest to identify bottlenecks that cause it to load slow. Once you have your test results, go through this article to see what each metric means and what you can do to improve it. Finally, remember to run the speed test on your website once you’ve made the changes to see how much it helped.
What are some of the steps you take to optimize your site’s performance? Let us know by commenting below.
