
In addition to quantitative accuracy, it is critical for learning analytics to consider design principles and methods of persuasion that convince educational leaders and students to do things differently. This requires a complementary approach that includes quantitative techniques, qualitative analysis, narrative, and design thinking.
While learning analytics can be transformational, Leah Macfadyen and Shane Dawson described one of its most interesting failures in "Numbers Are Not Enough: Why e-Learning Analytics Failed to Inform an Institutional Strategic Plan."1 Though they provided a strong quantitative analysis of student and instructor use of their institution's learning management system (LMS), they found that their results did not move the "heart and head" (their emphasis) of institutional leaders to do anything differently. They speculated about the "accessibility and presentation of learning analytics discoveries" to "surprise and compel, and thus motivate behavioural change." Macfadyen and Dawson closed with an intriguing recommendation that "research must also delve into the socio-technical sphere [emphasis added] to ensure that learning analytics data are presented to those involved in strategic institutional planning in ways that have the power to motivate organizational adoption and cultural change."2
In our experience, learning analytics-based interventions — let alone actual evidence of impact — have been rare. As the field matures, are we reaching a point at which the lofty goals of analytics to improve student learning might require a new method for persuading those in a position to implement interventions to act? If so, what might this new form of persuasion look like, and how might we engage the social side of technology innovations to advance Macfadyen and Dawson's recommendation? In short, how should we do learning analytics differently to help move the heart and head?
To help frame our discussion, consider Aristotle's Rhetoric, the classic treatise on the art of persuasion that describes three primary types of effective appeals: (1) an appeal to ethos or character/authority, (2) an appeal to pathos or emotion, and (3) an appeal to logos or logic. The most persuasive acts employ all three, but for the purposes of this discussion we look primarily at ethos and pathos, since an appeal to logic informs quantitative or logical appeals that have dominated learning analytics to date — precisely what Macfadyen and Dawson found wanting. To be clear, we are both still committed to quantitative methods and data integrity, as seen in our most recent EDUCAUSE Review article.3 We offer this discussion as a bridge to complementary appeals to qualitative analysis, narrative, and design thinking.
Early Adopters Are Rare for a Reason
In Malcolm Gladwell's "Big Man Can't Shoot" podcast, he analyzed Wilt Chamberlain's historic 100-point game in 1962, in which he made 28 of 32 free throws (87.5 percent) using a two-handed, between the legs, under-hand "granny shot" (figure 1). Despite his success, Chamberlain never used the method again because he "felt silly" and called it a "sissy" way of shooting. He went back to being a horrible free-throw shooter throughout his career, finally admitting in his autobiography that he was wrong to ignore the statistics. (See the YouTube video on the subject.)

As Gladwell noted, his podcast was and wasn't about basketball. He used Chamberlain to explore why it's hard for good ideas to catch on, despite compelling quantitative evidence, and referenced sociologist Mark Granovetter's "threshold model of collective behavior," which Gladwell summarized as "the number of people who have to do something before you join in." We may have a low or high threshold, but unlike our beliefs, which are internal, thresholds are about what happens to us as part of a crowd — or if we feel we're outside of it, like Chamberlain. Gladwell illustrated this in the case of how protestors become rioters who throw rocks through a windows. A young person who feels hopeless might have a low peer threshold to throw that rock, whereas a grandmother might have a higher one.
Peers Changing Faculty Beliefs
We can debate and speculate about the equivalent of a "granny shot" in teaching and learning (e.g., active learning, flipped classrooms, online learning, etc.), but Gladwell's focus on isolation from like-minded peers as a barrier to innovation jibes well with the evolution of faculty beliefs about teaching. For example, Douglas Robertson proposed what is now considered a classic model4 for how faculty beliefs about teaching influence their evolving pedagogical practice; it includes the following stages:
- Egocentrism — focusing mainly on their role as teachers
- Aliocentrism — focusing mainly on the role of learners
- Systemocentrism — focusing on the shared role of teachers and learners in a community
If this evolution of belief and practice occurs among teachers, Robertson identified telltale signs of the transformation. First, as faculty move from one stage to the next, they bring the benefits and biases of the previous stage. Second, they typically change their beliefs and practices only when confronted by the limitations of a current stage, which is brought about by "teaching failures." Finally, their desire for certainty, stability, and confidence either keeps faculty frozen in a status quo framework or drives their evolution into the next stage in an effort to avoid a paralyzing and stagnant neutral zone consisting of "a familiar teaching routine that they have deemed inappropriate and with nothing to replace it."5
No teacher wants to look stupid in front of his or her students.6 But if or after it happens, here is where finding a successful peer may help. While faculty might start their teaching practice by emulating the way they were taught, if they encounter "teaching failures," their natural curiosity and desire to connect with learners might evolve best when they can find and learn from each other. To help, we propose that the "bird's eye view" learning analytics provides can help — at least initially — shine light on and connect faculty peers who are designing effective courses that help students learn, particularly in and from one course to another.
For example, at the University of Maryland, Baltimore County, in 2010 we used — or rather stumbled upon — unusually high student LMS activity to identify, understand, and promote an adjunct instructor's novel use of a little known Blackboard (Bb) tool called adaptive release (AR), which allows an instructor to set conditions students must meet to access course content. Using AR, instructors can create a syllabus quiz that students must take and pass before they can even see, let alone submit, the first assignment for credit. After redesigning his entire course to use AR, Economics adjunct instructor Tim Hardy's student Bb course activity skyrocketed, which caught co-author John Fritz's eye. Fritz asked Hardy what he was doing and why. Apart from wanting students to take more responsibility for learning (the problem), he used AR to automate the feedback and self-paced learning tailored to each student, which he could not scale himself (the solution). After he implemented AR, Hardy's students began scoring 20 percent higher on the department's common final exam compared to other sections of the same course. This led to a deeper analysis that showed his students also earned a half-letter grade higher in the next course, which he did not teach, for which his course served as a prerequisite.7
Having used analytics to identify one faculty member's effective use of adaptive release, Fritz then looked for other faculty with high LMS activity, to see if they were doing the same. Indeed, AR use by faculty was common to many of the most active LMS courses across the institution. This led to a recorded brown-bag panel that included an Ancient Studies instructor who regulated student acquisition of Latin and Greek through her mini-podcasts, whose release she planned instead of trying to race ahead at the start of the semester or cram them all in at the end — a pedagogical problem she'd encountered before. But here's the key: UMBC's central IT team didn't show her how to do this. She had heard about Hardy's use of AR during a hybrid learning "information session" and ran with it. Finally, one of the most creative uses of AR led to a short screencast video tutorial on how to create video game–like "achievements" in a chemical engineering course.
The use of AR is now one of several "effective practices" UMBC routinely recommends to faculty considering a redesign of their courses for hybrid or blended delivery. Since 2005, more than 75 instructors have participated in the Alternate Delivery Program (ADP) hybrid/blended course redesign initiative, and use of Bb Analytics for Learn (A4L) has shown that all of their subsequent courses (not just the ones they redesigned for the program) are considerably more active than all other university courses.8 This includes other hybrid/blended courses taught by instructors who did not go through the ADP hybrid-training program. Also, UMBC research has shown a statistically significant increase in student final grades for ADP-redesigned hybrid courses compared to non-ADP hybrid courses.9
In short, the quantitative methodology of learning analytics was used to identify a high LMS activity outlier instructor and the underlying effective practice. Qualitative methodology was then used to reverse engineer why AR was effective. How and why to use AR was then shared with other faculty through informal presentations, an online screencast, and a more formal case study. Now, the university uses learning analytics to identify other high LMS activity outliers, who are then interviewed, and to evaluate the effectiveness and scalability of a program that trained faculty how to increase their students' LMS activity and (hopefully) their responsibility for learning.
The Emotional Appeal of Learning Analytics
The role that successful peers play in setting a standard or model others might want to emulate is key to the self-efficacy and self-regulated learning research of Albert Bandura and Barry Zimmerman,10 which we think could apply to both instructors and students. While theories of self-regulated learning range from behavioral to social cognitive to constructivist, leading proponent Barry Zimmerman showed that social context is critical to developing one's ability to self-regulate. In short, the initial awareness and reflection we gain when we compare our own performance with a mentor or model who is more successful than we are typically follows four stages:
- Observational: Students learn to distinguish the major features of a model's skill or strategy.
- Emulative: A learner's performance […] approximates the general form of a model's skill or strategy.
- Self-control: Students can perform a skill or strategy based on mental representations of a model's performance.
- Self-regulation: Learners can adapt their skills and strategies systematically as personal and contextual conditions change.11
A useful way to visualize these four stages of evolving mastery is through a simple task we all learned to do: tying our shoes. In the first stage, we learned that shoes with laces should be tied, usually by observing someone who can do so. Peer comparison made us aware of a discrepancy in how we saw ourselves vs. how we saw others. In the second stage, we tried to emulate the model's proficient shoe-tying prowess. Here, we were not just observing — we began to make initial clumsy but deliberate efforts to replicate the model's skill. In the third stage, we actively began to self-regulate or self-judge our own shoe-tying efforts and adjusted accordingly without direct observation of or instruction from the model. In the final stage, we began to exercise self-control so that we could tie shoes on demand or even without much conscious thought or effort.
This state of discrepancy — between what we think, feel, believe, and understand about ourselves compared to what we observe or believe to be true of others we wish to emulate — is a key principle of Bandura's social cognitive research in self-efficacy. Initially, Bandura focused on helping patients overcome debilitating fears like handling snakes or quitting serious negative habits such as smoking or overeating. Through repeated observation of successful models engaging in behaviors that might initially seem unimaginable, patients would not just learn to ignore their fears or addictions, but would actually begin to develop and apply self-confidence they saw modeled by others — and eventually themselves.
To us, faculty who occupy Robertson's "neutral zone" between "teaching failures" and "nothing to replace [them]" look ripe for a course design intervention based on learning analytics, but only if they are aware of a minimum threshold of peers who they believe have a more effective approach. This is why and how learning analytics might be able to help — by identifying, supporting, evaluating, and promoting effective practices and practitioners, to serve as a standard by which faculty not only measure themselves but also to point to a way forward, by ideally helping students take responsibility for learning. Yes, technology might help, but only if instructors first believe that it can, enough so that they try it or look for peers who have done so. Just as students taking responsibility for their learning is the only scalable form of learning, so too must faculty take responsibility for "teaching failures." This includes being open to other pedagogical examples and working hard to master and implement them, which requires a "growth" mindset willing to explore, practice, refine, and self-assess.
Bridging Data Science and the Design Mindset
These pedagogical and psychological contexts that inform human motivation — and persuasion — can begin to have important implications for effective learning analytics interventions, whether nudges, visualizations, or messages directed at students (or faculty) that become embedded components of academic technologies. In short, simply presenting what we think are clear and accurate quantitative data isn't sufficient; more work needs to go into how we find and tell the stories in data that can move the heart and head. We need to interpret, message, and represent quantitative findings in ways that can increase student self-regulation or even raise faculty awareness about their own teaching. To illustrate, consider a few examples from our experience developing learning analytics projects.
San Diego State University's Instructional Technology Services department began a learning analytics pilot project in fall 2014 with the goal to identify and intervene with students who were at-risk of failing high challenge (20–40 percent D, F, W), large enrollment, undergraduate courses. In collaboration with their Department of Mathematics and Statistics and co-author of this article John Whitmer, they developed a predictive model that integrated multiple automated data sources (LMS use, student response system activity, gradebook data, online homework, and other technologies). Custom predictive models were created for each course in collaboration with the instructor; eventually these models reached high degrees of predictive accuracy.
How to intervene with students to improve their performance was a much more difficult problem. The team was cautious about tone to ensure that we didn't discourage or appear to criticize students, while still revealing that their behavior was causing concern. Messages were crafted using different language styles and approaches, with additional variation in frequency and technology: we tried e-mail, text, and even video snippets. Examples such as the one embedded here from Catalina Amuedo-Dorantes [https://economics.sdsu.edu/faculty/docs/cv/Amuedo-Dorantes_CV_12_18.pdf], chair of the Department of Economics, give a sense of the playful nature of some messages.
SDSU intervention message from Catalina Amuedo-Dorantes
While the outcomes of interventions did not have an effect on student grades (with one notable exception that was not repeated), the predictive modeling and overall project results provided a strong foundation for future work that led to significant increases in student performance. In 2015 SDSU began offering Supplemental Instruction (SI is a proven peer-led, active learning model) as a complementary intervention alongside the learning analytics work. The program, which is offered in some of the same courses as the initial pilot, has led to substantial improvements in the success of those students who participate in SI sessions. In fall 2017, SDSU will augment their student success intervention strategy to incorporate an automated predictive analytics pilot (based on the same statistical principles and methods as the 2014 research), purposeful course redesign, timely academic advising, and Supplemental Instruction in targeted high-challenge courses.
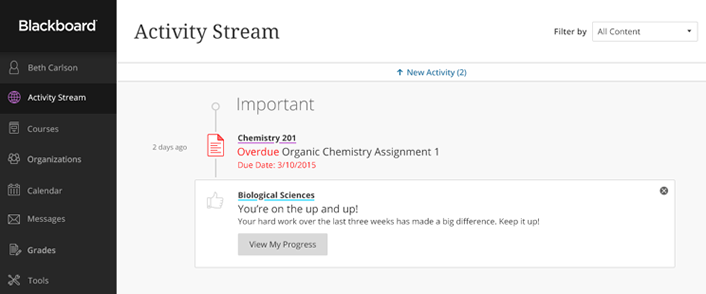
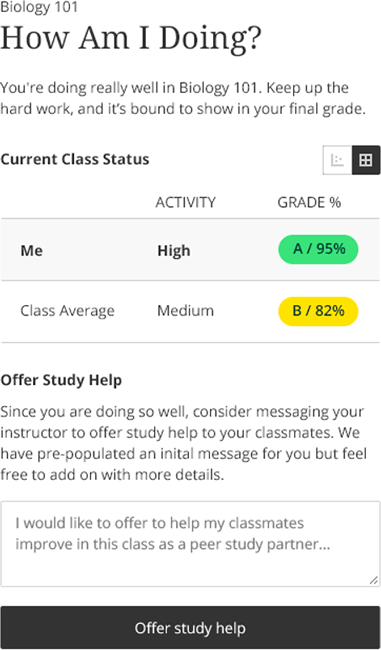
Another example comes from Blackboard itself. The company recently developed learning analytics "notifications" that go to instructors and students based on overall LMS usage and grades relative to peers in the same course. The data science team created rules with threshold levels that applied across courses by running simulations using prior student activity and grade outcomes. These notifications are augmented with click-through workflows to scatterplots and follow-on actions. Creating these rules and visualizations involved human judgment: How frequently could students be notified before becoming annoyed or tuning out? Should we include positive nods as well as corrective nudges to keep them interested? (Answer: Yes) Creating the right rules took a significant amount of time and thought.
A more challenging task was figuring out the appropriate messages to give students. Simply stating the rule could be demotivating ("You're in the bottom five percent of your class in LMS activity"), but creating the right message was harder and something our data science team was poorly-suited to create. We handed off creation of these rules to designers and text-on-page experts. They prototyped and created a design vocabulary, using a "concerned friend" tone that we believe will prove motivating to students; initial student feedback research12 has been positive.13 In full disclosure, creating this messaging involved considerable back and forth between the data science team and designers. In particular, the teams held robust discussions about (1) what types of messages would be motivating and for whom; (2) what could be said based on the triggers; and (3) what might exceed what could be inferred from the learning analytics data. In the end, we created motivational messages such as those shown in figures 2 and 3 that include colloquial messages designed to capture student attention and provide some detail about the behaviors that triggered the notification.
This intersection of the "heart" and "head" of quantitative approaches that provide accurate indicators of student performance with design- or psychology-influenced messaging can underpin radical educational innovation through learning analytics. On the downside, people with expertise in data visualization and communication of quantitative techniques are as rare (and nearly as expensive) as data scientists because other industries have recognized the importance of effective communication. Perhaps it's time to augment new data science programs with data visualization or design thinking tracks for people with less interest in numbers or algorithmic approaches.
Where Do We Go from Here?
Truly scalable interventions should facilitate and leverage students' or instructors' own motivations into an evidence-based intervention that raises self-awareness to seek (or accept) help from the institution. To do so, however, will probably require more than a quantitative approach to identify and disseminate "evidence" that moves the heart and head.
We believe that a quantitative approach to learning analytics is necessary but not sufficient for institutional transformation, culture change, and ultimately success. Yes, we need data and analysis — preferably including the impact of interventions along with accurate predictions — but we need to go beyond the predictions, as Macfadyen and Dawson suggested, to help find and tell the stories of effective practices and practitioners, whose example can be far more persuasive than numbers alone.
We would also argue that as administrators, support staff, or even vendors, we ought to be more willing to share our "bird's eye view" of how we think IT systems are used across campus —something users can't easily ascertain for themselves, unless we equip them. Too often IT support or even product development can get pigeonholed into a reactive mode of only doing what we think users want, but maybe not what they need. Yes, this is tricky, but having a sense of what users ought to do is key to Thaler and Sunstein’s “choice architecture,” which they base on a concept they define as "Libertarian Paternalism," two terms they admit work better together than they do alone. Basically, although they believe people should be free to choose,
It is legitimate for choice architects to try to influence people's behavior in order to make their lives longer, healthier and better . . . In our understanding, a policy is paternalistic if it tries to influence choices in a way that will make choosers better off — as judged by themselves.14
Basically, good IT support or software design includes sharing what we think we see or believe to be effective, and then identifying and promoting the example of others to validate and help make the case for change.
Finally, as the old adage goes, nobody learns from a position of comfort. Sometimes, when we observe a difference in what we know, understand, or can do compared to others we perceive as more proficient, this truth can hurt. Wherever possible, this moment of truth should be done in private. We should not use analytics to punish anyone, but as illumination to educate and inform what is possible. We may still only be able to lead the horse to water, but perhaps learning analytics could be a way to "put salt in the oats," as Maryellen Weimer recalls about a colleague's twist of this familiar metaphor. "The horse who has had salt put in his oats does not have to be forced to drink. He is thirsty, knows he is thirsty, and is looking for water."15
Learning analytics can be used to identify more of these success stories. Given a lack of current intervention examples, however, we've begun to see quantitative analysis as a necessary, but not sufficient, methodology for realizing the full potential of learning analytics to be transformative. Showing people how they can do better in a positive way, without embarrassing them, might encourage them to take those next steps forward. With the right stories touching people's hearts about the value of learning analytics and solid data supporting that message, both heart and head can agree to face the possible discomfort of change in pursuit of excellence.
Notes
- Leah P. Macfadyen and Shane Dawson, "Numbers Are Not Enough: Why e-Learning Analytics Failed to Inform an Institutional Strategic Plan," Educational Technology & Society, Vol. 15, No. 3 (2012): 149–163.
- Ibid., 161.
- John Fritz and John Whitmer, "Learning Analytics Research for LMS Course Design: Two Studies," EDUCAUSE Review, February 27, 2017.
- Douglas L. Robertson, "Professors' Perspectives on Their Teaching: A New Construct and Developmental Model," Innovative Higher Education, Vol. 23, No. 4 (1999): 271–294.
- Ibid., 279.
- David Matthews, "Fear of Looking Stupid," Inside Higher Education, July 6, 2017.
- John Fritz, "Using Analytics At UMBC: Encouraging Student Responsibility And Identifying Effective Course Designs," Research Bulletin, EDUCAUSE Center for Applied Research, 2013, 11.
- Karin Readel, "Using Analytics to Examine Course Design and Identify Effective Practices," presented at the EDUCAUSE Learning Initiative Annual Meeting, 2013.
- Tom Penniston and John Fritz, "Course Redesign and Adaptive Learning to Support Student Success," presented at the 2016 EDUCAUSE Learning Initiative Annual Meeting.
- Albert Bandura, Social Foundations of Thought and Action: A Social Cognitive Theory (Englewoold Cliffs, N.J.: Prentice-Hall, 1986); Albert Bandura, Self-Efficacy: The Exercise of Control (Macmillan, 1997); Barry J. Zimmerman, Albert Bandura, and Manuel Martinez-Pons, "Self-Motivation for Academic Attainment: The Role of Self-Efficacy Beliefs and Personal Goal Setting," American Educational Research Journal, Vol. 29, No. 3 (1992): 663–676; and Barry J. Zimmerman and Dale H. Schunk, eds., Self-Regulated Learning and Academic Achievement: Theoretical Perspectives (Routledge, 2001).
- Zimmerman and Schunk, Self-Regulated Learning and Academic Achievement, 22.
- John Whitmer, "Surprising Lessons from Research on Student Feedback about Data Dashboards," Blackboard blog, February 2, 2017.
- Stephanie D. Teasley and John Whitmer, "The Impact of Student-Facing LMS Dashboards," research report, 2017.
- Richard H. Thaler and Cass R. Sunstein, Nudge: Improving Decisions About Health, Wealth, and Happiness (Yale University Press, 2008), 169.
- Maryellen Weimer, Learner-Centered Teaching: Five Key Changes to Practice (John Wiley & Sons, 2002), 103.
John Fritz, PhD, is associate vice president of Instructional Technology, Division of Information Technology, University of Maryland, Baltimore County.
John Whitmer, EdD, is director of Learning Analytics and Research, Blackboard.
© 2017 John Fritz and John Whitmer. The text of this article is licensed under Creative Commons BY-NC 4.0.