


Abstract
A long history of fire suppression in the western United States has significantly changed forest structure and ecological function, leading to increasingly uncharacteristic fires in terms of size and severity. Prior analyses of fire severity in California forests showed that time since last fire and fire weather conditions predicted fire severity very well, while a larger regional analysis showed that topography and climate were important predictors of high severity fire. There has not yet been a large-scale study that incorporates topography, vegetation and fire-year climate to determine regional scale high severity fire occurrence. We developed models to predict the probability of high severity fire occurrence for the western US. We predict high severity fire occurrence with some accuracy, and identify the relative importance of predictor classes in determining the probability of high severity fire. The inclusion of both vegetation and fire-year climate predictors was critical for model skill in identifying fires with high fractional fire severity. The inclusion of fire-year climate variables allows this model to forecast inter-annual variability in areas at future risk of high severity fire, beyond what slower-changing fuel conditions alone can accomplish. This allows for more targeted land management, including resource allocation for fuels reduction treatments to decrease the risk of high severity fire.
Export citation and abstract BibTeX RIS

Original content from this work may be used under the terms of the Creative Commons Attribution 3.0 licence.
Any further distribution of this work must maintain attribution to the author(s) and the title of the work, journal citation and DOI.
1. Introduction
Fire activity is changing in western United States (WUS) forests, with increasing area burned and fire season length partially attributed to warming (Stephens 2005, Westerling et al 2006, Dennison et al 2014, Westerling 2016, Abatzoglou and Williams 2016). A century of fire suppression has also altered forest structure and ecological function in parts of the WUS. A build-up of fuels due to missed fire cycles in formerly open canopy forests with predominately surface fire regimes likely contributed to increasingly uncharacteristic fires in terms of size and severity (Keane et al 2002, Allen et al 2002, Miller et al 2009). These changes increased firefighting costs: federal firefighting appropriations averaged $2.9 billion for 2001–2007, up from $1.2 billion for 1996–2000 (Nazzaro 2007). The impacts of this history on WUS fire severity have not been fully quantified.
Climate is a significant predictor of large fire occurrence and size (Westerling et al 2006, Preisler and Westerling 2007, Swetnam and Anderson 2008, Westerling 2016). Climate controls fire occurrence and severity at broad and fine spatial and temporal scales to promote fuel loading through biomass accumulation and accelerate drying of fuels, and to maintain active fires under favorable concurrent atmospheric conditions, i.e. hot dry weather. Broad-scale drought is linked to regionally synchronous large fires, and recent decades have seen warmer, drier, and longer growing seasons that explain much of WUS large forest fire occurrence (Gedalof et al 2005, Westerling et al 2006, Heyerdahl et al 2008, Morgan et al 2008, Swetnam and Anderson 2008, Westerling 2016).
Additional controls on fire occurrence and severity include land surface characteristics such as topography and vegetation (Alexander et al 2006, Thompson et al 2007, Gill and Taylor 2009). Together with climate and soils, topography (e.g. slope, aspect, elevation) affects energy and water available for biomass production and decomposition, and thus fuel accumulation. Microclimate created by topography also influences fuel flammability. Generally, higher elevation WUS sites support cool moist forests with dense vegetation and fuels, whereas lower elevation sites support relatively less productive dry forests (Agee 1993, Stephenson 1998, Schoennagel et al 2004).
Controls on fire severity have been quantified at many scales—individual fires, landscapes, and small regions. Findings in Colorado Front Range and Southwest forests indicate high severity fire occurrence is a function of extreme weather, rather than vegetation or woody fuel quantity (Holden et al 2007, Sherriff et al 2014). Collins et al (2007, 2009) found that both climate and time since last fire best predicted patterns of fire severity in the Sierra Nevada; time since last fire is correlated with biomass and fuel buildup on a site. Lutz et al (2009) found snowpack anomalies (top-down) mediated lightning ignitions, area burned, and fire severity in Yosemite National Park.
The importance of climate controls in these regions contrasts with findings in parts of the Northwest. In the North Cascade Range, Washington, topographic and vegetation characteristics appeared to mediate burn severity on sites with historically low to moderate severity fire regimes, while climate controls were most evident in high elevation, cool moist forests (Cansler and McKenzie 2014). In central Idaho and western Montana, Birch et al (2015) also found topography and vegetation best predicted daily burn severity values over daily weather and fuel moisture.
No consistent picture emerges of controls on severity among these small-scale studies (individual fires to small regions). Dillon et al (2011) performed the broadest spatial analysis to date, modeling high severity fire occurrence for northwestern and southwestern US ecoregions. They found both climate and topography important for predicting high severity fire occurrence, but concluded that topographic controls were more important; their predictability was low in extreme years with many large fires (Dillon et al 2011).
While existing studies examined high severity fire occurrence at small scales, there has not yet been a large-scale study that incorporates topography, vegetation, and climate to predict regional scale high severity fire occurrence. Here we describe a model for the WUS that predicts high severity fire occurrence, conditional on large fire occurrence, and use it to examine the relative importance of topography, vegetation, and climate.
2. Methods
2.1. Spatial and temporal domain of analysis
Our spatial domain is a 1/8th degree latitude/longitude modeling grid (∼12 km resolution) west of –102.0625 longitude encompassing eleven states: WA, OR, CA, ID, UT, NV, MT, WY, CO, NM, AZ. The spatial resolution of data varies from 30 m (e.g. observed high severity burned area, vegetation) to ∼12 km (e.g. climate, topography). For higher resolution variables, we calculated fractional area of each variable within each modeling pixel.
The temporal domain was limited by Landsat image-derived burn severity data (1984–2014). Using land surface and hydroclimate predictors and monthly fire discovery events, we model gridded high severity fire occurrence at a monthly time step. Individual fire records contain the discovery date, which often approximates the ignition date and conditions likely conducive to rapid fire spread (Westerling et al 2006).
The California Energy Commission specified 1961–1990 as a reference period for the four California state climate and vulnerability assessments to date, to reflect average climate conditions prior to significant climate change impacts. We retain the 1961–1990 normal period for consistency and comparability of results with prior work by the authors.
2.2. Burn severity data
We acquired burn severity data from the Monitoring Trends in Burn Severity database (MTBS Data Access 2009, www.mtbs.gov; accessed 12/2008 and 9/2016), resulting in a dataset with a total of 6808 fires (4493 through 2006) coded by discovery date (month, year), using thematic burn severity images comparable across space and time. We used ESRI Arc Macro Language (ESRI 1999) to intersect burn severity data with a 1/8th degree grid, assigning each fire to the grid cell where a majority of area burned. We then calculated fractional area burned in six severity classes (unburned to low severity, low severity, moderate severity, high severity, increased greenness, or unclassified) by voxel (latitude, longitude, year × month) (Eidenshink et al 2007).
2.3. Landscape data
Potential predictors of high severity fire included topographic and ecosystem characteristics. Topographic data (minimum, mean, maximum and standard deviation of elevation, slope, aspect) are 1/8th degree products derived from the GTOPO30 global 30 Arc Second (1 km) Elevation Data Set accessed online from the North American Land Data Assimilation System (LDAS) (http://ldas.gsfc.nasa.gov, Mitchell et al 2004).
We aggregated LANDFIRE existing vegetation type (EVT) and fire regime condition class (FRCC) variables to the modeling grid (Keane and Rollins 2007, www.landfire.gov). We used a reclassification of the EVT layer, extracting only the fractional area of forest types characterized by stand replacing fire regimes (Westerling et al 2011a). FRCC is a metric widely used to prioritize fuel treatments and characterizes ecosystem departure, in terms of vegetation structure and composition, from historical conditions (Hann 2004, Laverty and Williams 2000). We extracted the fractional area of each FRCC class: FRCC1 (departure <33%), FRCC2 (≥33% departure <66%), and FRCC3 (departure ≥67%) (Holsinger et al 2006, Keane and Rollins 2007). For this study, FRCC is fixed in time, reflecting year 2000 observed conditions.
2.4. Climate and hydrologic data
We obtained hydrologic variables simulated with the Variable Infiltration Capacity (VIC) model and gridded climate data used to force VIC from the University of Washington National Hydrologic Prediction System (NHPS) (www.hydro.washington.edu/forecast/westwide/) (Liang et al 1994, Wood and Lettenmaier 2006). VIC calculates daily surface water and energy balances, estimating evaporation from vegetation canopy, bare soil surface, and transpiration by vegetation classes in each grid cell.
Climate data include temperature (Tmax, Tmin, Tave) and precipitation (PPT), while moisture deficit (MD), antecedent moisture deficit derivatives (e.g. 6 month prior moisture deficit), relative humidity (Rh), soil moisture, and snow water equivalent (SWQ) were derived from VIC and the Penman-Monteith equations (Penman 1948, Monteith 1965) on a monthly time step from 1915 present (Westerling et al 2011a, Westerling et al 2011b).
Stephenson (1998) showed that long term average MD and actual evapotranspiration (AET) are biologically meaningful drivers of the spatial distribution of vegetation types over multiple spatial scales. We used these and related variables as proxies for spatial variability in ecosystem and disturbance regime sensitivity to climate, including 30 years (1961–1990) means and standard deviations for Tave, PPT, cumulative MD, and AET. Standard deviations characterize inter-annual climate variability; for instance, higher precipitation standard deviation indicates locations with more dynamic precipitation regimes. We also created a thin plate spline interacting 1961–1990 average MD and AET to indicate biophysical site conditions for plant growth: different forest types fall along the gradient of MD and AET (Hastie et al 2001, Stephenson 1998).
2.5. Occurrence modeling
We employed a multi-step process in modeling high severity fire occurrence. Previous research using parts of this dataset and similar questions used both logistic regression and classification and regression tree (CART) methods, individually and together (Collins et al 2007, Collins et al 2009, Dillon et al 2011, Preisler and Westerling 2007, Westerling and Bryant 2008, Westerling et al 2011a, Westerling et al 2011b). The number of potential predictor variables available for this analysis was 85. In order to limit the number of variables in building a predictive model, we first used a CART (Random Forest package in R; Liaw and Wiener 2002) model to identify the 20 most important variables in predicting fractional high severity. These provided the potential predictor set for developing conditional logistic regression models.
2.5.1. Logistic regression
We developed two conditional logistic regression models to predict high severity fire occurrence. Because MTBS contains only fires >400 ha, there exists an implicit a priori condition for our models: the occurrence of a >400 ha fire. Given this, we set a threshold for the presence of high severity equal to the median value of high severity fraction in the MTBS data, 0.042. Then, given presence of high severity fire, we set a threshold equal to the upper quartile cutoff, 0.1732. We define fires with high severity fraction above this threshold as high severity fires.
To model the probability of high severity fire presence, we use the logged odds, or logit:
where Xj is the set of predictor variables best fit to Model Pa, PPai is the probability of high severity fire presence, defined as the fraction f of high severity fire >0.042 for a given month and grid cell indexed by i.
Similarly, the model for occurrence of high severity fraction >0.1732 is:
where Xk denotes predictors best fit to Model Hi, where PHii is as PPai above. The probability of high severity fire occurrence (conditional on >400 total ha burned) for any month and location is the product of these two model probabilities: PPai* PHii.
The thresholds for high severity fire presence and occurrence are necessarily arbitrary. Our goal was to be as objective as possible, while defining meaningful thresholds for relatively rare events, and to demonstrate the predictability of high severity fires. Our models specifically address the question:
Given that a fire burns >400 ha, and given that high severity fire is present, what is the probability that this is a high severity fire (i.e. in the upper quartile of high severity burned area)?
We use the Aikake Information Criterion (AIC) to evaluate model performance (Aikake 1974, Aikake 1981). The best model optimizes model fit (minimizes AIC) while penalizing excess predictive parameters. We performed leave-one-out cross-validation of the best model. We tested variable importance by calculating probabilities and testing model performance after removing variable groups.
2.5.2. Mapping probability of high severity fire occurrence
We applied both conditional logistic regression models to all WUS voxels, 1984–2014 and calculated annual probability of high severity fire occurrence for each pixel by summing monthly values. We also calculated the coefficient of variation (CoV) in the annual probability values for each grid cell for the period 1984–2014. Here CoV measures inter-annual variability in conditional probabilities, quantifying spatially varying sensitivity to fire-year climate variables.
3. Results
3.1. Trends in high severity fire occurrence
We tested trends for WUS, each state, and each month. We found no significant trend in WUS high severity fire occurrence over 1984–2014, except for Colorado (table S1 available at stacks.iop.org/ERL/12/065003/mmedia). While some studies have shown increasing fire season length, we saw no significant increase in high severity fire occurrence by month, May through October (figure S1). We found no correlation between fraction of high severity fire and total fire size, meaning increasing large fires does not necessarily increase fractional high severity fire area.
Seasonal occurrence of high severity fire coincided with WUS burned area (figure S1). However, the fine-grained distribution of high severity fire is quite variable. California and Idaho had the largest number of large fires and high severity fire occurrence, but many fires had no presence of high severity fire. Both Montana and Wyoming experienced fewer large fires than other states, often with no high severity fire present (figure S2).
3.2. Occurrence modeling
The best predictive models for high severity fire presence included all variable groups—climate, topography, and vegetation (table 1). Pixel mean and maximum elevations are the only topographic variables in the best model. Climate normals include standard deviation of 1961–1990 cumulative annual water-year precipitation and moisture deficits and the thin plate spline interacting long term average MD and AET. Fire-year climate variables included average spring temperature (SPRT), average monthly temperature and normalized monthly moisture deficit at fire discovery (MD0), and MD the previous November (MD2).
Table 1. List of predictors used in two conditional logistic regression models.
| Variable Group and Description | Model Pa | Model Hi |
|---|---|---|
| TOPOGRAPHY | ||
| Elevation: | ||
| maximum | y | |
| mean | y | |
| CLIMATE | ||
| 1961–1990: | ||
| Average temperature, mean and standard deviation | y | |
| Cumulative annual moisture deficit, standard deviation | y | |
| Culuative water year precipitaiton, standard deviation | y | y |
| Thin plate spline of 30 years average moisture deficit and evapotranspiration | y | y |
| Previous November moisture deficit | y | y |
| Normalized moisture deficit, month of fire | y | |
| Spring average temperature | y | y |
| VEGETATION | ||
| Fractional cover of forest with stand replacing fire regime | y | y |
| Fraction of FRCC3 | y |
Our best models included two vegetation variables. Fractional area of forest types with stand replacing fire regimes was important for Models Pa and Hi, while fractional area of FRCC3 was significant only in Model Pa.
Removing fire-year climate, our models do not predict extremes in inter-annual variability of high severity fire occurrence. Removing vegetation variables does not significantly alter predicted vs. observed high severity fire occurrences (high severity fire occurrence in vegetation-only models still varies with time because it is conditional on observed fires). Fixed site-specific variables describe a constant spatial distribution for probability of high severity fire given a large fire, identifying location and average recurrence rates for fire regimes where high severity fire occurs. While all model iterations perform well with regard to prediction vs. observation for locations with fires, the AIC is lowest for the full model (table 2, figure 1).
Table 2. Performance statistics for logistic regression models. The delta AIC value is the difference between the full model and models with variables removed. Lower AICs indicate better model performance.
| AIC | ΔAIC | Adjusted R2 | Cross validated Adjusted R2 | CV pearsons r Predicted v Observed | ||
|---|---|---|---|---|---|---|
| Full Model | Model PA | 7799 | — | 0.811 (p 3.16e-12) | 0.715 (p1.32e-9) | |
| Model Hi | 6425 | — | 0.647 (p 2.99e-8) | 0.438 (p 3.0e-5) | 0.676 | |
| No Vegetation | Model PA | 7888 | 89 | 0.820 (p 1.60e-12) | ||
| Model Hi | 6554 | 129 | 0.575 (p 4.70e-7) | |||
| No Fire Year Climate | Model PA | 7943 | 144 | 0.817 (p 1.99e-12) | ||
| Model Hi | 6534 | 109 | 0.633 (5.47e-8) | |||
| No Veg/No Climate | Model PA | 8030 | 231 | 0.821 (p 1.40e-12) | ||
| Model Hi | 6690 | 265 | 0.582 (p 3.68e-7) |
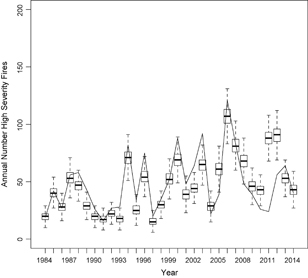
Figure 1 Observed number of fires with high severity fraction >= 0.1732 (line) plotted against 1000 binomial draws using the cross-validated conditional logistic regression probabilities (boxes show inter-quartile range and whiskers 1.5x inter-quartile range) for all voxels with high severity fire. The model was built with data from 1984–2006.
Download figure:
Standard image High-resolution image3.3. Mapping probability of high severity fire occurrence
To illustrate effects of variable groups, we mapped differences for two years with few (1991 [N = 16] and 1997 [N = 10]) and two years with many (1996 [N = 75] and 2000 [N = 88]) high severity fires (figure 2). Removing fire-year climate produces probability maps with a negligible shift in WUS average probabilities for high severity fire occurrence, but with distinct regional differences (figure 2). For the low year 1991, removing fire-year climate increases the maximum predicted probability from 79% to 90%. For 1996, a high occurrence year, removing fire-year climate increases the maximum from 76% to 90%. Probability of occurrence decreases over California; this pattern is opposite the Northern Rocky Mountain and North Cascade regions, where probabilities increase when we remove fire-year climate.
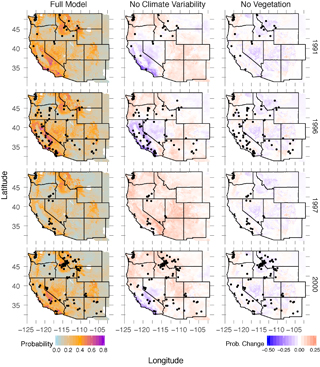
Figure 2 Probability of high severity fire occurrence over the western US for two low fire years (1991, 1997) and two high fire years (1996, 2000) with actual high severity fire events shown. Circles are large fires with high severity fraction >= 0.1732. The left column shows the probability for the full model (Pa*Hi). Difference maps for the models with the fire-year climate and vegetation variables removed are shown. Positive difference values indicate that the probability increased when the predictor set was removed; negative values indicate a decrease in probability.
Download figure:
Standard image High-resolution image4. Discussion
4.1. Inter-annual variability and trends in high severity fire occurrence
Our results highlight the importance of inter-annually varying climate for high severity fire occurrence. Fire-year climate significantly modified conditional probabilities of high severity fire occurrence across the WUS, though with stronger effects in Sierra Nevada and Southwest forests with mixed-severity fire regimes than in Northwest and Northern Rockies forests with high severity fire regimes.
Others have shown a lengthening fire season and increasing large fire occurrence and burned area due to climate change (Westerling et al 2006, Dennison et al 2014, Jolly et al 2015, Westerling 2016). While conditions under which high severity fires in our record burned were warmer and drier than the long term average (figure S3), the lack of observed trends in fire severity occurrence (table S1) may be at least in part due to the short record, which begins right at the time of the largest temperature-driven increase in WUS forest burned area (Westerling et al 2006).
Similarly, the record for fire severity begins >70 years after the start of fire suppression. Ecosystems with short fire return intervals (7–10 years) may have missed up to 10 fire cycles by the time the MTBS severity record begins, while those with longer fire return intervals may have missed few or none, so we would only expect to see changes in severity due to fire suppression and fuel buildup on some of the landscape. Observed patterns of high severity fire occurrence may be influenced by changing climate and management, but without more observations, we can not quantify significant trends in high severity fire occurrence.
4.2. Mapping high severity fire occurrence
Our best models included both climate and land surface characteristics, e.g. topography and vegetation, to predict fire severity. The impact of removing vegetation or fire-year climate predictors is subtle. Considering first removing temporally fixed predictors such as fractional area in FRCC3 and in forest types with high severity fire regimes, inter-annual variability of model predictions is not significantly affected. Spatially, effects are most pronounced in mountainous areas, as one of the variables is forest fraction with high severity fire regimes (figure 2). We see a general decrease in probability of occurrence in the Sierra Nevada, western Nevada, and Northern Rocky Mountains. Both the Colorado Rocky Mountains and the Northern Cascades in Washington generally show a higher probability of high severity fire occurrence when we remove vegetation variables.
When we remove fire-year climate variables, conditional probabilities of high severity fire generally decrease in California and Nevada, but increase in the Pacific Northwest and Northern Rocky Mountain regions (figure 2). Many of the ecosystems in the Pacific Northwest and Northern Rocky Mountains are dominated by cool moist forests with historically infrequent stand replacing fire (Agee et al 1977, Agee 1993, Cansler and McKenzie 2014, Schoennagel et al 2004). These forests have abundant fuels, but are rarely hot and dry enough to burn. Increased probabilities in these regions after removing fire-year climate reflect climate's importance in determining whether these forests will burn and supports findings that fire-year climate controls severity occurrence in this forest type (Cansler and Mckenzie 2014, Schoennagel et al 2004). Previous studies found fire-year climate less important than topography and vegetation as a predictor of high severity fire occurrence in the North Cascades and Northern Rocky Mountains (Cansler and McKenzie 2014, Birch et al 2015, Dillon et al 2011). Our results indicate that in these systems with a propensity for high severity fire, fire-year climate still modulates high severity fire occurrence.
Probability maps show fire-year climate both amplifies and moderates probabilities of high severity fire based on biophysical site characteristics. Fire-year climate anomalies are highest for many high occurrence fire years: Tave, SPRT, MD0, MD2 (figure S3). November MD (MD2) is an indicator for moisture stress early in the water year; Van Mantgem et al (2013) found that high pre-fire climatic water deficit is related to increased post-fire tree mortality. These variables all indicate high severity occurrence years are drier and hotter than average, conditions that increase fuel flammability and enhance conditions for fire spread.
While climate variability significantly affected conditional probabilities of high severity fire, those probabilities are conditional on fires >400 ha. Though the predictive maps for years like 1991 and 1996 look very similar in terms of conditional probability of high severity fire occurrence, the actual fire record is quite different. The number of fires in the MTBS record for 1991 was 75 total (16 high severity) v. 272 total (75 high severity) fires for 1996. While ignitions resulting in large fires were few, modeled probabilities indicate that had more large fires occurred, high severity fire would have been likely in 1991.
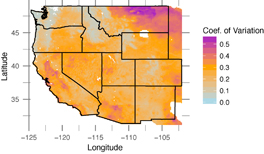
The inclusion of inter-annually varying climate is critical for capturing high probability episodes in areas where fire severity is highly variable, especially California and the Southwest, where the coefficient of variation (thus influence of climate) is higher (figure 3). Our models imply substantial fraction high severity fire in mixed severity fire regimes requires more extreme climatic conditions. Conversely, in the Northern Rocky Mountain and Pacific Northwest, regions that are dominated by cool moist forests with high severity fire regimes, the coefficient of variation (and effect of climate) is lower.
Figure 3 The coefficient of variation for annual number of high severity fire occurrences (sum of monthly probabilities). Higher values show us where the probability of high severity fire occurrence is more sensitive to annually varying climate.
Download figure:
Standard image High-resolution image
Our results are similar to Dillon et al (2011) regarding the importance of topography, but differ with respect to the importance of fire-year climate and the ability to predict extremes in high severity fire occurrence. This is likely due to differences in methodology and data. In our study each fire is classified as a high severity fire or not. Dillon et al (2011) selected a random subset of individual 30 m fire pixels classified to high severity or not. This means that they could select multiple pixels from a single fire with different classification, whereas their climate data would be identical for pixels from a given fire.
Dillon et al (2011) tested different independent climate variables, which could also lead to the differing conclusions. For each fire, we used hydroclimate variables for the voxel where the majority of area burned. Dillon et al (2011) interpolated monthly temperature and precipitation for the central latitude, longitude and mean elevation of each fire. Their soil moistures were simulated with VIC, as were our hydroclimate data, but at coarser scale. We also test a larger set of hydroclimate variables. Comparing approaches, we expect theirs would have more power to describe topographic controls on fire severity, whereas the present study may be better suited to demonstrating climatic controls.
5. Conclusions
While conditional probabilities of high severity fire occurrence are partially determined by biophysical setting, existing vegetation and fuels, our models demonstrate fire-year climate amplifies or moderates risk of high severity fire occurrence given ignition and growth to at least 400 ha burned area, and is important for predicting extremes in high severity fire occurrence. These models could be used with others that predict large fire occurrence to plan for resource allocation or mitigation efforts, or to assess how high severity fire occurrence might respond to changing climate and fuels management.
The importance of hydroclimate variables, especially fire-year climate, suggests further improvements could be achieved with finer scale, more realistic data, especially in mountainous terrain where climate varies greatly with topography. Hydroclimate was simulated in VIC with a static vegetation layer. Sensitivity analyses of large vegetation changes in VIC did not result in large changes in MD or AET (unpublished, AL Westerling personal communication); newer-generation hydrologic models might improve simulations. Additionally, FRCC that more closely represents individual fires or that could be combined with fuel availability might improve its value as a predictor.
Because probabilities modeled here are conditional on large fire occurrence, they need to be coupled with models of large fire occurrence in order to predict high severity fire occurrence. As with all models, ours has limitations, but its performance is robust. This is the first study to use the entire MTBS database to examine patterns in high severity fire, identify the importance of fire year climate, and predict extremes in high severity fire occurrence conditional on large fire occurrence.
Acknowledgments
This research was supported by the California Nevada Applications Program under NOAA grant no. NA110AR4310150, California Energy Commission grant no. 500-14-005, and by the USDA Forest Service under award no. 14 C S-11052006-025. We thank Jeanne Milostan for assistance in processing hydroclimate data. We thank Jessica Blois and Lara Kueppers for thoughtful comments that improved the manuscript. We also thank the reviewers for their insight to better the manuscript. Any errors or omissions are our own.