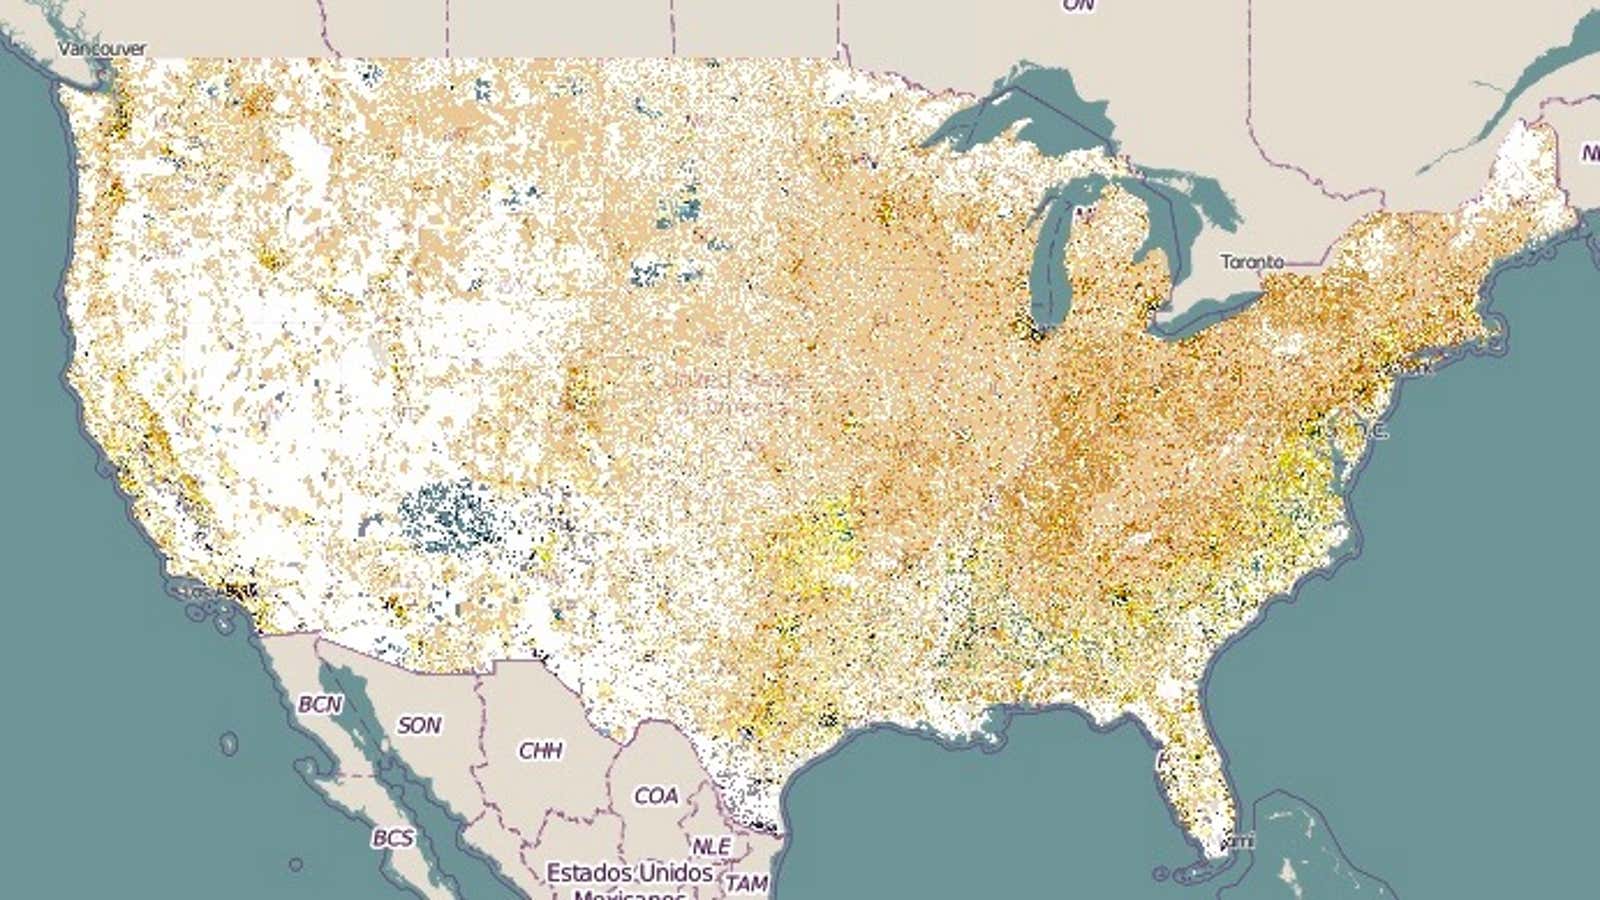
Tomasz Stepinski used to be focused on Mars, mapping its craters algorithmically. Now the astrophysicist and mathematician is into his home planet, Earth. His latest project is an incredibly detailed map of the US that shows shifting racial diversity down to the neighborhood.
The free map tracks racial diversity spatio-temporally by laying census data from 1990 to 2010 over detailed grids from NASA satellite maps. The method was recently publicized in the journal Plos One, and on April 27, Stepinski will present his work at the annual Population Association of America conference in Chicago.
Stepinski jokingly told Quartz he’s slightly nervous about being the only astrophysicist in a room full of social scientists who don’t necessarily love math. He occupies an unusual role—he’s a professor of space exploration in the University of Cincinnati’s geography department.
Coming from physics, he’s comfortable with deep computational analysis, so Stepinski applied his understanding of outer space crater mapping to Earth’s neighborhoods. Most sociologists are not trained to think about information analysis mathematically, Stepinski found. “Population data was outdated and I had an idea for how to improve it, which involved a huge calculation. Algorithmically, we produced a new layer of data,” he says.
The map—which allows users to zoom in and check out their neighborhoods—provides a previously unseen view of how the racial composition of neighborhoods is changing in the US. ”People don’t realize that the United States is a diverse country but at the same time is still very segregated,” Stepinski says.
Over the course of his research Stepinski has found that, generally, white neighborhoods are increasingly diversified but that Asians and Hispanics seem to be clustering together in pockets scattered across the US. Meanwhile, predominantly black neighborhoods have not experienced much diversification over the past several decades.
But more recently built neighborhoods are also more likely to include racial diversity. “Empirically speaking, however, new neighborhoods are more diverse,” according to Stepinski. All of this indicates that, to the extent that Americans are segregated, how they’re segregated seems to be changing.
Perfect for social scientists, journalists, government, and whoever else might be interested, Stsepinski’s map is meant to democratize information and make it generally available. He plans to update the map with new Census data in 2020.
Some day, his methods could also be applied to obtain even more details—showing income and age, for example.
As it stands, the map can help social scientists better understand the national landscape. Jeffrey Timberlake, an associate professor of sociology at the University of Cincinnati, whose research focuses on urban inequality and residential segregation explained the map’s impact in a statement: ”If you put the population geography together with an understanding of the social meaning…you can tell a pretty powerful story. This is the kind of tool that could unlock a lot of research.”
Stepinski acknowledges that while the free flow of information is ideal, his map could also be used for less educational purposes. Arguably, it could enable racism, for example, by helping potential property owners seek demographic information that real estate agents are not legally allowed to provide.
Nevertheless, he believes the information will do more good than harm. On a personal level, Stepinski noticed that the major cities where he has lived—Tucson, Arizona, Houston, Texas, and Cincinnati, Ohio—aren’t very racially diverse. Today, he happens to live in the only neighborhood in Cincinnati where there is no single dominant race, according to his map, and is very pleased with the fact. Notably, he says he found his home based on criteria having nothing to do with this work, however, and everything to do with commuting and convenience.
