
Most growth communities, forums, and email lists will inevitably have that thread that goes:
“Hey, what are the benchmarks everyone’s seeing for X?”
I constantly find people seeking out benchmarks or pointing to benchmarks, and we’ve all been there -- who doesn’t want some normalizing data to understand whether we’re on track or not?
The desire is further fueled by many companies releasing “benchmark reports.” I understand why. It makes for sexy content marketing.
But there’s one small issue:
Growth benchmarks are mostly useless. There is a better way, which I'll outline below.
Now, back to benchmarks... we can plot most benchmark information on the below 2X2 matrix:
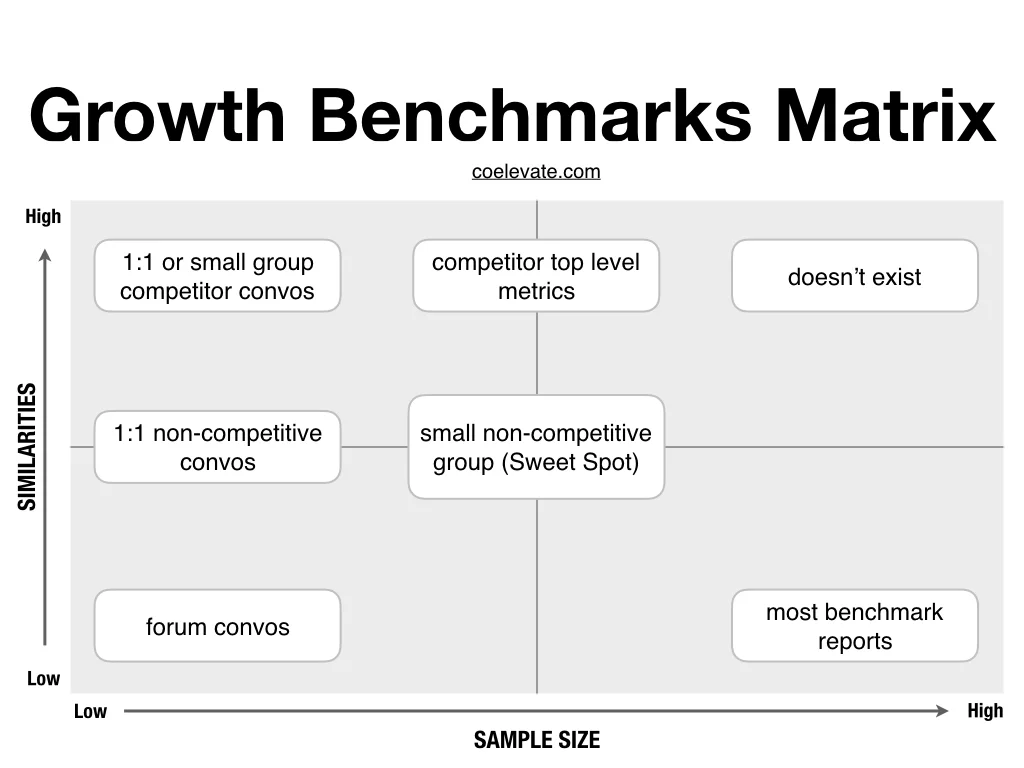
On the X-Axis, we have sample size, representing the number of data points included in the benchmark.
On the Y-Axis we have similarity, representing how similar the data-producing sample group is to your own product, business, and channel. High similarity would mean that the sample group has the same target audience, a similar product, and a similar business model.
There are tons of benchmark reports and intelligence tools out there, and I use to recommend a handful whenever I’d get asked the inevitable question about benchmarks.
But the more I thought about the question, the more I realize that these posts and tools are not that helpful. To assess when and how benchmark data can aide growth, let’s go through some common sources of benchmark data and where they fall on the matrix.
Benchmark reports
Most benchmark reports live in the lower right hand quadrant of the matrix.

They usually draw on a larger sample size, but that sample size scores low on similarity to your business. In the best case scenario, the sample might represent an industry category, but will still include lots of data points for audiences or business models that are completely different from yours.
There are a bunch of problems with your typical benchmark report, so let’s go through them one by one:
1. Aggregated noise
Most benchmark data present aggregate numbers of their entire sample. The problem is that typically 80%+ of the sample are usually low quality applications or companies. This generates an incredible amount of noise in the data. Most of the people reading this article are probably trying to build venture backed businesses. By definition to be a venture backed business you need to be in the top 10% or a complete outlier.
2. Averages are useless
Most benchmark reports show you metrics in the form of averages, medians and standard deviations. Averages / medians will be skewed towards the high number of low quality apps since they are more numerous in the sample. The result is that the benchmark stat that ends up being presented is well below where you actually need to be in order to be a high growth company.
Aggregate stats across a category can help you get a general understanding of what to expect in that category, but their utility stops there. If you are hitting "average" within the category, then you are are probably not a venture-backable business.
If you are benchmarking, you naturally want to benchmark against best-in-class competitors, not an aggregate average of a category, but your benchmark report or tool may not show that spread.
For category-wide performance data to be useful, you would need a segmented average of apps, sites, or business that have a combo of similarities with one another, that you also share. That level of granularity and accuracy typically doesn't exist in publicly available or purchasable form.
3. Same metric, different measurement
CAC is CAC, LTV is LTV, Churn is Churn, right? Nope.
Different businesses measure the same metric completely differently even if they are in the same industry category. I’ve never seen a benchmark report that takes this into account. They usually just ask, “What is your CAC?”
Different products and business models require different ways to measure customer acquisition cost, and other key metrics that often show up on benchmark reports as uniform.
Averaging or lumping together CAC can be extremely misleading because it doesn’t take into account your company or product’s specific business model. For example, if you have multiple tiers in your SaaS product, average CAC is a lot less actionable than CAC sliced by your different customer segments (with each segment paying different subscription fees).
4. Incomplete picture
The third issue we face with industry benchmarks is that these reports and tools often aren’t able to provide enough context on the sample set since they need to keep the data anonymous -- which apps or products were included, what categories were covered, or the reasons behind their performance.
We end up with a deceptively incomplete picture that shows lots of data but delivers few answers. You might get retention numbers, for example, but you have no idea what their acquisition looks like. One piece of the puzzle leaves an incomplete puzzle.
What to do instead
Now that I’ve bashed on benchmark reports enough, I should say that they can be OK as a starting point, if you also do the following:
1. Take it with a grain of salt
2. Ignore non-segmented benchmarks
3. Only look at the top 10% or upper outliers, if you can identify them
4. Contextualize as much as possible
And of course, always prioritize your own numbers when you have enough data.
Learn Growth, No Fluff. One Email Per Post.
Forum convos
The next most common benchmark source lives in the lower left hand corner.

I call these “forum convos.” These are small group discussions with others with low similarities to your business.
Sadly, forum convos aren’t helpful because of 3 reasons:
1. Low similarity
The other reference points have so many differences in relation to your business (product, audience, model) that it’s comparing apples to oranges.
2. The problem of averages again
They are typically giving you average numbers for their business which contains all the flaws of averages.
Again, what you would want instead are segmented numbers, but you typically won’t get that in conversations like this.
3. Lack of context
Forum convos tend to be casual exchanges with little to no context on performance history, additional factors such as other channels, brand, and key metrics, not to mention the basic who/what/why behind the performance data being presented.
What to do instead
Forum convos can be fun, but ultimately aren’t that useful. As practitioners we commonly get caught in the trap of the “grass is always greener:”
“I wish I had the virality of x! Or I wish I had the retention of Y! Or the model of Z!”
Out-of-context forum threads and random data snippets only make it worse.
In reality, our businesses are a unique set of of variables that we need to figure out for ourselves. If those variables fit together mathematically to make a really good business, it matters a lot less how each variable benchmarks against other standalone data from other businesses that may or may not be relevant.
If you are going to have these forum convos, DIG to get more information.
At minimum, ask these two follow-up questions:
- Who is the target user?
- What is the business model?
- Competitive convos
In the upper left hand corner, we have 1:1 or small group data points with extremely high similarity (i.e., competitive) businesses.
Unfortunately these tend to be competitor convos due to the high similarity score. The competitive dynamic means low trust, so the chance of getting reliable, accurate, and updated data is slim.
In some industries tools will emerge to help you get this. For example, during the Facebook Platform days there were a number of data services where you could get metrics like DAU, MAU, DAU/MAU, etc of almost any app on the platform.
But there are a two issues with this:
1. First, it’s rare. The existence and ongoing availability of data services depends on the platform making the data publicly available in some form. The platform can change how they report data at any time, have outages that they aren’t incentivized to fix, or even discontinue availability entirely.
2. Second, you will only get the top level metrics. In the Facebook Platform example above, you could find out MAU, DAU, and their derivatives for a competitive app in your same category, but there’s lots that these top level metrics don’t tell you. Unsegmented data leads to unreliable answers at best.
1 to 1 convos
Now we are getting into the really useful stuff.
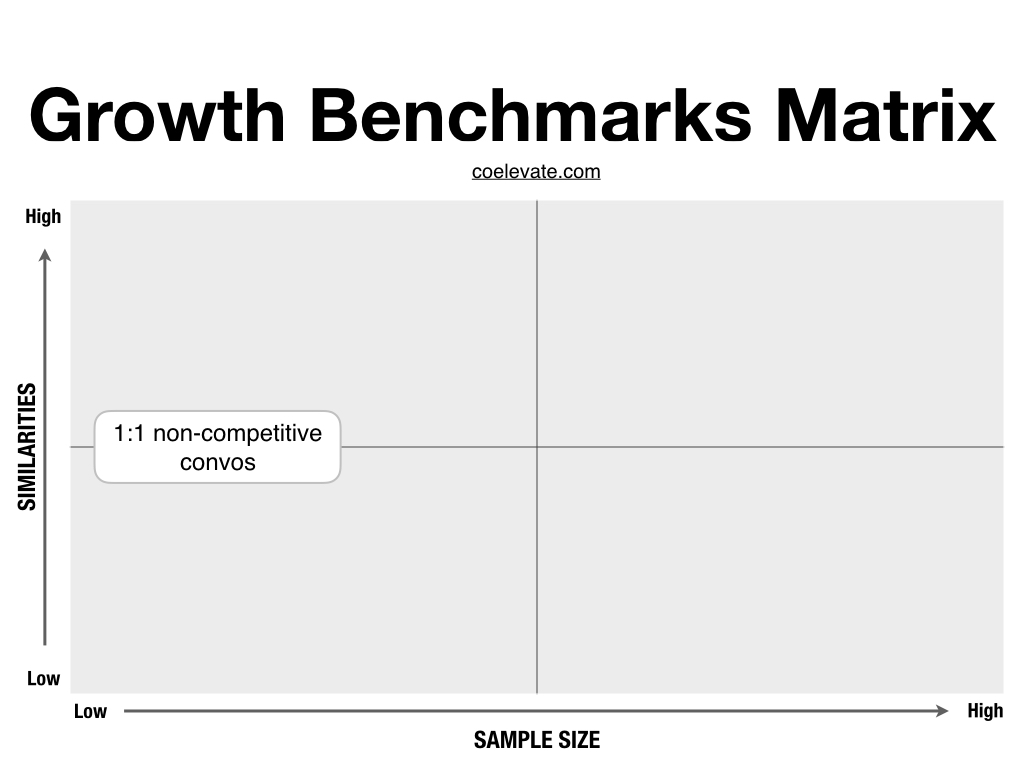
1 to 1 convos work best with businesses that have similarities on one or more of the axes (Target Audience, Business Model, Product), but not all three. The fact that the other business isn’t similar on all three axes means that it’s more likely to be non-competitive and offer mutual benefit to exchanging valuable information in confidence.
Here are two examples.
- If I were Ipsy, I might talk to the likes of Dollar Shave Club, Stitch Fix, or Nature Box. (similar model, subscription, but different target audiences and product)
- If I were Pinterest, I might talk with LinkedIn, Facebook or another social product about shared challenges like the logged-in/logged-out experiences or other common pieces of the product. (Similar product and model, social/ads, but different target audiences)
The biggest downside to the 1 to 1 convos is the sample size. As deep as the conversation may go, remember that it is only one data point. This is like trying to get a view on a 3D object but only looking at one dimension.
What to do instead
1 to 1 convos can still be helpful and a valuable source of a deeper benchmark that also doesn’t require that you close with a direct competitor.
To make sure it’s valuable, keep the following in mind:
1. Contextualize, contextualize, contextualize
Think hard about the product value prop, target audience, and other elements that might impact the numbers. For example Dollar Shave Club and Ipsy both are subscription ecommerce products with similar cadences, but there are two big differences:
- Value prop - DSC is more of a utility, Ipsy is more discovery
- Target audience - male vs female
Both those things will naturally influence all numbers.
2. Get the complete picture
Try to get segmented numbers as well as a holistic view, not just one number in isolation.
3. Get the ‘Why’
It’s critical to ask “why” they think something worked or didn’t work. Asking “why” leads to learnings that you can apply back to your product, rather than numbers that are specific but not actionable.
The Sweet Spot
The sweet spot is if you can form a group of non-competitive businesses with similarities on those axes we talked about.

It has all the advantages of the 1:1 convos, but with a slightly larger sample size. That larger sample size allows you look at the picture from multiple angles, and to triangulate your data. This ultimately leads to more useful insights for everyone.
Build relationships with the best
I used to do this in Boston with "mastermind" groups. In my experience, it is the only way to get reliable, non-noisy, benchmarks for where you aspire to be.
It sounds simple (“Just get together a group!”) but getting it right requires the right setup and ground rules. Below are the four takeaways that I learned from my Boston groups.
1. Start small
It starts with just 2 to 3 people you know in your network. Explain what you’re trying to do and organize a meetup with that initial group. If you don’t have anyone within your existing network for that initial group, you can cold email.
2. Share your own knowledge first
You should do the initial work to seed conversation by creating a presentation that shares some insight, learning or experiment that you have been running lately. If you cold-email, the value-add of this presentation needs to be even bigger.
3. Confidentiality + warmup
Set an expectation that everything is confidential. To warm up the conversation, you can start with an easy discussion prompt, like:
- One thing you’ve tried recently that has worked
- One thing that hasn’t worked
- What was the learning
- One question or problem you are facing
This is something simple that people can spend 20 minutes on and everyone can participate in without revealing too much. It has a low barrier and still kicks off a good conversation where people are both giving and receiving.
4. Expand the group
Once you’ve had a couple successful meetings with that small group, ask each member if they know one person they’d like to invite in. This turns the work away from you to others.
5. Rotating ownership
Once there is a rhythm, rotate “ownership” of the meeting between members of the group. Ownership is figuring out a location, general theme topic, etc.
6. Regularity / repeat
Rinse/repeat about every one to two months. Repeat exposure is key to building trust and deeper relationships.
7. Expand the axes
Rinse and repeat steps 1 through 6 across different axes of similarity. For example, you might have one group where the model is the common theme (i.e. subscription) and another where the common theme is a channel (i.e. paid acquisition) or another that is target audience themed (i.e. SMB).
Conclusion
With all their flaws, industry benchmarks can still be an OK starting point for gauging the health of your product or business, but building up a group of experienced practitioners who share both commonalities and helpful differences from one another is the most important pillar of continual mastery of growth, or any other discipline.

Comments