I'm a bit of a stats junkie, but what I love more than a giant pile of charts and tables are tools that can actually help me understand my stats at a high level. I've reviewed such services in the past and have also blogged about my own experiments building dashboards and other views on top of Google Analytics. Earlier this month I was contacted by the folks at PaveAI.
This is a commercial service (with a free trial!) that provides scheduled reports on your analytics. Typically weekly or monthly (or daily for folks with a lot of traffic), the service will spit out a PDF of analytics about your - well - analytics. I was given a complimentary report (that I've attached below), but I thought I'd share some screen shots from it to call out what I thought was really cool.
I'll begin with the first page, the Overview.

Nice, clear, and not more than I can get from Google Analytics, but definitely a bit quicker to read.
But then it dives quickly into analyzing my visitors:

That's kinda cool. But then it showed me this:

So the red arrows there are - obviously - from me - but note how it didn't just show a bunch of graphs, but actually called out some specific, important, things to note about it. I freaking love that.
Later on in the report, I saw this:
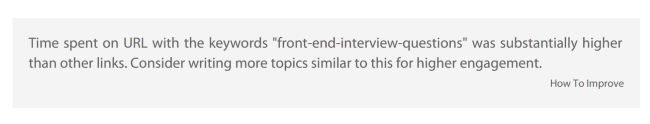
I really loved that. I kinda knew that my front end interview questions series was getting decent traffic, but this really brought the point home. I'm going to look into possibly adding to this more later this year.
Here's another cool stat plus insight:

You get the idea. The service doesn't just present the data in a nicer, easier to read format, it also returns some pretty darn interesting insights. You can find pricing info on the site and it seems pretty reasonable. Note that my report only focused on Google Analytics, they also support integration with AdWords, Facebook Ads, and Twitter Ads as well.
You can download my sample report here: https://static.raymondcamden.com/enclosures/paveai.pdf
Note that I've sent them some feedback about the report you see above. For example, that first page of reports shows deltas but doesn't make it clear it is comparing it to the previous month. I've been told by PaveAI they are already adding that in.