Why Visual Analytics Should Become the ‘New Normal’ in Grocery Retail - Part Two
In the previous post we defined what I mean by “visual analytics”, explored its current usage (or lack thereof) in the retail sector, looked some of the reasons why it is underutilised, and explored why it is such a great fit for retail. In Part 2, I'll propose how these obstacles can be overcome and so make it the standard ("New Normal") method for analysis (and ensuring decisions are fact-based)
How CAN Visual Analytics Become the ‘New Normal’ in Grocery Retail?
Let’s take a retail buyer as an example. Buyers are experts in buying. They have spent their time learning all the facets of being a buyer (negotiation, merchandising, range planning, promotional planning, etc.). Data visualisers are experts in data visualisation, and have spent their time learning the skills of data visualisation (visual perception, data modelling, statistics, cognitive processes...etc.). If they had spent their time learning what each other know, they wouldn’t know what they know and vice versa!
So we have a situation where the buyers knows all the right questions to ask (using their domain expertise), but do not possess the skills to prepare and manoeuvre around the data, to answer those questions. The data visualiser possesses the skills to prepare and manoeuvre around the data without the specific domain expertise to ask the right questions, and doesn’t speak in a retailer's language.
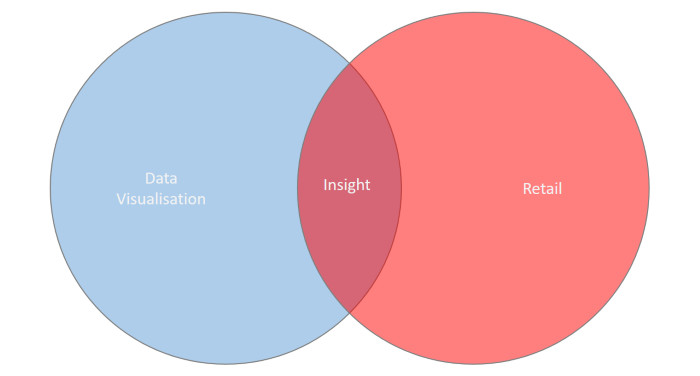
The solution is to have data visualisation experts who have domain knowledge in retail. They won’t have the specific domain expertise of the buyer (I'm not going to know what the Tesco cheese buyer, say, knows about the cheese market and Tesco’s specific strategy for this area). But the general retail knowledge (a retail specialist visualisation analyst has) means they know the things that are important to a retailer, and speak the same "language". This means they know how to create “meaningful” composite metrics, what aspects will be important to include in any visualisation, what is "actionable"...etc.

The above shows a visual representation of this idea. This is a highly simplified view only showing 2 individuals. In reality the “knowledge” and “specialisation” is multi-dimensional (eg. for data viz there are domain expertise in data modelling, design, the science of visualisation, predictive algorithms...etc. and similar for retail where, say, a supply chain manager will have logistic expertise)
So by utilising the knowledge and skills of both, working together (face to face), they are able to leverage each other's knowledge and solve the problems and answer the pertinent questions. This combination of domain expertise (in buying from the buyer, and data visualisation for the data/viz analyst) combined with the domain knowledge from the analyst is an incredibly powerful combination. By far, the most successful projects I’ve worked on have taken this form (generally in a workshop), where we have come to some very deep, powerful, and (most importantly) actionable insights.
In the next part, I will demonstrate (via a real-world example) that by leaning on visual expertise combined with domain knowledge and a buyer’s specific category knowledge, we can answer deep and complicated questions…in minutes.