

Visually complete
Dynatrace redefines digital experience monitoring with Visually complete and Speed index. Businesses and IT need reliable benchmarks to know what a good customer experience looks like. Until now, it’s been impossible to see and capture the visual experience of a real user. With Visually complete and Speed index, Dynatrace provides metrics that are as close to a real user experience as it can get.
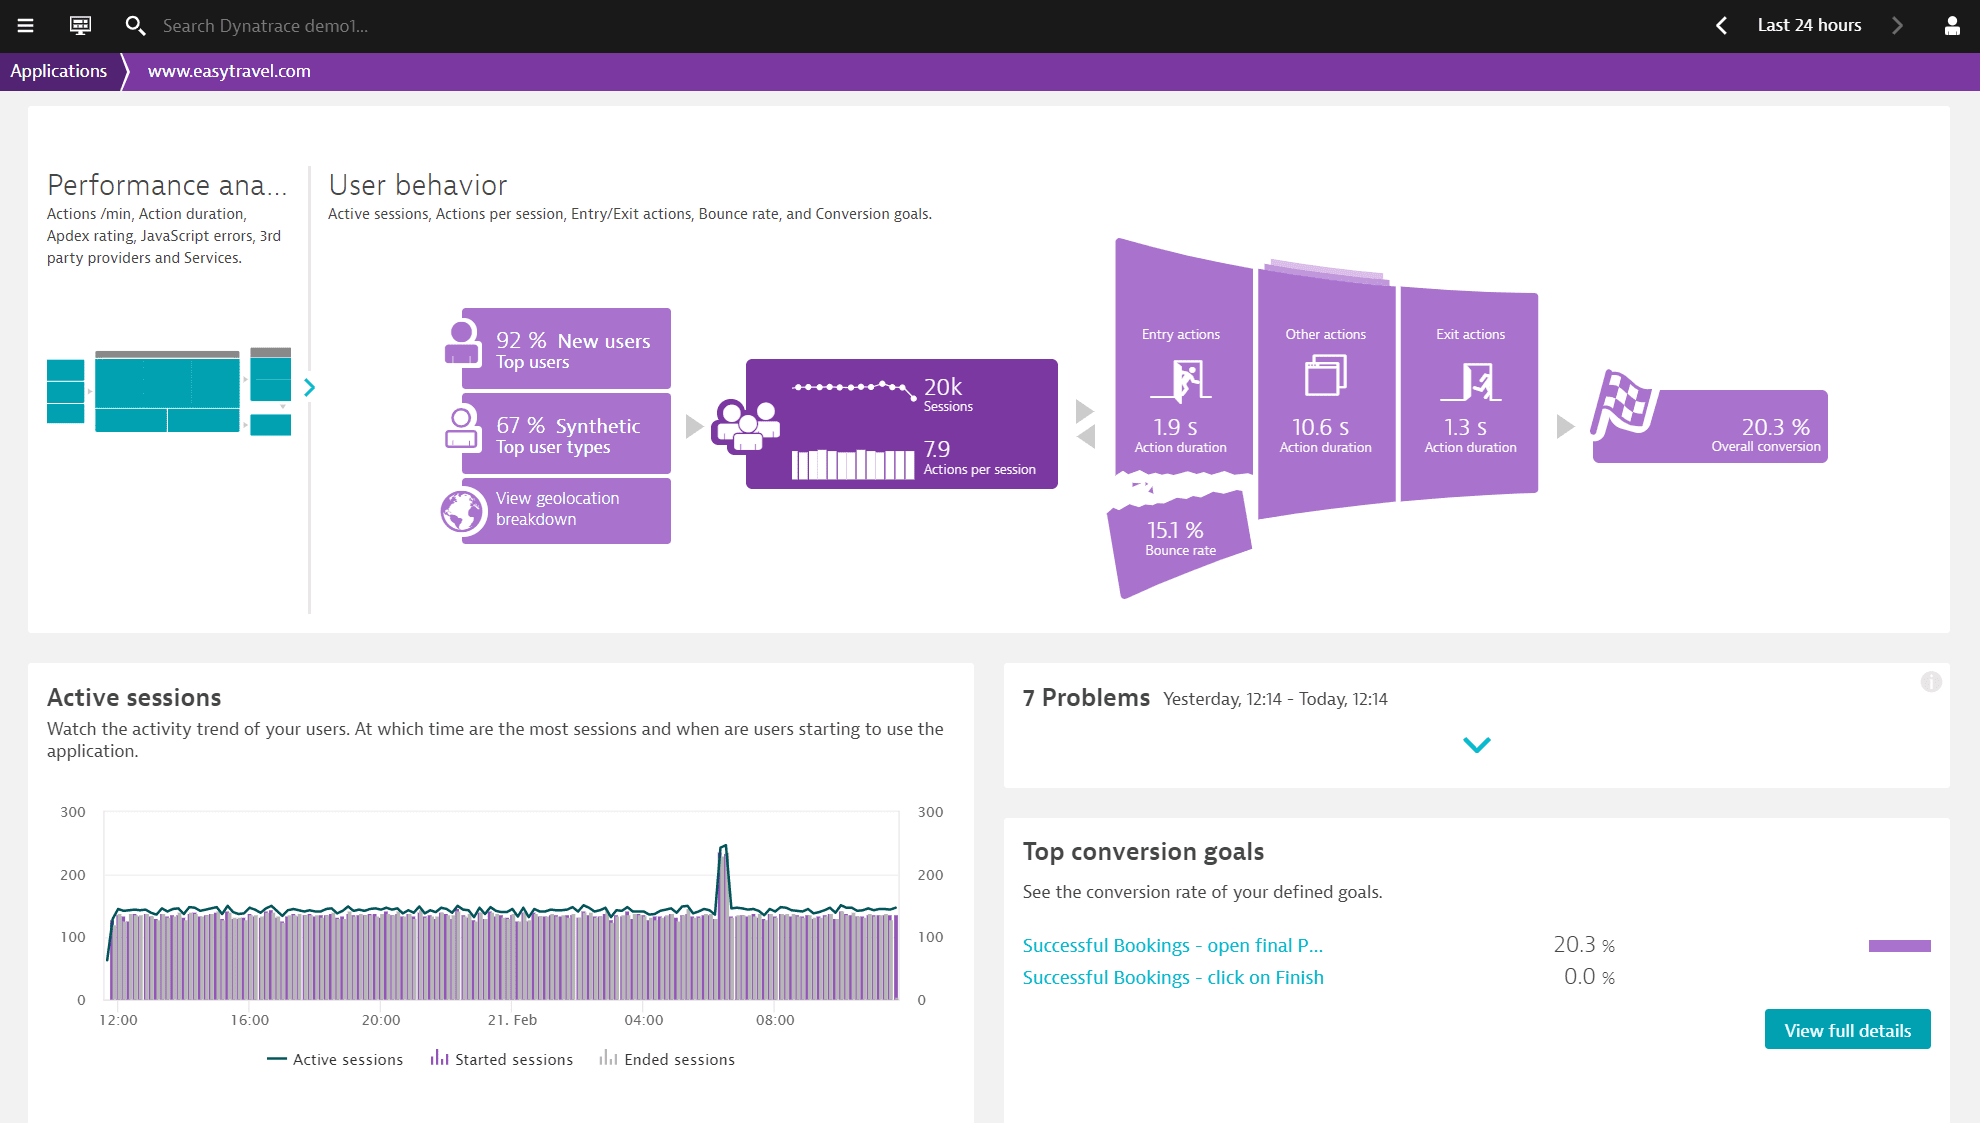
See your web application through your users’ eyes
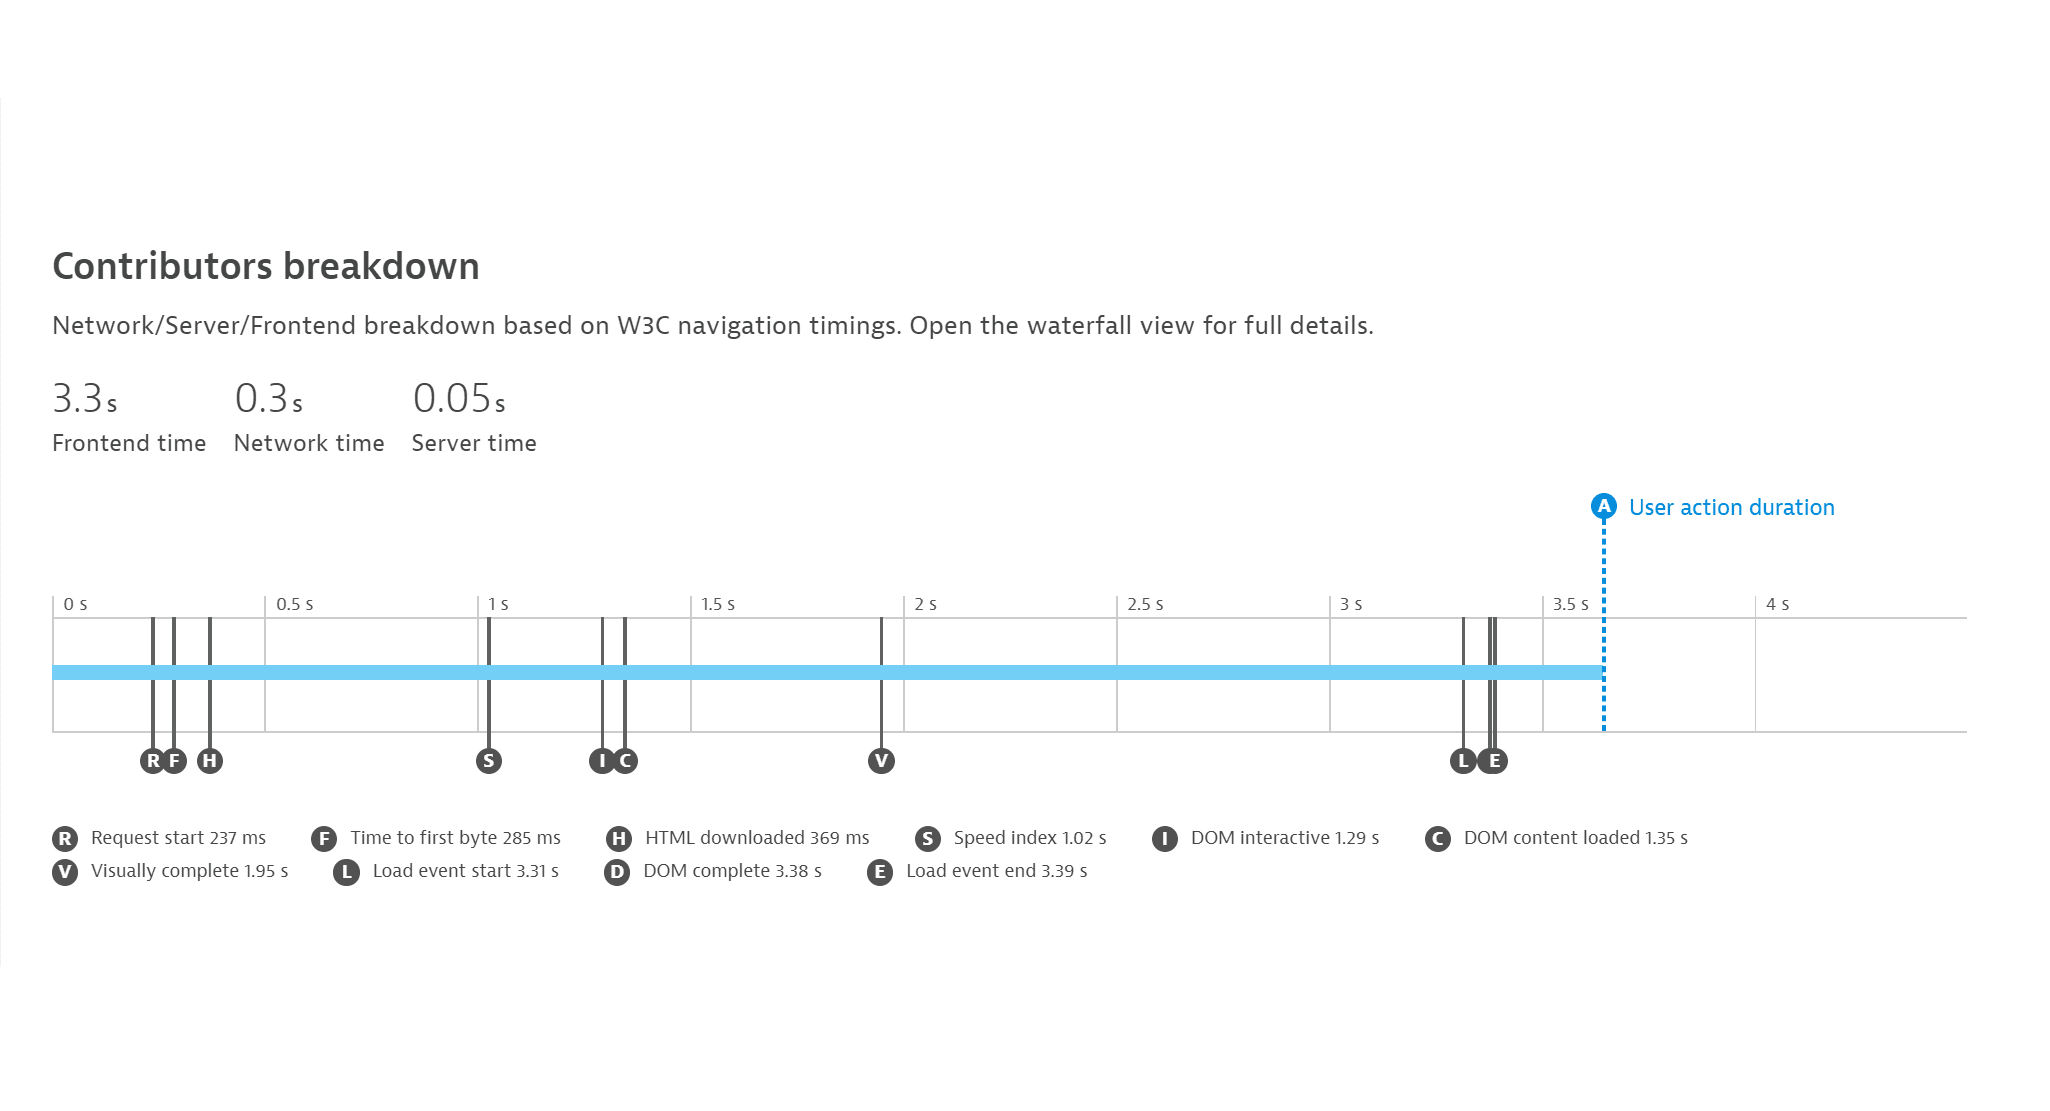
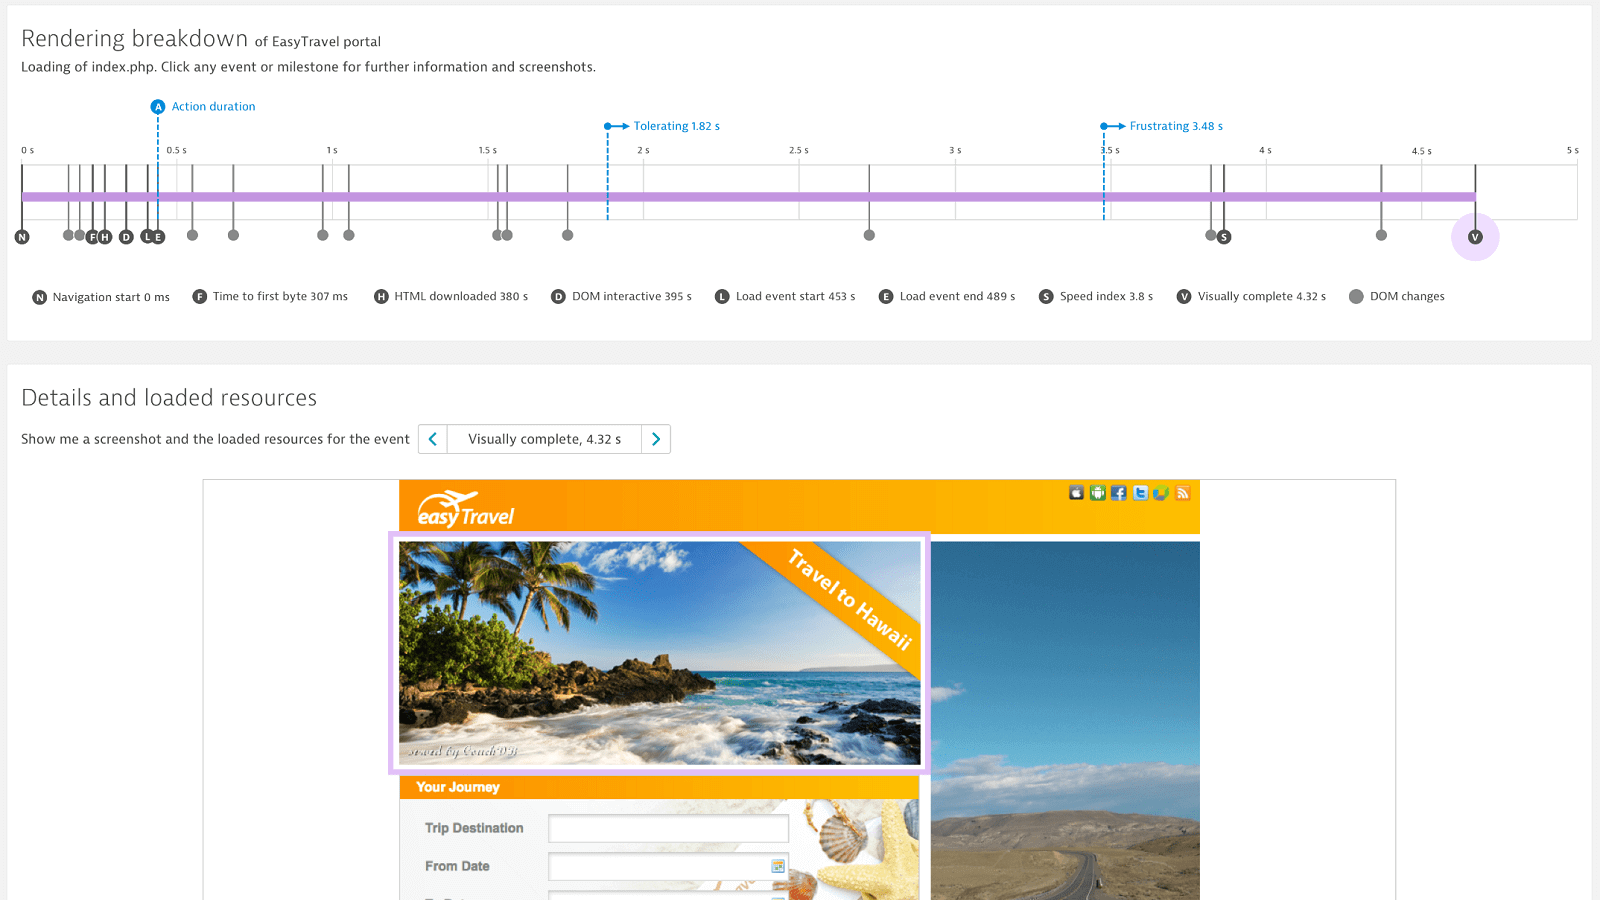
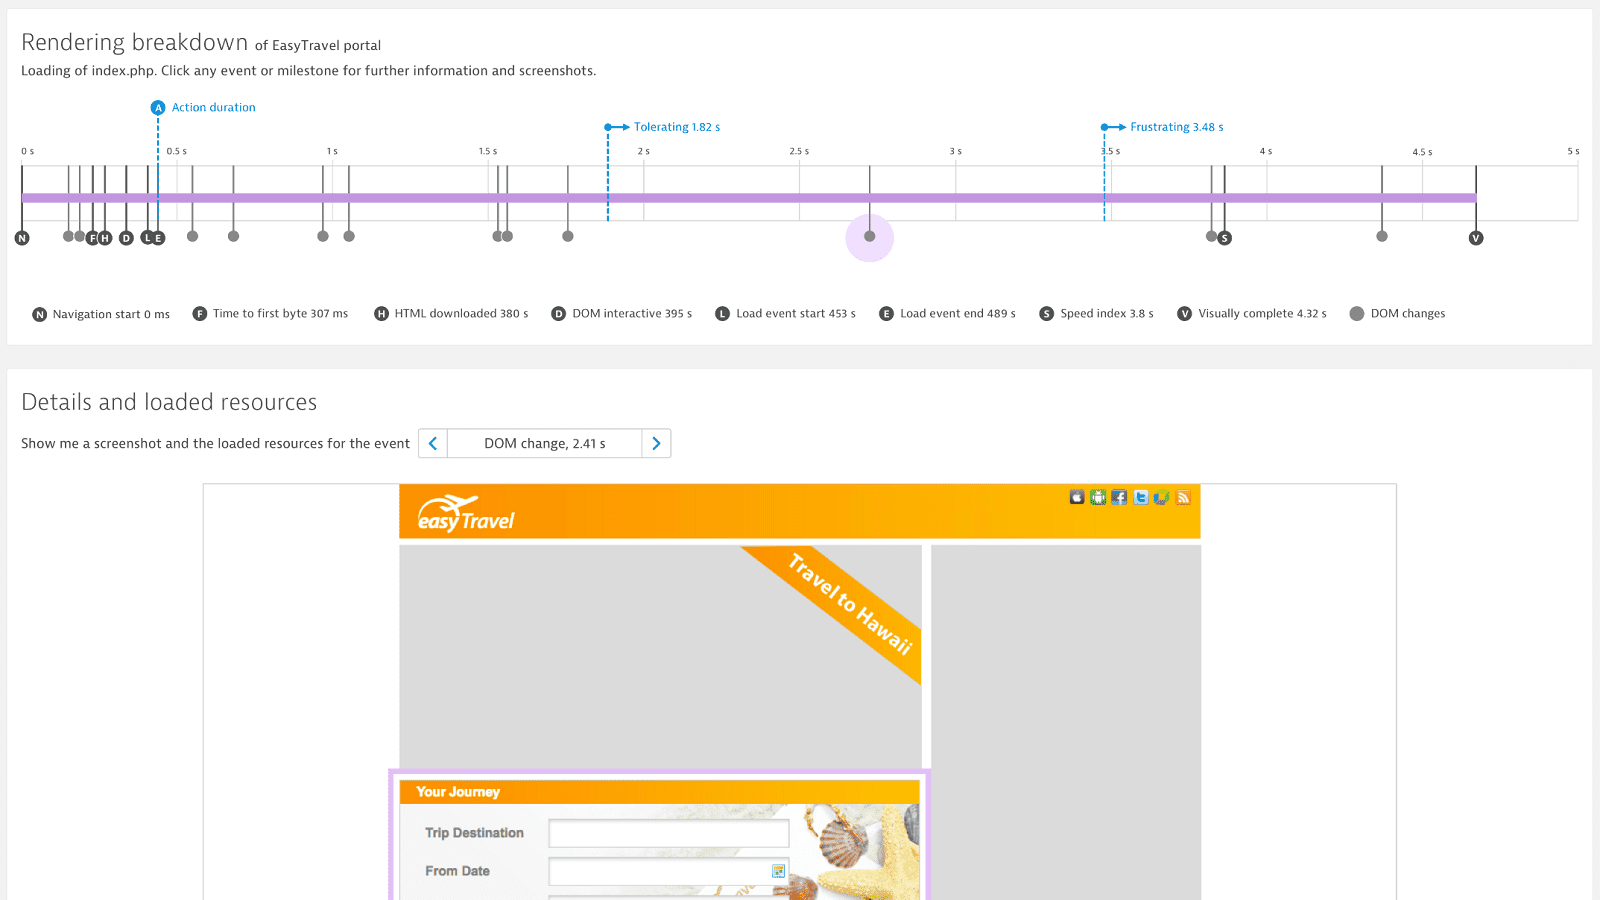
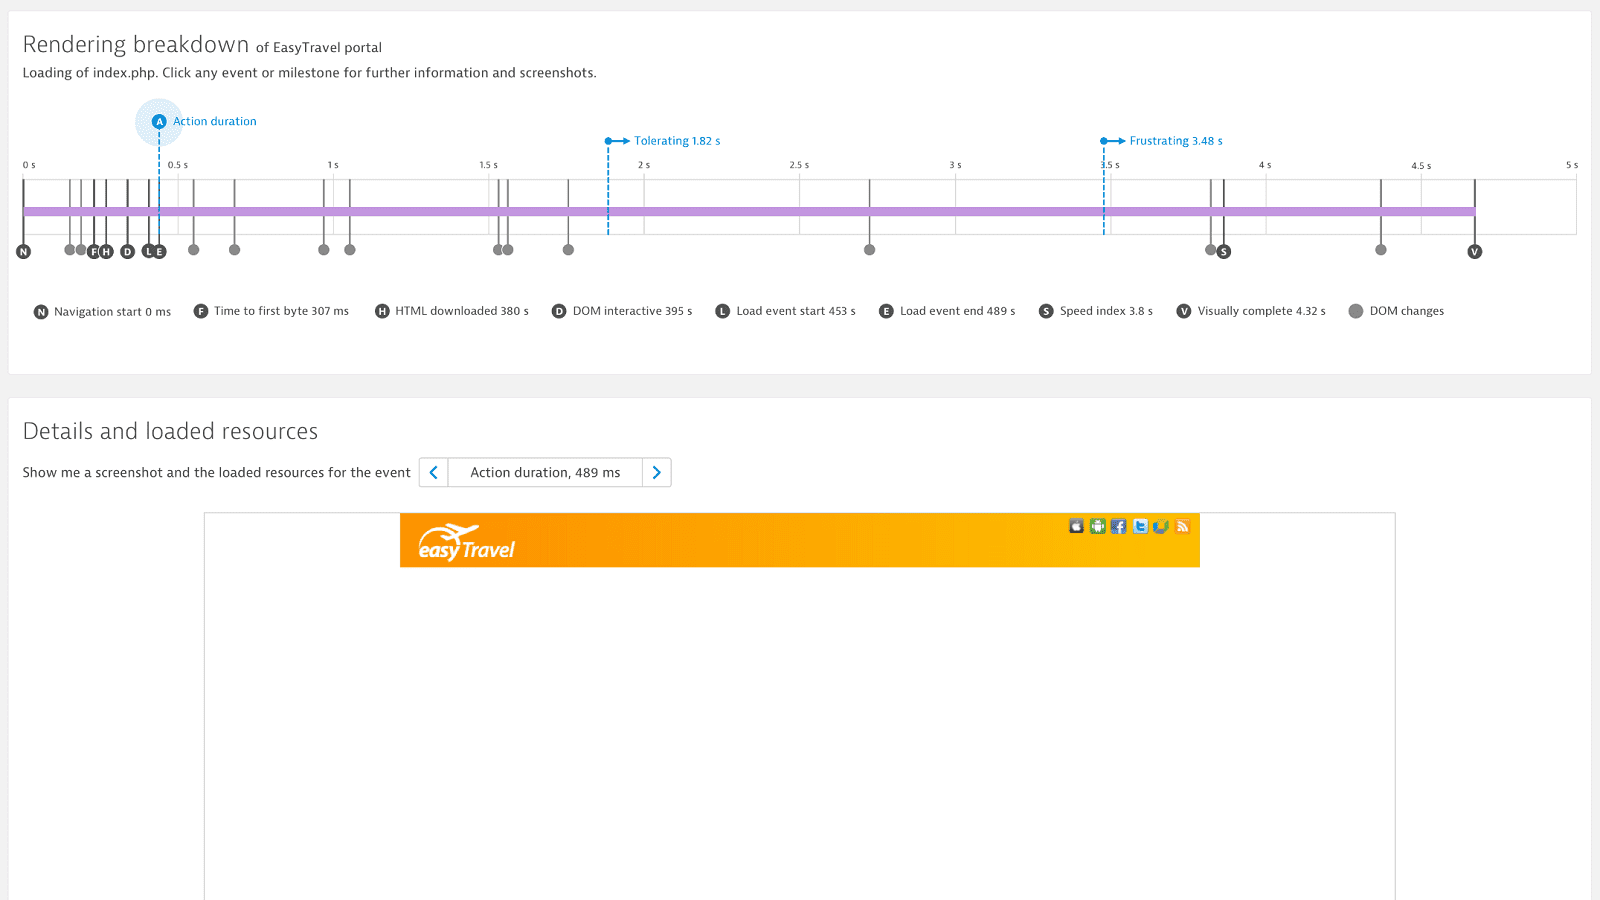
See exactly how long it takes your web page to become visually complete – for every user, on every mobile or desktop device. Get into the customer’s seat and go beyond time to first byte, DOM interactive or fully loaded.

Experienced web application speed in numbers
In addition to Visually complete, the Speed index indicates how fast your page loads through a user's perspective. A lower Speed index is ideal as it means large parts of the page can render very quickly.
Overcome the limitations of traditional metrics
Traditional website performance optimization metrics are based on measured time, number of requests and kilobytes. While these numbers are important, they do not reflect on when users are able to see the information they are looking for. Users care more about the time it takes a website to become visually loaded and ready to use.
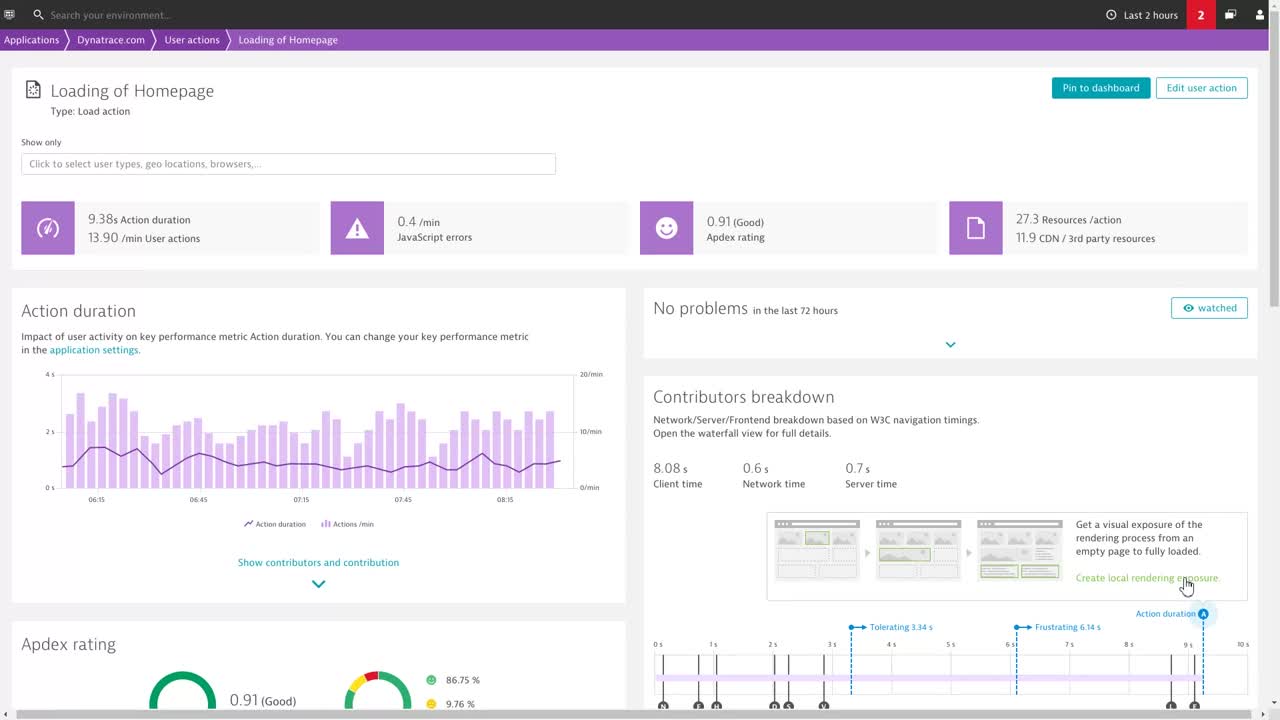
Optimize above-the-fold
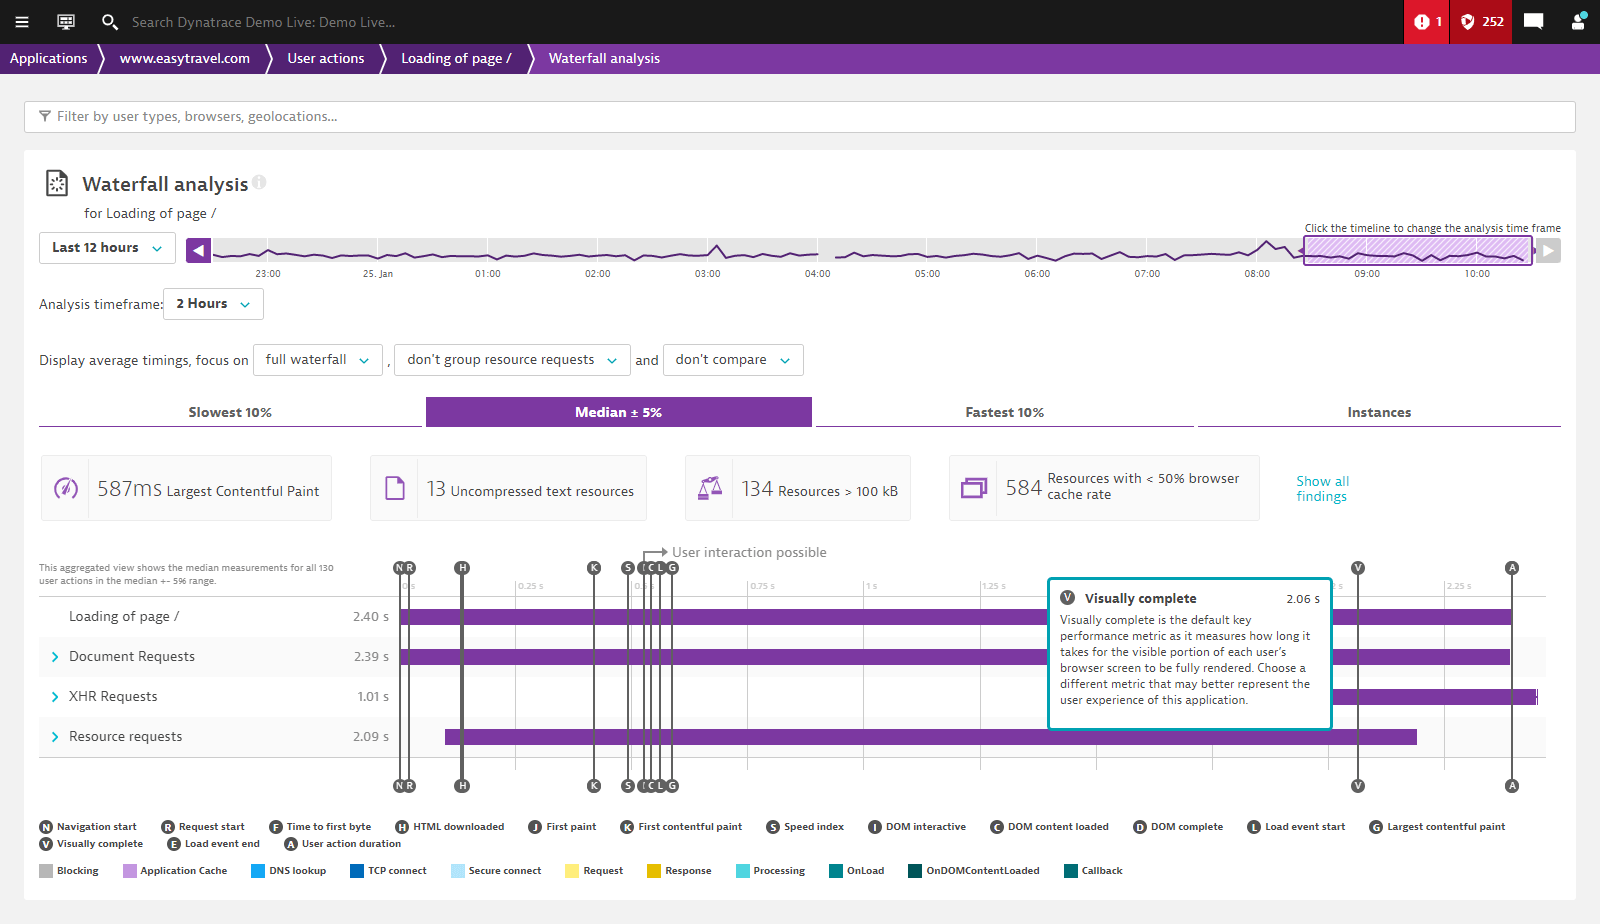
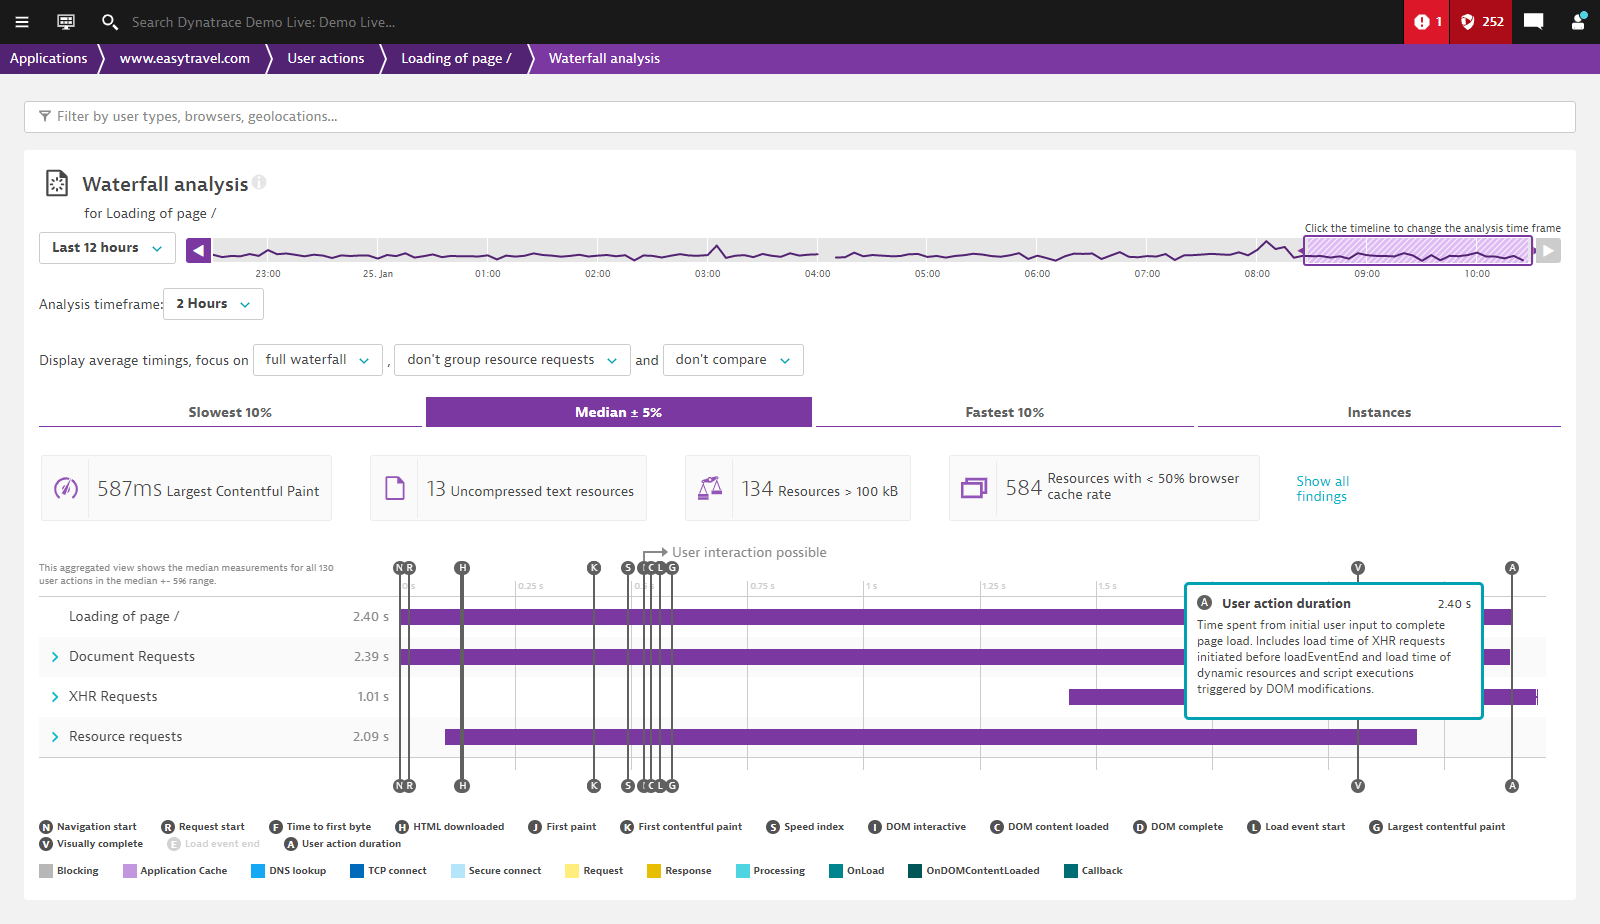
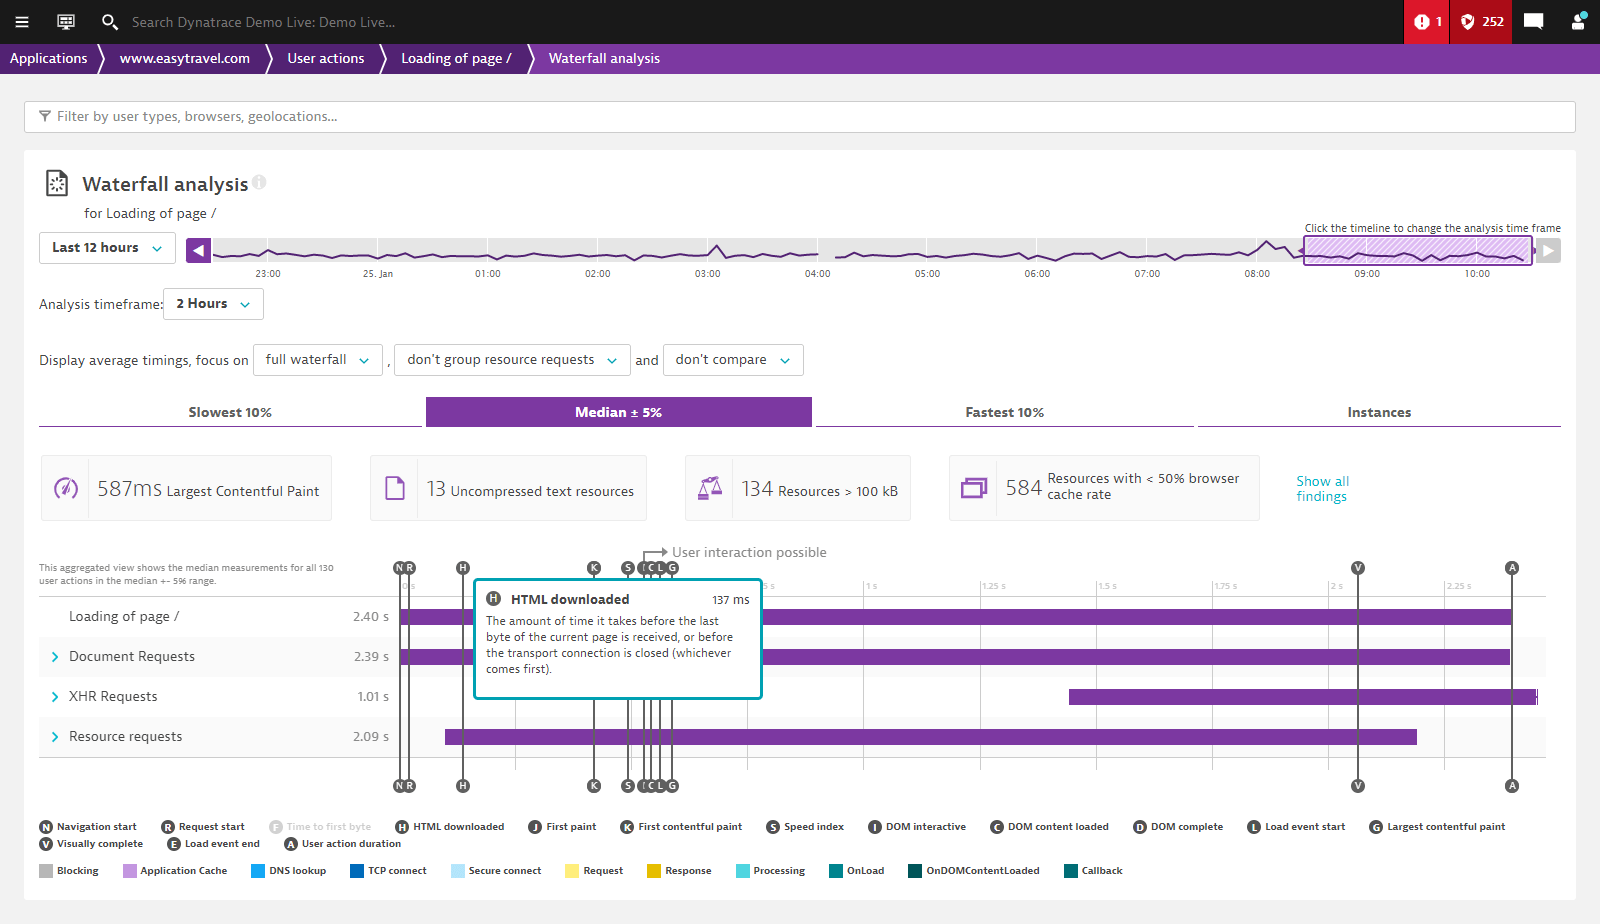
Visually complete shows you the exact time your real users spent waiting for above-the-fold content to load completely - for each and every location, device, operating system and browser type. It can also be combined with powerful waterfall charts to understand and tune the rendering of a web page. Dynatrace is the only solution that provides these consistent metrics for real user monitoring as well as synthetic tests.


Now we’re in the customer’s seat and can automatically see how the experience is impacting our business. It's super powerful and fully automated, and aligns IT, marketing, business leadership and our customers for the first time.

Take your digital experience monitoring to a new level with Dynatrace
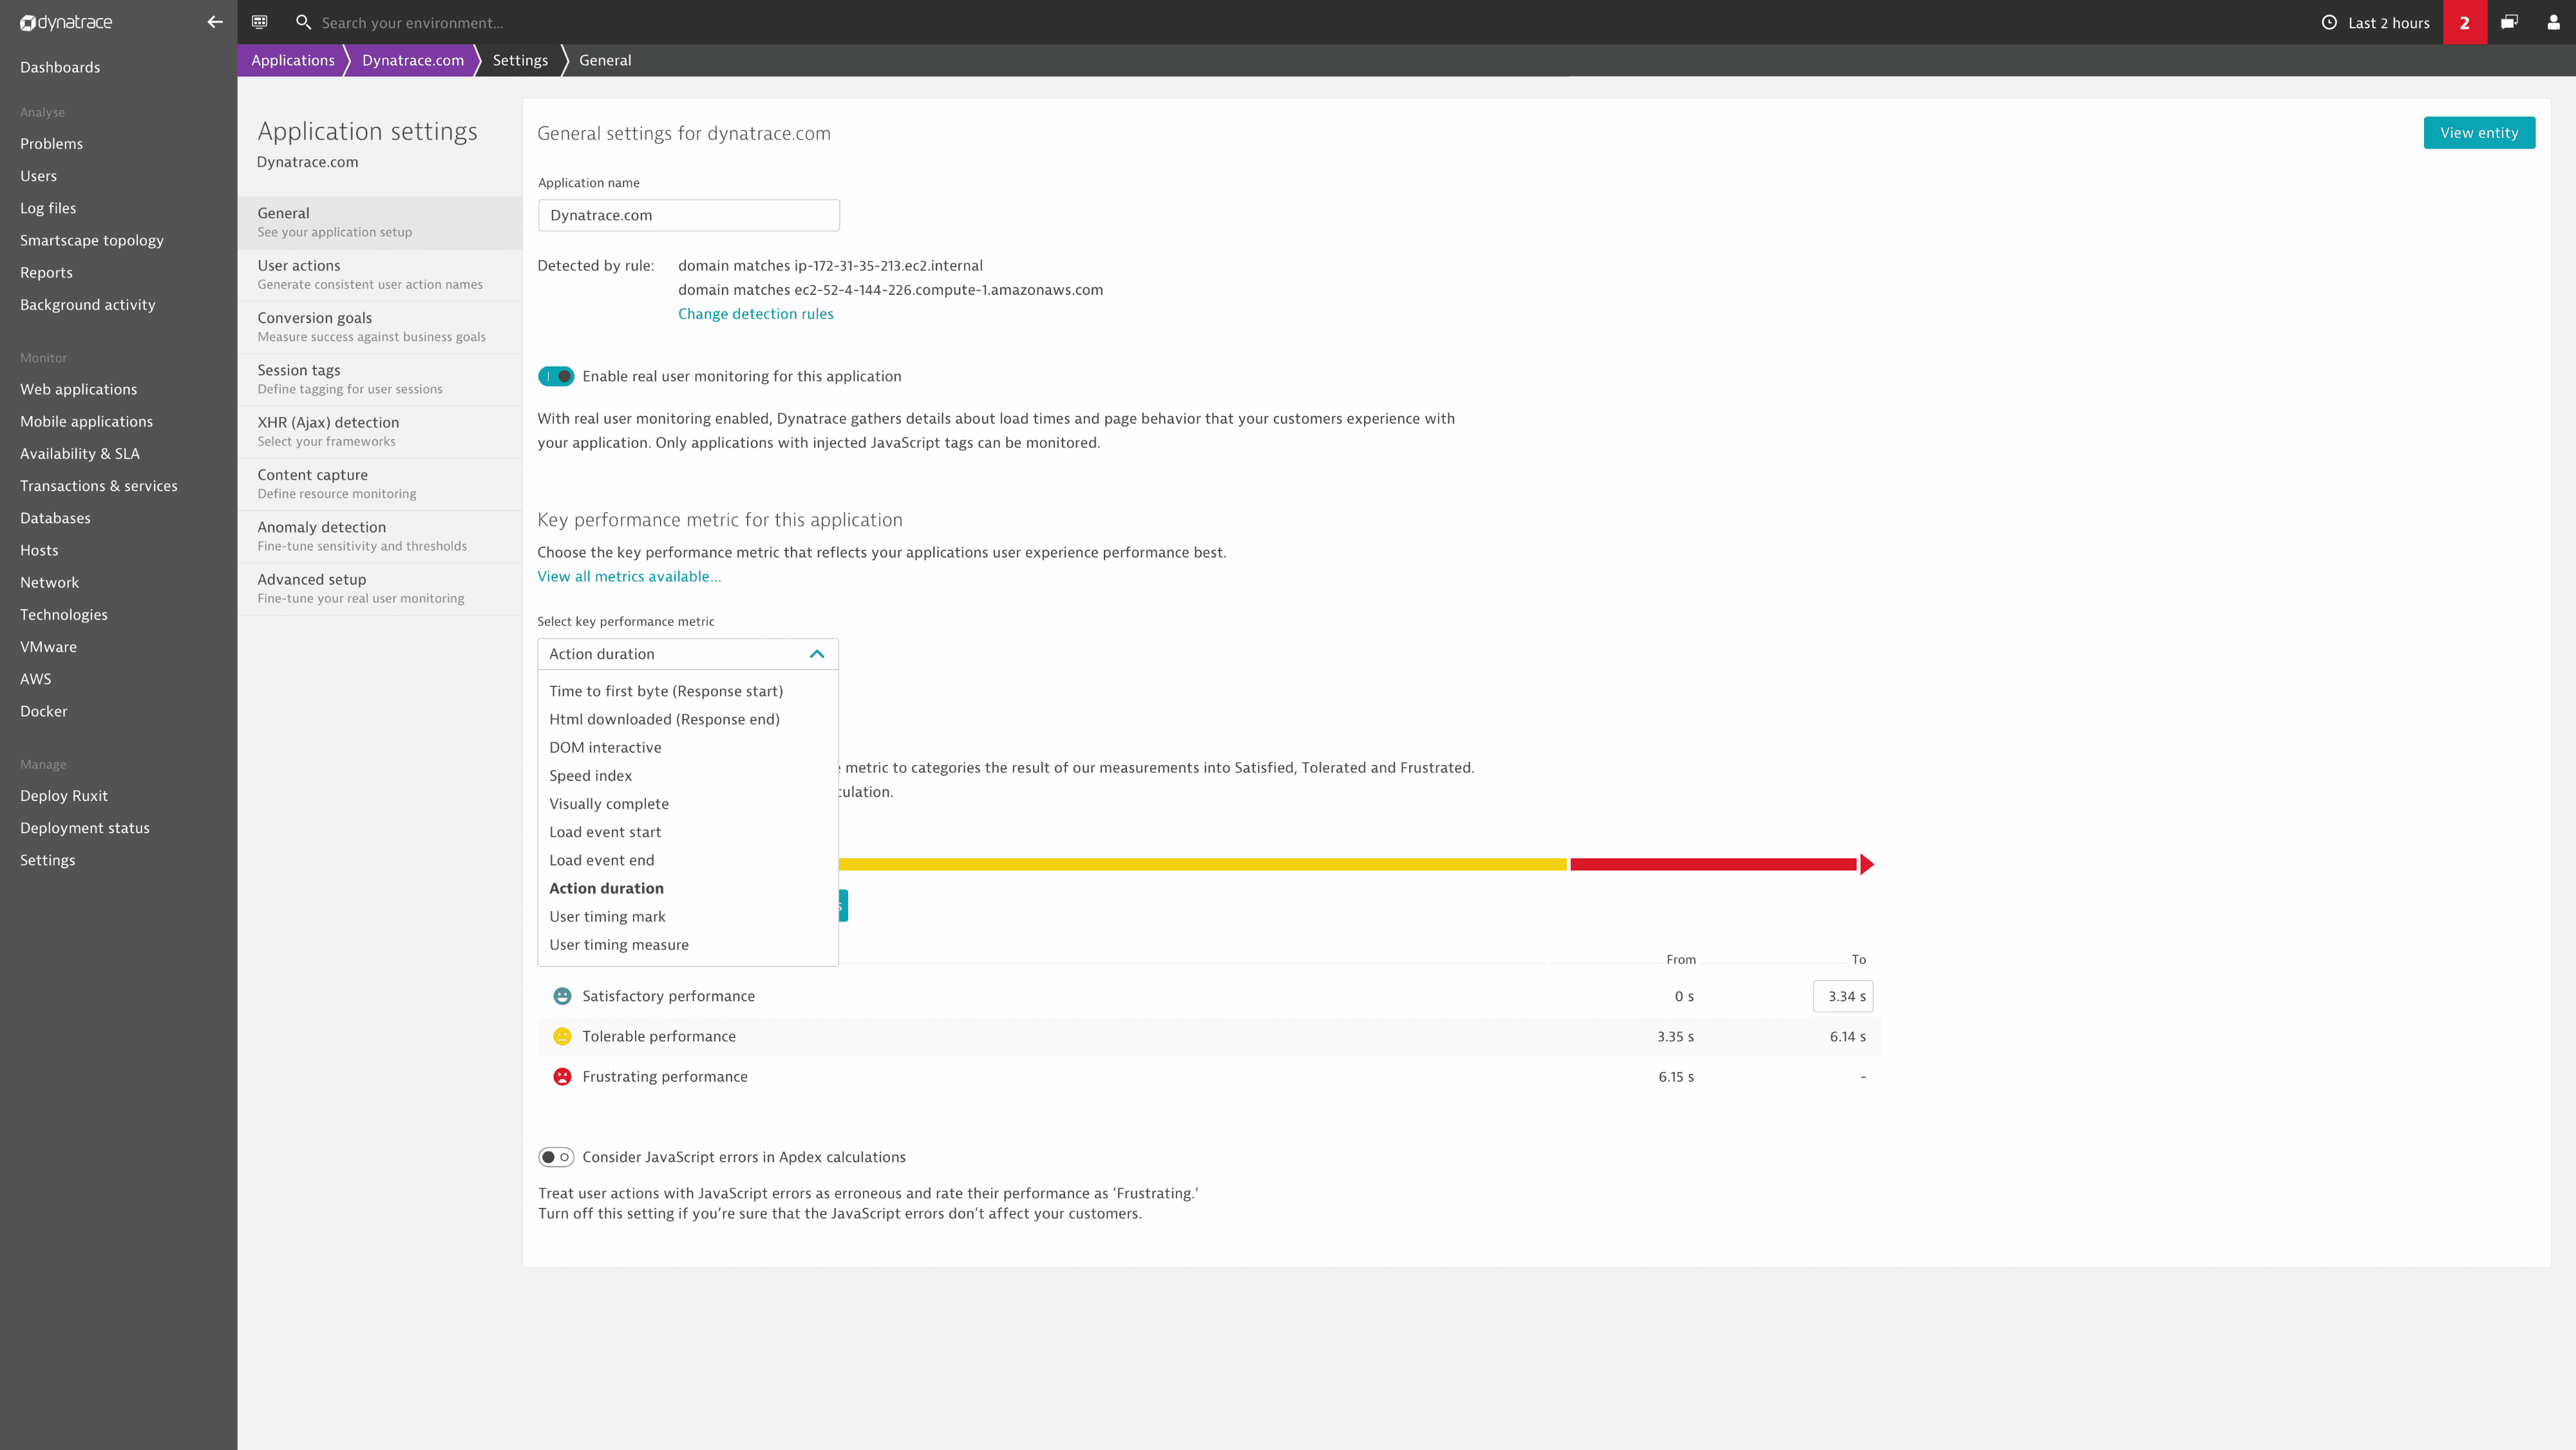
Choose metrics that matter
Different metrics may be relevant for different use cases. Dynatrace is the only provider that lets you select a primary metric for each web application or custom key user action. Our automatic baselining, as well as anomaly detection, will be based on your chosen key performance metric.
Get meaningful metrics for single page applications
Relying solely on W3C metrics is problematic; especially for single-page applications. Our new customer-centric performance metric allows you to assess the real, visual user experience of modern applications. It monitors user experience from application launch to start screen as well as user clicks and screen changes while working with the app.
See how the visual experience influences your business
Powered by AI, Dynatrace shows you how the visual load time of your website influences business outcomes like revenue, bounce rates and conversions. For the first time, you'll be able to align IT, marketing and business leadership.
How does Visually complete work?
Watch this short video to hear Klaus Enzenhofer, Senior Technology Strategist at Dynatrace explain how the Visually complete metric brings you closer to the end-user’s experience more than ever before.
Try it free

