How much wind power a system can incorporate is a significant problem in power grid management. At a basic level, grid operators can’t control when the wind blows, and the problem is exacerbated by the fact that more traditional generators can’t always be ramped up quickly if the wind suddenly cuts out. If gusts unexpectedly stop gusting on a hot July day and everyone on the East Coast reaches to turn on their air-conditioning at the same time, grid operators can neither generate electricity from the wind, nor can they always immediately generate electricity from more traditional sources, because those need time to ramp up. Thus a generation shortage occurs—and that can lead to a power outage.
A recent pair of studies conducted by the University of Delaware and Princeton University tried to assess how much wind power PJM Interconnection, an East Coast-based grid operator that serves 60 million people in 14 states, could incorporate before the wind's unpredictability might put grid reliability at risk.
The researchers ran hundreds of simulations to see how well the grid could adjust to five levels of offshore wind farm build-out along the US Atlantic Coast: level 1 added 7 gigawatts of installed capacity and level 5 added 70 gigawatts of installed capacity.
The researchers concluded that PJM could handle quite a lot of offshore wind power on its transmission lines, even using conservative wind forecasting and assuming no advances in turbine or transmission technology. Specifically, PJM could handle 7 GW of installed offshore wind capacity using the most conservative estimates. More generous estimates allowed nearly 36 GW of installed wind capacity. Scenarios permitting level 5 build-out, or 70 GW of installed capacity, required more significant grid and forecasting upgrades.
The answers are blowin’ in the wind
Part one of the researchers’ two papers addressed wind forecasting for the proposed offshore wind farms. The US is far behind Europe in offshore wind installations—our first offshore wind farm only just went live this past December. That meant that, while this paper was being completed, there were no long-term measurements of wind speeds at hub-height for offshore wind turbines along much of the US East Coast. (Although that may have changed since the paper was written, because just this winter New York agreed to lease significant tracts of offshore acreage to wind farm operators.) Still, “the lack of adequate wind speed observations has been identified already as one of the main obstacles to the development of offshore wind farms along the US East Coast,“ the researchers wrote.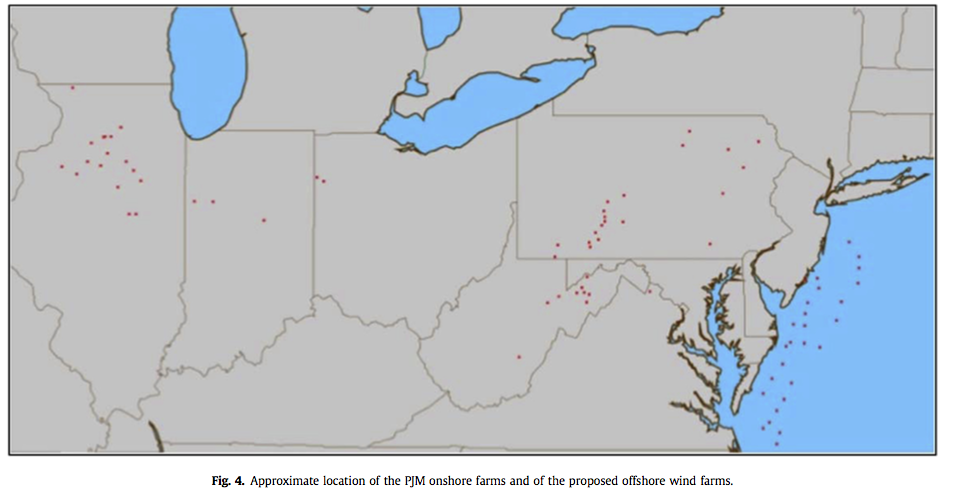
In lieu of good offshore wind speed data, the first paper tried to estimate wind potential by using offshore wind forecasts generated by Weather Research and Forecasting (WRF), combined with forecast error probabilities gleaned from 23 Great Plains wind farms operated by PJM. The researchers chose to estimate wind scenarios using data from January, April, July, and October, assuming that one month for each season would reflect seasonal wind conditions adequately.
Put it on the grid
Once the researchers had drawn up estimates of the wind speeds that the proposed offshore turbines would experience, they applied it to their grid simulation. Their second paper outlined the process they used to determine how much wind could be injected into PJM’s system without compromising the operator’s ability to serve all its customers. The researchers built a simulator called Smart-ISO that took into account generator scheduling, transmission capacity, and the wind model from the previous paper.
Smart-ISO balanced predicted injections of wind against a list of 830 real-world generators within the PJM system. The generators were classified as either “must-run” units or as slow, fast, and "other" units depending on how quickly the generator could be ramped up. Must-run units included nuclear-fueled generators and coal-fueled generators “with notification plus warm-up times above 32 hours.” Slow generators needed warm up times of two to 32 hours, fast generators could warm up in under two hours, and “other” indicated hydroelectric generators, pumped storage, and wind.
Smart-ISO was also run assuming either a constrained or an unconstrained grid. An unconstrained grid assumes the power lines are unchanged but that their thermal and electric power carrying capacities can handle as much wind as operators throw at it. A constrained grid assumes power lines are limited to their real thermal capacities.
First, the researchers looked at an unconstrained grid without any additional generation reserves added to PJM's current system. For those simulations, PJM was able to handle build-out level 1 (7 GW) relatively easily but faced generation shortfalls moving to build-out level 2 (25.3 GW of installed offshore wind capacity) due to a lack of fast-ramping generators.
However, the researchers found more favorable scenarios if ramp-up and ramp-down generation reserves were added to the system. Using these simulations and trying to minimize the amount of reserve generation needed, they found that "with additional synchronized ramping reserves of up to 8 GW," PJM could build out its offshore wind installed capacity to build-out level 3, or an installed capacity of 35.8 GW.
For constrained grid simulations, there was little change at build-out level 1, but "moving to build-out levels 2 and beyond, offshore wind power becomes severely curtailed by the current grid capacity constraints, as indicated by the percentage of used wind, which drops to between 37.8 and 60.7 percent, as opposed to the 86.9 to 93.4 percent range observed in the unconstrained case," the paper noted. "This issue can only be resolved by an upgrade in the onshore transmission lines, particularly in the coastal areas."
In all scenarios, July was the most challenging month due to high electricity demand and variable winds. “Short-term forecasting errors proved to be the major factor limiting the absorption of high penetrations of offshore wind,” the paper noted.
The costs and benefits
The researchers concluded that building out installed offshore wind capacity to level 3, or 35.8 GW, was a reasonable proposition for PJM, as it conservatively reflected "the highest capacity at which it is estimated the current PJM market can operate without any generation shortfall," with additional ramping generation, of course. At that level, energy from wind would meet 11 to 20 percent of the demand for electricity.
More importantly, at build-out level 3 the additional wind would create significant reductions in CO2 (emissions reduced by between 19 and 40 percent), NOX (emissions reduced between 13 and 37 percent), and SO2 (emissions reduced between 21 and 43 percent).
It's important to keep in mind that the simulations were done on the conservative side, assuming "no demand-side management, no large-scale battery or compressed air storage, no mixing of different types of additional renewable power generation (e.g., wind, solar, hydro), and no coupling to the heating and transportation sectors." An underwater high-voltage DC transmission line like the one proposed in 2011 by the Atlantic Wind Connection could also improve prospects for more offshore wind.
Renewable Energy, 2017. DOI: http://dx.doi.org/10.1016/j.renene.2016.11.047 (About DOIs).
Renewable energy, 2017. DOI: http://dx.doi.org/10.1016/j.renene.2016.11.049 (About DOIs).
reader comments
110