

Abstract
Drought can affect the structure, composition and function of terrestrial ecosystems, yet drought impacts and post-drought recovery potentials of different land cover types have not been extensively studied at a global scale. We evaluated drought impacts on gross primary productivity (GPP), evapotranspiration (ET), and water use efficiency (WUE) of different global terrestrial ecosystems, as well as the drought-resilience of each ecosystem type during the period of 2000 to 2011. Using GPP as biome vitality indicator against drought stress, we developed a model to examine ecosystem resilience represented by the length of recovery days (LRD). LRD presented an evident gradient of high (>60 days) in mid-latitude region and low (<60 days) in low (tropical area) and high (boreal area) latitude regions. As average GPP increased, the LRD showed a significantly decreasing trend, indicating readiness to recover after drought, across various land cover types (R2 = 0.68, p < 0.0001). Moreover, zonal analysis revealed that the most dramatic reduction of the drought-induced GPP was found in the mid-latitude region of the Northern Hemisphere (48% reduction), followed by the low-latitude region of the Southern Hemisphere (13% reduction). In contrast, a slightly enhanced GPP (10%) was evident in the tropical region under drought impact. Additionally, the highest drought-induced reduction of ET was found in the Mediterranean area, followed by Africa. Water use efficiency, however, showed a pattern of decreasing in the Northern Hemisphere and increasing in the Southern Hemisphere. Drought induced reductions of WUE ranged from 0.96% to 27.67% in most of the land cover types, while the increases of WUE found in Evergreen Broadleaf Forest and savanna were about 7.09% and 9.88%, respectively. These increases of GPP and WUE detected during drought periods could either be due to water-stress induced responses or data uncertainties, which require further investigation.
Export citation and abstract BibTeX RIS

Original content from this work may be used under the terms of the Creative Commons Attribution 3.0 licence. Any further distribution of this work must maintain attribution to the author(s) and the title of the work, journal citation and DOI.
Introduction
Drought is an important adverse climatic event for both ecosystems and human society (Mu et al 2013). Previous studies using state-of-the-art models projected higher frequency and intensity of droughts in most of the Southern Hemisphere and part of the Northern Hemisphere in response to global climate change (IPCC 2013, Fischer and Knutti 2014, Allen et al 2014, Spinoni et al 2014, Sun et al 2012). Global air temperature has linearly increased over the 50 years from 1956 to 2005 (0.13 °C per decade), which is nearly twice as fast as the rising rate during 100 years from 1906 to 2005 (Solomon et al 2007). More prominently, the past decade has experienced a faster and unprecedented warming trend than the prior century as evidenced by the fact that the 10 hottest years on record have all occurred since 1998 (NASA 2011, UK-MetOffice 2011, JMA 2011), making the past decade an ideal time period to examine the terrestrial ecosystems' responses to drought extremes.
It is expected that increased temperature from global climate change may intensify droughts (Trenberth et al 2014). Intensity is one of the most important dimension of drought, and it refers to the significant reduction of water availability compared to 'normal conditions' (Tsakiris and Vangelis 2005). Water availability is determined both by water input (precipitation) and output (evapotranspiration and runoff). Land evapotranspiration (ET), the sum of soil evaporation, canopy evaporation, and plant transpiration, is a central process in the climate system, and is also a nexus of the water, energy and carbon cycles (Jung et al 2010, Mu et al 2007). The carbon and water cycles are closely coupled during the process of photosynthesis. This relationship, water use efficiency (WUE), may be expressed as the ratio of carbon uptake (GPP) to water loss (ET) (Yu et al 2008). Trading of water for carbon in vegetation is closely related to the drought stress. Under negative conditions, plants may increase WUE to adapt to an unfavorable environment.
Various indices have been developed to represent regional- to global-scale drought stresses, including the Palmer drought severity index (PDSI; Palmer 1965, Alley 1984), MODIS DSI (Moderate Resolution Imaging Spectroradiometer Drought Severity Index; Mu et al 2013), Standardized Precipitation Index (SPI; McKee et al 1993), and the Evaporative Drought Index (EDI; Yao et al 2010). Among all of these metrics, the PDSI is perhaps the best known and most commonly used. PDSI is determined by monthly water supply, water outputs, and preceding soil water status. Nonetheless, the PDSI has weaknesses of delayed identification of emerging droughts and ineffectiveness for mountainous regions or in spring (Orvos et al 2015, Mu et al 2013). By comparison, the MODIS DSI index, using satellite-derived ET, PET, and NDVI is effective in providing both simultaneous and high resolution drought information. Limitations of other commonly used drought metrics have been comprehensively summarized in Mu et al (2013)'s study.
Previous studies have improved our understanding of drought intensity and mechanisms underlying ecosystem responses to drought events. There are of great importance in projecting the impacts of climate extremes on regional C budget and water resources. Only a few studies have examined the post-drought recovery potential of different types of land cover globally. Ecosystem resilience, an indicator of the recovery potential, should be investigated to examine the potential of large- scale ecological collapse. Allen et al (2010) reported that part of the world's forested ecosystems may become increasingly vulnerable to higher background tree mortality rates and die-off in response to future warming and drought, even in the environments that are not normally considered water-limited. Examples have been well documented at local and regional scales such as in Europe (Peñuelas et al 2001, Bréda et al 2006, Bigler et al 2006), East Asia (Qiu 2010, Barriopedro et al 2012, Xin et al 2006), the United States (Clark et al 2016), eastern North America (Abrams and Nowacki 2016), and western North America (van Mantgem et al 2009). In this study, we used MODIS data and CRU (Climate Research Unit at half-degree resolution) climate data to identify drought events and quantify their impacts on GPP, ET, and WUE in different global terrestrial ecosystems during the period from 2000 to 2011. We further addressed the length of days each ecosystem required to recover from drought stress as well as its relationship with ecosystem productivity. Finally, we discussed the response of terrestrial ecosystems to heat extremes and the implications to enhance ecosystem carbon sequestration potential.
1. Materials and methods
1.1. Study area and data descriptions
This study focused on the different terrestrial ecosystem types, including Evergreen Needleleaf Forest (ENF), Evergreen Broadleaf Forest (EBF), Deciduous Needleleaf Forest (DNF), Deciduous Broadleaf Forest (DBF), Mixed Forest (MF), Shrublands (SHB), Savannas (SAV), Grasslands (GR), Permanent wetlands (WET), and Croplands (CROP). Land cover type information is derived from MODIS land cover products (MOD12Q1, Zhao et al 2005). MODIS GPP, ET (MOD16/17) and DSI (Drought Severity Index) products were used in analyses of droughts and ecosystem responses. The models used in developing these products were thoroughly described by Mu et al (2007), Mu et al (2011), Zhao et al (2005), and Mu et al (2013). The MODIS products were downloaded from the Numerical Terradynamic Simulation Group (NTSG) of University of Montana at an 8-day interval. All datasets were resampled and categorized from original 5 km × 5 km into a 0.5° × 0.5° resolution for modeling and analyses. We then evaluated water use efficiency (WUE) derived from the GPP and ET products (defined as WUE = GPP/ET), to detect the drought-induced changes involved in trade-offs between C gain and water loss in different ecosystems. The MODIS ET datasets were estimated using Mu et al (2011) improved ET algorithm, which based on the Penman-Monteith equation.
Other climatic datasets, such as air temperature and precipitation were obtained from the Climate Research Unit at half-degree resolution (CRU, www.cru.uea.ac.uk/cru/data/hrg/). Global coverage daily soil moisture (SM) data were derived from the ESA Global Monitoring of Essential Climate Variables (ECV) with spatial resolution at 0.25 degree from 1978 to 2013 (www.esa-soilmoisture-cci.org/). The soil moisture data were then summarized, resampled, and gap-filled to 8-day time series at a half-degree spatial resolution (see supplementary information available at stacks.iop.org/ERL/12/014016).
1.2. Drought and non-drought period
In this study, MODIS DSI product was used to detect drought occurrence. We defined a drought event as the period which has at least one month (4 times of 8-day time series) with a consecutive DSI below −0.9 in a growing season (May to September in Northern Hemisphere, November to March in Southern Hemisphere). The threshold value −0.9 refers to moderate drought defined by Mu et al (2013). Air temperature, precipitation, and soil moisture of the drought period were extracted to compare with the average values of the non-drought (normal) period. The non-drought period was defined as the duration in a growing season with all 8-day time series DSI higher than −0.9 (without transient drought occurrence).
1.3. GPP recovery duration length
Ecosystem GPP, a metric of photosynthetic activity, was used to evaluate the recovery level of ecosystem vitality after drought impacts. First, the average non-drought GPP (AveGPP) was calculated at a pixel basis of 8-day time step (equations (1) and (2)). The original 8-day GPP dataset was divided by the AveGPP to produce a standardized GPP time-series (StdGPP, equation (3)), which was then smoothed by a one-month window for analyses (SmhGPP, equation (4)). We also defined an ecosystem recovery from a drought event to its normal condition as once a post-drought one-month consecutive GPP achieved 95% (negative drought impacts) or 105% (positive drought impacts) of the average non-drought period GPP (the month when SmhGPP with the threshold value of 0.95 or 1.05). This approach is illustrated in figure 1, in which the first year has no drought occurrence, and the second and third years have droughts (consecutive DSI < −0.9). Notice the third year has transient drought (last for less than 1 month) and was ignored (figure 1(a)).
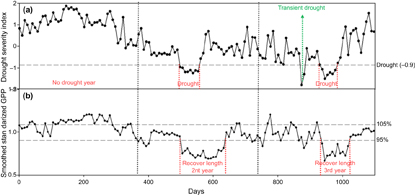
Figure 1 Drought occurrence and post-drought recovery length using GPP and DSI time-series data at pixel-basis for a three-year length. Drought is defined as the period of consecutive DSI below -0.9 in a growing season; transient drought (green arrow) lasting less than 1 month, is excluded; recovery length is the period when GPP recovers to 95% or 105% level.
Download figure:
Standard image High-resolution imageWhere, n equal to 12, which denotes the total number of years from 2000 to 2011; k is the year number from 1 to n; i is the 8-day interval index from 1 to 46 (for each year there are 46 8-day data points); Flagi denotes whether non-drought emerges at time i; AveGPPi is the average non-drought GPP at time i; StdGPP is the standardized GPP; and SmhGPP is the GPP time-series smoothed by a one-month-window.
2. Results
2.1. Climatic factors during drought and non-drought periods
Expected trends were observed during the drought, precipitation and soil moisture were much lower than in the non-drought period, and a higher than normal air temperature was detected during the drought period (figure 2). The highest reduction of precipitation (>50%) in a drought period was found in central North America, Mediterranean, and Australia (figure 2(a)). Lower soil moisture (∼50% reduction) was also detected in most of the land areas except for part of the high latitude regions of North America, Eurasia and southern China (figure 2(b)). In contrast, air temperature showed a pattern of higher than normal values in almost the entire globe, with a few scattered pixels of slightly lower values (figure 2(c)).
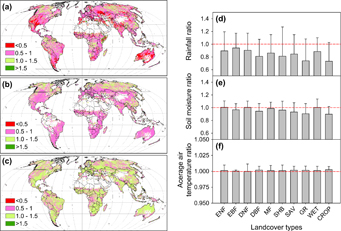
Figure 2 Left: precipitation (a), soil moisture (b) and average air temperature (Kelvin scale, c) ratio of drought period and the non-drought period; the right panel shows the average ratios of precipitation (d), soil moisture (e), and air temperature (f) in different land cover types (ENF: evergreen needleleaf forest; EBF: evergreen broadleaf forest; DNF: deciduous needleleaf forest; DBF: deciduous broadleaf forest; MF: mixed forest; SHB: shrublands; SAV: savannas; GR: grasslands; WET: permanent wetlands; CROP: croplands).
Download figure:
Standard image High-resolution imageOn average, the difference of precipitation between the drought and the non-drought period oscillated from 0.23 to 0.89 mm day−1 and the air temperature was higher for the drought period at a difference from 0.12 to 0.72 °C. This resulted in a lower soil moisture content during drought periods under most of the land cover types except for ENF, DNF and WET areas (table 1). The declines of absolute values in precipitation (0.89 mm day−1) and soil moisture (0.0243 m3 m−3) were found to be the largest in savanna, while the smallest precipitation decrease was observed in DNF area (0.2 mm day−1). In comparison, the largest percentage reduction of daily rainfall was detected in SHB (38%), followed by SAV (36%) and GR (34%).
2.2. Recovery duration days after droughts
The length of recovery days (LRD) showed a gradient ranging from more than 60 days in mid- latitude region to less than 60 days in low (tropical area) and high (boreal area) latitude regions (figure 3(a)). Mean values of LRDs were shorter in forest types (figure 3(b)). Among all the land cover types, EBF had the shortest LRD (∼30 days; figure 3(b)) and grassland showed the longest LRD (∼80 days; figure 3(b)). With an increase of average GPP, the LRD showed a significantly decreasing trend in different land cover types (figure 4).

Figure 3 Days of GPP recovery back to normal after droughts impacts.
Download figure:
Standard image High-resolution image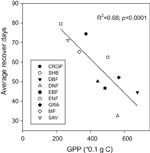
Figure 4 Relationship between GPP and days of recovery after droughts impacts (GPP is the 8-day averaged value during growing season period).
Download figure:
Standard image High-resolution image2.3. GPP and evapotranspiration after droughts
GPPs extensively declined in most of the terrestrial ecosystems after drought extremes, except for the tropical area (figure 5(a)). The most intensive drought-induced GPP reduction was found in the mid-latitude region (30°N–50°N) of north hemisphere (48% reduction by zonal analysis; figure 5(a)), and followed by the low-latitude region (15°N–30°N) of south hemisphere (13% reduction; figure 5(a)). In contrast, the tropical region showed a slight increase in GPP (10%; figure 5(a)).
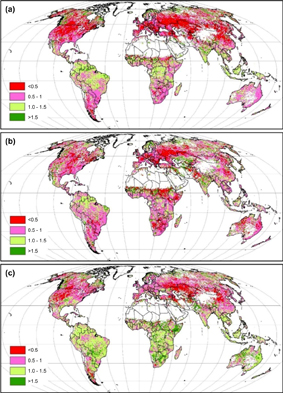
Figure 5 GPP (a), ET (b) and WUE (c) ratio for the drought period and the non-drought period.
Download figure:
Standard image High-resolution image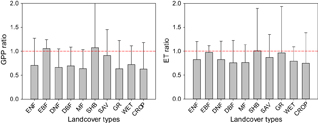
Figure 6 GPP and ET ratio of drought period and the non-drought period by different land cover types.
Download figure:
Standard image High-resolution imageDrought-induced ET decline was more extensive than GPP reduction. The greatest reduction of ET was detected in the Mediterranean area, followed by Africa (figure 5(b)). Water use efficiency (WUE), however, showed a different pattern of decreasing in the Northern Hemisphere while increasing in the Southern Hemisphere (figure 5(c)).
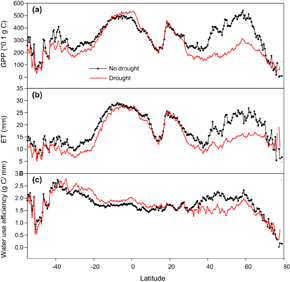
Latitudinal analyses showed different change patterns in GPP, ET, and WUE after droughts (figure 7). Drought-induced reductions in GPP and ET were found in the area south of 10°S and north of 20°N (figure 7(a) and (b)). In the area north of 20°N, however, the reduction percentage of GPP was greater than ET, while in the area of south of 10°S, ET decline exceeded the reduction in GPP, which resulted in a higher WUE in the area south of 10°S but a lower WUE in the area of north of 20°N (figures 7(a)–(c)). The higher WUE in the region of 10°S–20°N was due to a slightly enhanced GPP and marginally reduced ET.
Figure 7 GPP, ET and WUE during drought period and the non-drought period (average of 8-days sum during each period).
Download figure:
Standard image High-resolution image
3. Discussion
3.1. Direct concurrent impacts of droughts
Drought can have manifold impacts on terrestrial ecosystems, including direct concurrent impacts, direct lagged impacts, and indirect lagged impacts (Frank et al 2015). These impacts may influence the vegetation physiology, phenology, growth, pest outbreak, and fire occurrence. In this study, we evaluated drought's direct impacts with a focus on quantifying the changes of climate factors during the drought period of the last decades.
Based on the MODIS drought severity index (DSI), Orvos et al (2015) reported 17% of the land area exhibited significant trend of either drying or wetting, and most of such locations were joined to large, geographically correlated areas. Our study found significant reductions of precipitation and soil moisture in a drought period, while higher than normal air temperatures were detected during drought period in most of the land cover types. In particular, the largest decline of precipitation in absolute value was found in savanna area (−0.89 mm day−1, p < 0.0001), and the smallest reduction was in Deciduous Needle-leaf Forest area (DNF; −0.20 mm day−1, p < 0.0001). These changes also contributed to the largest reduction in soil moisture in the savanna area (−0.0243 m3 m−3, p < 0.0001) and an insignificant change of soil moisture in DNF (0.0017 m3 m−3, p > 0.10).
Soil moisture is determined by water inflow (precipitation, snow melt) and water loss (runoff, evapotranspiration). In this study, we found that DNF and wetland soil moisture values did not show significant differences between drought and non-drought periods, albeit a significant decline of precipitation (p < 0.0001) occurred in both of the regions (table 1). For the DNF area, this may be explained by water compensation from snow melt, while wetland soil moisture was closely related to abundant underground water supply.
Furthermore, significantly higher air temperatures were detected in all land cover types (table 1, p < 0.001) except for DNF, suggesting that the DNF droughts were more closely related to moisture stress (precipitation) than heat stress (warming). During the period of 2000 to 2011, the largest drought-associated increase of air temperature was found in cropland (CROP, 0.72 °C, p < 0.0001) while the lowest existed in Evergreen Broadleaf Forest (EBF, 0.12 °C, p < 0.0001). These correlated changes of precipitation and air temperature led to conspicuously concurrent and lagged impacts on terrestrial ecosystems. Hence, we found reductions of GPP in mid- and high-latitude regions of the Northern Hemisphere (figure 5(a)), which is consistent with Teixeira et al (2013) study revealing a high risk of crop yield damage due to drought for high latitudes continental lands, particularly in the 40–60°N region. Piao et al (2010) also reported that drought affected 25 ± 7 Mha cropland per year (17 ± 5% of sown area) and contributed to harvest failure of 5 Mha per year during 2000–2007 in China. Lobell and Gourdji (2012) alleged that 5% decline of global crop yields occurred due to each 1 °C of warming, and that the average decline of crop yield was at −3.6% due to warming impacts in the past decades. Nonetheless, the estimated reduction of GPP in our study (36%, figure 6(a)) is much higher than other estimates, suggesting much more severe impacts of transient drought extremes than chronic warming. Similarly, Ciais et al (2005) also reported a 20% drop in Europe-wide NPP caused by the heat and drought in 2003. Climate model simulations also showed that drought disaster-affected area will increase from 15.4% to 44.00% by 2100 (Li et al 2009), which signifies the crucial need for understanding drought consequences and developing strategies to avoid aggravated drought-disaster risks.
3.2. Lagged impacts of droughts
The largest decline of precipitation, 0.89 mm day−1 in absolute value change, and soil moisture were found in savanna, and the smallest precipitation decrease, 0.20 mm day−1, occurred in DNF area due to drought impacts. Accordingly, the length of recovery days (LRD) after drought was the longest in grassland (79.56 days, figure 3(b)) while the shortest was in EBF (32.58 days, figure 3(b)). These results suggest that grasslands and croplands (74.43 days) were the most vulnerable to drought extremes while EBF had a higher resilience to drought stress. A negative, significant relationship between GPP and LRD implied a positive relation in GPP and ecosystem resilience (figure 4, p < 0.0001).
Studies by van Mantgem et al (2009) and Raffa et al (2008) reported that tree mortality rates increased in the forests of western North America during the past decade. The causal factor of this increase was attributed to elevated warming and/or water stress, raising the possibility of the world's forests becoming increasingly susceptible to ongoing droughts (Allen et al 2010). This could signal a gradual species change, as trees with lower resilience to drought stress are replaced by species with greater drought resistance. In this study, we also found longer LSD in forests of North America, central Eurasia, South Africa, and Australia (figure 4(a)) than in other regions of forest in the world, indicating more intensive influences of drought stress in those areas.
Drought can alter the structure, composition and functioning of terrestrial ecosystems; and can thereby change the regional carbon cycle, with the potential to shift ecosystems from a net carbon sink to carbon source (Frank et al 2015). Here, we found drought has intensively reduced GPP in DNF (34%), MF (36%), GR (35%) and CROP (36%), while slightly enhanced GPP in EBF (6%) and SHB (7%) (figure 6(a)). A large reduction of GPP found in North America (>50%, figure 5(a)) is supportive of Schwalm et al (2012) study that reported net carbon uptake was reduced by 51% during the 2000–2004 drought in western North America. Studies have also revealed that drought extremes often lead to decreased ET and cooling effect, and thereby intensified warming effect (Teuling et al 2010, Mueller and Seneviratne 2012). Our study showed drought-induced ET reductions were widely found in most of the land cover types with amplitudes ranging from 3%–25% (figure 6(b)). These reductions resulted in reductions of water use efficiency (WUE) ranging from 0.96% to 27.67% in most land cover types. Conversely, an increase of WUE was found in EBF and savanna under drought stress, 7.09% and 9.88%, respectively. Noticeably, we also found a slight increase of GPP in tropical regions, including Amazon, Central Africa, Indonesia, and south India (figures 5(a) and 7(a)). Nonetheless, these increases of GPP and WUE during drought periods should be cautiously explained. One possible explanation is moderate drought stress could increase productivity in tropical region and enhance WUE in savanna. Similar results were also reported by Saleska et al (2007) which revealed intact forest canopy 'greenness' was increased under drought stress. This drought-induced enhancement of tropical ecosystem activity might be attributed to increased availability of sunlight (due to decreased cloudiness). In this case, water was not a limiting factor and trees were able to utilize deep water sources during dry extremes, even though precipitation declined slightly (Saleska et al 2007). Thus, root system and water table should be appropriately represented in global ecosystem modeling for tropical forests. For some of the dryland species, WUE may decrease as water availability increase due to stomatal conductance increases (Golluscio and Oesterheld 2007). Smith and Nobel (1977) and DeLucia and Heckathorn (1989) also reported higher WUE at reduced photosynthetic levels during drier period of year in dessert shrubs. However, there is also alternative explanation of exceptionally high GPP and WUE during drought periods which could be attributed to data uncertainties. Though WUE derived from MODIS products have been published in other studies (Lu et al 2010, Xue et al 2015), the uncertainties of GPP and ET could be magnified in WUE analysis. A comparison of MODIS and MTE products revealed that GPP and ET are low in consistency in the tropical region (see supplementary information figure S2). Thus, further analysis are required to confirm the GPP and WUE responses to drought stress in the low latitude area.
It should be noticed that the model developed in this study heavily relies on MODIS products and may influence by cross correlation. The correlation analyses between annual DSI, GPP, and ET revealed that significant relationships (p < 0.05) were detected between DSI and ET in SHB, SAV, and CROP, and between DSI and GPP in DBF, SHB, SAV, GS, and CROP (see supplementary information table 1). When compared to PDSI, an independent drought index to MODIS products, DSI has tendency to be more affected by cross correlation (see supplementary information table 1). However, this model can be applied if the dataset provides temporal resolution higher than or comparable to MODIS DSI.
Table 1. Daily precipitation, soil moisture, and average air temperature difference between drought and non-drought periods by land covers.
| Type | Annual average precp (mm day−1) | Precp (mm day−1) | 95% confidence interval of the Precp difference | Volumetric Soil moisture (m3 m−3) | 95% confidence interval of the soil moisture difference | Average air temperature (°C) | 95% confidence interval of the Tavg difference |
|---|---|---|---|---|---|---|---|
| ENF | 1.98 | −0.23 |
−0.20 to −0.26 | 0.0017 |
0.0005–0.0029 | 0.34 |
0.24–0.44 |
| EBF | 6.15 | −0.39 |
−0.44 to −0.33 | −0.0029 |
−0.0033 to −0.0024 | 0.12 |
0.10–0.13 |
| DNF | 1.21 | −0.20 |
−0.24 to −0.16 | 0.0017 | −0.0001–0.0036 | −0.05 | −0.27–0.17 |
| DBF | 2.81 | −0.67 |
−0.74 to −0.54 | −0.0097 |
−0.0113 to −0.0081 | 0.56 |
0.45–0.67 |
| MF | 2.30 | −0.36 |
−0.40 to −0.32 | −0.0025 |
−0.0035 to −0.0016 | 0.30 |
0.22–0.39 |
| SHB | 1.01 | −0.38 |
−0.43 to −0.33 | −0.0091 |
−0.0106 to −0.0076 | 0.29 |
0.19–0.40 |
| SAV | 2.50 | −0.89 |
−0.94 to −0.85 | −0.0243 |
−0.0254 to −0.0233 | 0.39 |
0.35–0.43 |
| GR | 1.36 | −0.46 |
−0.49 to −0.44 | −0.0159 |
−0.0166 to −0.0153 | 0.46 |
0.41–0.51 |
| WET | 3.20 | −0.41 |
−0.51 to −0.31 | 0.0015 | −0.0010–0.0039 | 0.35 |
0.19–0.52 |
| CROP | 2.01 | −0.61 |
−0.64 to −0.58 | −0.0210 |
−0.0217 to −0.0203 | 0.72 |
0.68–0.76 |
4. Conclusions
This study evaluated the drought impacts on gross primary productivity (GPP), evapotranspiration (ET), and water use efficiency (WUE) in different land cover types, as well as the resilience that each ecosystem exhibited as it recovered from drought stress during the period of 2000 to 2011. Not surprisingly, precipitation and soil moisture during drought period were dramatically lower than these in non-drought period, while air temperatures were higher than normal during drought period with amplitudes varied by land cover types. The length of recovery days (LRD) presented an evident gradient of high in mid- latitude region and low in low (tropical area) and high (boreal area) latitude regions. The average LRD showed a significantly negative relationship with GPP across different biomes. Moreover, the drought-induced GPP reduction was found in the mid-latitude region, but a slightly enhanced GPP was found in the tropical region under drought impact. Water use efficiency, however, showed a pattern of decreasing in the Northern Hemisphere and increasing in the Southern Hemisphere. The findings underline the importance of direct concurrent impacts and direct lagged impacts of droughts.
State-of-the-art climate models have revealed a higher frequency of short- and long-term droughts under future climate scenarios (Sheffield and Wood 2008). Ecological collapse can be triggered once climate extremes (e.g. drought) or climate change outpace an ecosystem's ability to adapt. LRD can be evaluated at a longer time span to identify vegetation's adaptation to climate change. More research is required to examine the water use efficiency in the high-uncertainty low latitude region and fully quantify the direct and indirect impacts of drought extremes on terrestrial ecosystems.
We gratefully acknowledge the anonymous reviewers for constructive comments for improvement of the manuscript. This study was supported by Agriculture and Food Research Initiative Competitive Grant No. 2012-68005-19703 from the USDA National Institute of Food and Agriculture, China National Science Foundation (No. 31290223) and the Special Research Program for Public-Welfare Forestry (No. 201404201, 201104006).