A new white paper from Display Supply Chain Consultants (DSCC) provides an analysis of quantum dot (QD) TVs vs. OLED TVs. It discusses the technology trends of the two but adds some unique perspective on the manufacturing capabilities of the two technologies – which can indeed be a determining factor in establishing a leadership position. The paper also provides a forecast and can be downloaded for free HERE.

In the paper, the authors looked at the manufacturing processes of each technology concluding that: “The impact of the more complex circuits needed for OLED shows itself in lower manufacturing yields”. “Samsung has been able to overcome these issues in smartphone displays, but has the advantage of a smaller panel sizes so the uniformity requirements are not as severe. Samsung discontinued its OLED TV commercialization plans a year after launching an OLED TV in 2012 due to the yield challenges. LG Display has taken a different approach which results in lower capital expenditures than Samsung’s OLED TV approach, but is still significantly more expensive than conventional LCDs. LG has reached mass production volumes on OLED TV, but through Q3’16 was still losing a significant amount of money on each panel they produced.”
The report finds that, “since oxide OLED TV panels are inherently more difficult to manufacture than LCDs and require significantly higher capital expenditures, capacity limitations are likely to suppress the growth of the OLED TV segment and prevent it from becoming a mainstream product.”
In the supply chain analysis that DCSS performed, they looked only at 55” and larger fab capacity for OLEDs and LCDs. In their analysis, they find that LCD manufacturers will primarily use a-Si instead of ZnO for the backplanes of these advanced UHD TV (93% share of 55”+ panels in 2021). Why? Because a-Si can achieve 4K resolution at 120 Hz at a lower cost, albeit with higher power consumption compared to ZnO. Perhaps the most important driver is capacity for OLEDs. While this will rise an impressive 64% CAGR to 2021, it will still represent only 6% of this large panel manufacturing capacity. Most of the new OLED capacity is being targeted toward mobile devices, the report finds.
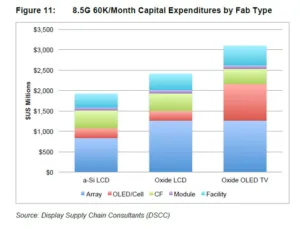
In terms of production costs, Figure 11, below, from the white paper shows a much higher cost for the OLED manufacture than a-Si LCDs on an 8.5G line. “OLED depreciation is more than 2X higher than that of the LCD on a percentage basis,” finds the report. “Meanwhile, due to the lack of a backlight, material costs are significantly lower for the OLED on a percentage basis, however, they are higher than the cost of LCD materials in 2016 due to the difference in cost between the two panel technologies resulting from lower yields, higher depreciation, etc.”
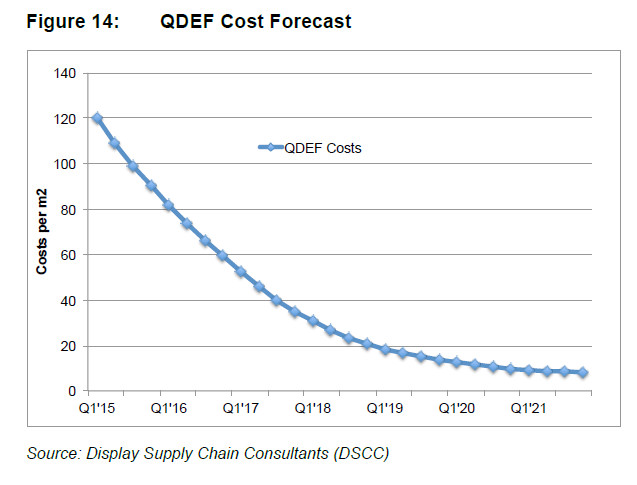
There is additional cost for the QD solution and the paper focused primarily on the cost of the QDEF film from 3M. As Figure 14 show, costs for a 55” class sheet of the material will fall from $77 today to just $8 in 2021. That means the additional backlight cost to make it QDEF-enabled will only be $10 by late 2020.
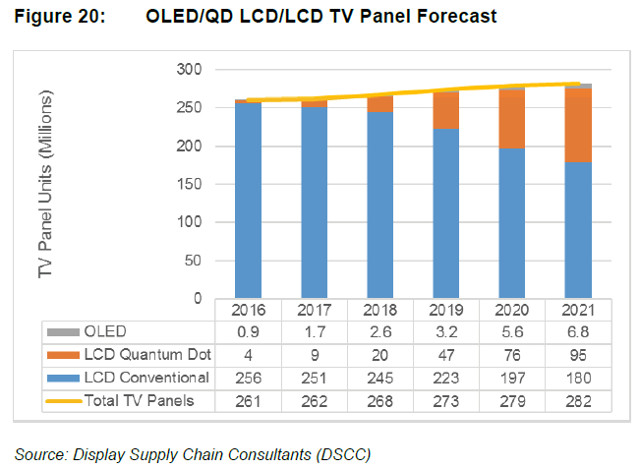
The report discusses some of the other implementations of quantum dots such as their use in color filters as well as electrically driven quantum dots, but these do not seem to play a big role in their 5-year forecast, which is shown above. Clearly, this group does not see a big change in the percentage of OLED TVs going forward, but a big change in QD-enabled TVs. – CC