Susan Noble, Service Manager for international data at the UK Data Service based at Jisc, talks about how we find out what people have actually done with the data we provide and why it’s important that we do what we do!
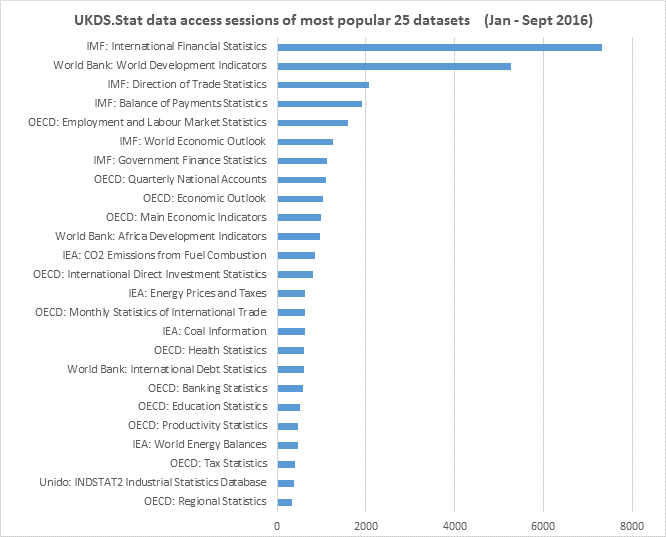
Over the period January to September in 2016 we recorded (via Google Analytics) 37,777 data access sessions and 45,642 downloads by users from 156 different countries using UKDS.Stat, the data dissemination platform for international data at the UK Data Service. The sessions are unique pageviews – i.e. aggregated dataset pageviews that are generated by the same user during the same session and the downloads are export pageviews – i.e. the number of times a user clicks on export to download a dataset:
Given this amount of international data usage, we were really keen to find out what people have actually done with the data we provide and why it’s important that we do what we do! In the past, finding out this impact information has been a very labour intensive challenge as there was no standard way of citing the data obtained via the UK Data Service. Nonetheless, since the emergence of a standard format for citing data from the UK Data Service things are definitely improving.
We began making the international data more ‘citable’ in 2010, when we added citation information (including DOIs) to each international dataset where it could be downloaded alongside the data. We’re still in the early stages of seeing the ‘fruits of data citation’ as there was an inevitable lag before academics began to use this new citation information in their research outputs. However, we decided now was the time to take a look at some of the research that has cited our socio-economic aggregate data and attempt to visualise that data. Here we have a word cloud generated using terms used in socio-economic aggregate data research publication titles (census and international data) – using http://www.wordclouds.com/:
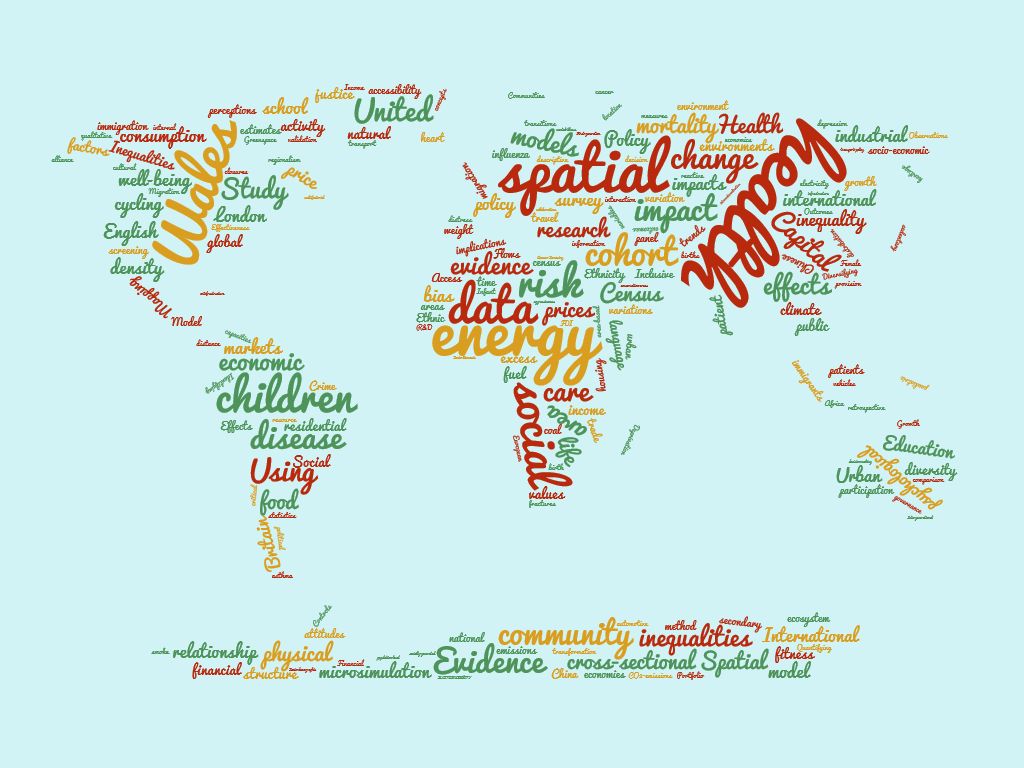
Or (to keep with ‘tree/fruits’ theme)…. a word cloud generated using terms used in socio-economic aggregate data research publication titles (census and international data) – using http://www.wordclouds.com/

Harvesting the publications citing socio-economic aggregate data
In order to find as many of the publications as possible that have used socio-economic aggregate data from the UK Data Service, we scoured Google Scholar using the following search terms:
- For international data: doi.org/10.5257 OR stats.ukdataservice.ac.uk
- For census data: doi.org/10.5257/census
- For InFuse Census data: infuse.mimas.ac.uk OR infuse.ukdataservice.ac.uk OR dx.doi.org/10.5257/census
- For Casweb Census data: casweb.mimas.ac.uk OR casweb.ukdataservice.ac.uk OR dx.doi.org/10.5257/census
- For GeoConvert conversion: “geoconvert.mimas.ac.uk” OR “geoconvert.ukdataservice.ac.uk” OR dx.doi.org/10.5257/census
Ideally, we wanted to use a single DOI as the search term, but we needed to include the actual data platform urls to ensure we captured the majority of publications that had used data from the Service, because not everybody cites the data they’ve used.
A search using Google Scholar for all publications citing international data obtained via UK Data Service returns 109 results (as on 20/10/2016) shows a diverse range of research – but only of research correctly citing the data. The following list of research publications show the interesting range of subjects addressed using international data, and each of these publications has been cited more than ten times:
- Cited 31 times. T Anderson, HP Kohler – ‘Education fever and the East Asian fertility puzzle: A case study of low fertility in South Korea’. 2013. Asian population studies, Taylor & Francis. Used the World Bank: World Development Indicators via UK Data Service.
- Cited 18 times. E Stockhammer – ‘Why have wage shares fallen? An analysis of the determinants of functional income distribution’. Wage-led Growth, Springer. Used the UNIDO: INDSTAT3 dataset via UK Data Service.
- Cited 16 times. HR Ellamla, I Staffell, P Bujlo, BG Pollet… – ‘Current status of fuel cell based combined heat and power systems for residential sector’. 2015. Journal of Power, Elsevier. Used the IEA: World Energy Balances dataset via UK Data Service.
- Cited 16 times. B Bajželj, JM Allwood, JM Cullen – ‘Designing climate change mitigation plans that add up’. 2013. Environmental science & … ACS Publications. Used the IEA: World Energy Balances dataset via UK Data Service.
- Cited 15 times. M Filippini, LC Hunt, J Zorić – ‘Impact of energy policy instruments on the estimated level of underlying energy efficiency in the EU residential sector’. 2014. Energy Policy, Elsevier. Used the IEA: Energy Balances of OECD Countries dataset via UK Data Service.
- Cited 13 times. S Johnson, S Arnold – ‘Inclusive financial markets: is transformation under way in Kenya?’ Development Policy Review, Wiley Online Library. Used the World Bank: World Development Indicators dataset via UK Data Service.
- Cited 11 times. S Goldfinger, M Wackernagel, A Galli, E Lazarus… – ‘Footprint facts and fallacies: A response to Giampietro and Saltelli (2014)“Footprints to Nowhere. 2014. Ecological …, Elsevier. Used IEA: CO2 Emissions from Fuel Combustion dataset via UK Data Service.
- Cited 11 times. H Mistry, AEP Heazell… – ‘A structured review and exploration of the healthcare costs associated with stillbirth and a subsequent pregnancy in England and Wales’. BMC …bmcpregnancychildbirth. Used IMF: World Economic Outlook dataset via UK Data Service.
- Cited 10 times. TG O’Higgins, AJ Gilbert – ‘Embedding ecosystem services into the Marine Strategy Framework Directive: illustrated by eutrophication in the North Sea’. Estuarine, Coastal and Shelf Science, Elsevier. Used IEA: World Energy Statistics dataset via UK Data Service.
- Cited 10 times. MO Adetutu – ‘Energy efficiency and capital-energy substitutability: Evidence from four OPEC countries’. 2014. Applied Energy, Elsevier. Used IEA data via UK Data Service.
In order to visualise this information, the next step was to extract it from Google Scholar – which it turned out, is not very straightforward! We used an open tool called “Publish or Perish” which uses Google Analytics and allows users to bulk download citations from Google Scholar into Excel fairly easily. We searched using the “General citations” feature in Publish or Perish. A screendump of a search for InFuse is displayed below:
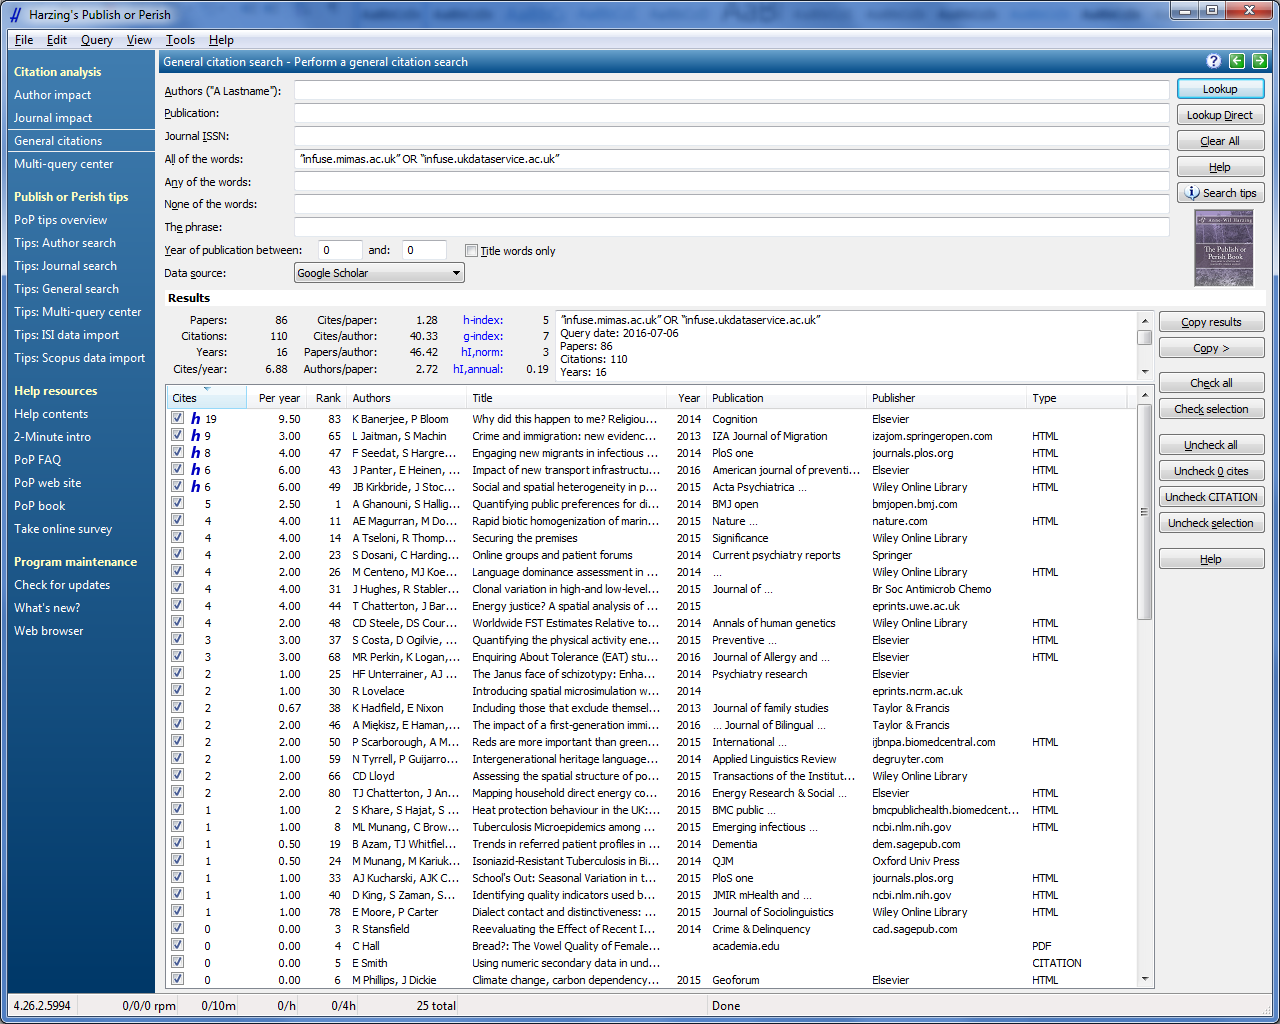
Google Analytics does not always retrieve all relevant fields (for example, we wanted article URL and year), and so some editing was needed. In addition we inserted a number of “dataset referenced” fields to capture which datasets were used in which publications.
Once ready, this information was exported into an Excel workbook and then used to create the simple alluvial diagram data visualisation shown below using the software Raw (http://raw.densitydesign.org – an open web app that allows non-technical users to create custom vector-based visualizations on top of the D3.js library through a very simple interface).
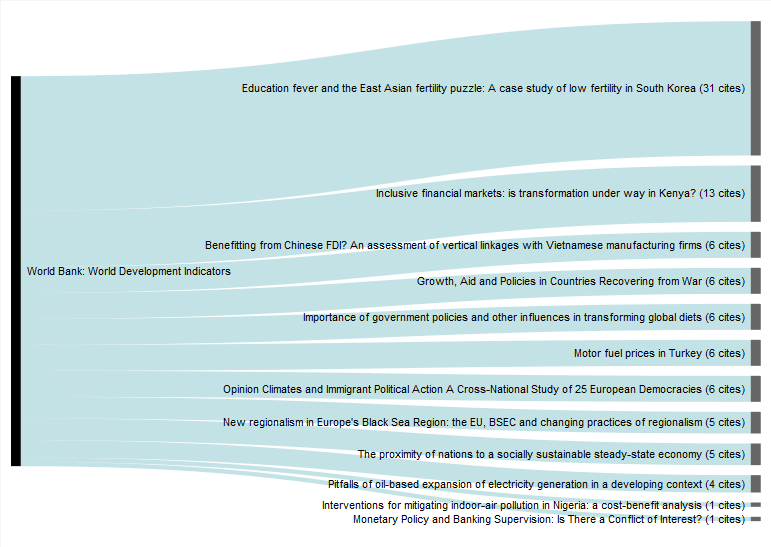
Publications on Google Scholar citing World Bank World Development Indicators via UK Data Service (and the number of subsequent citations), generated using extracted UKDS.Stat citations and http://raw.densitydesign.org/.
By harvesting citations periodically in this way we will continue to find out more about what is being done with the data we provide, but we’re always keen to hear directly from our users – so if you’re using any socio-economic aggregate data (international or census) in your research or teaching and would like to submit a case study of your data use we’d love to hear from you – simply download and complete the form and we’ll take it from there!
Other resources:
- Open Data at UK Data Service – https://www.ukdataservice.ac.uk/get-data/open-data/international-macrodata
- Publications on Google Scholar citing international data from UK Data Service.
- Citation harvesting – Publish or Perish – http://www.harzing.com/resources/publish-or-perish.
- Stat usage statistics – http://stats.ukdataservice.ac.uk/usage/dotstat/.
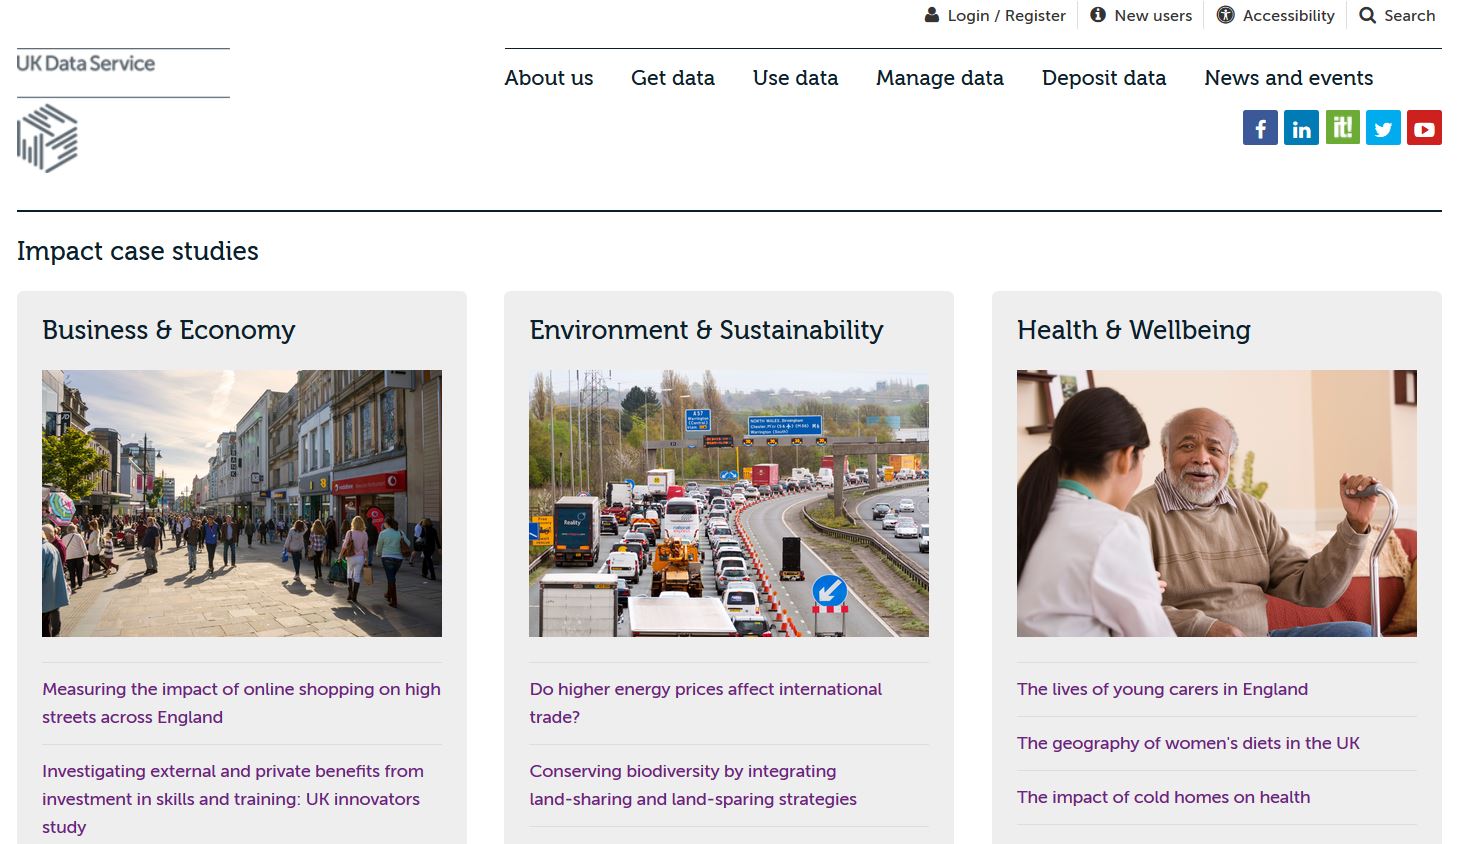
We have compiled a range of case studies demonstrating data use and its impact, search https://impact.ukdataservice.ac.uk/case-studies: